

Aneuploidy, TP53 mutation, and amplification of MYC correlate with increased intratumor heterogeneity and poor prognosis of breast cancer patients
- PMID: 29181861
- PMCID: PMC5807164
- DOI: 10.1002/gcc.22515
Aneuploidy, TP53 mutation, and amplification of MYC correlate with increased intratumor heterogeneity and poor prognosis of breast cancer patients
Abstract
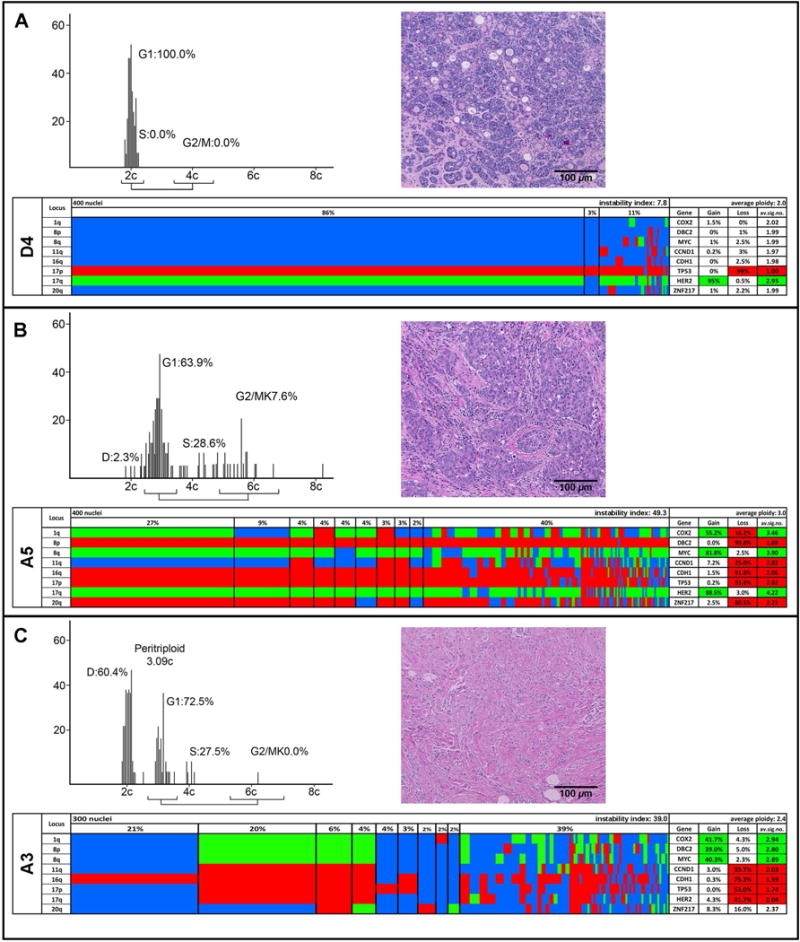
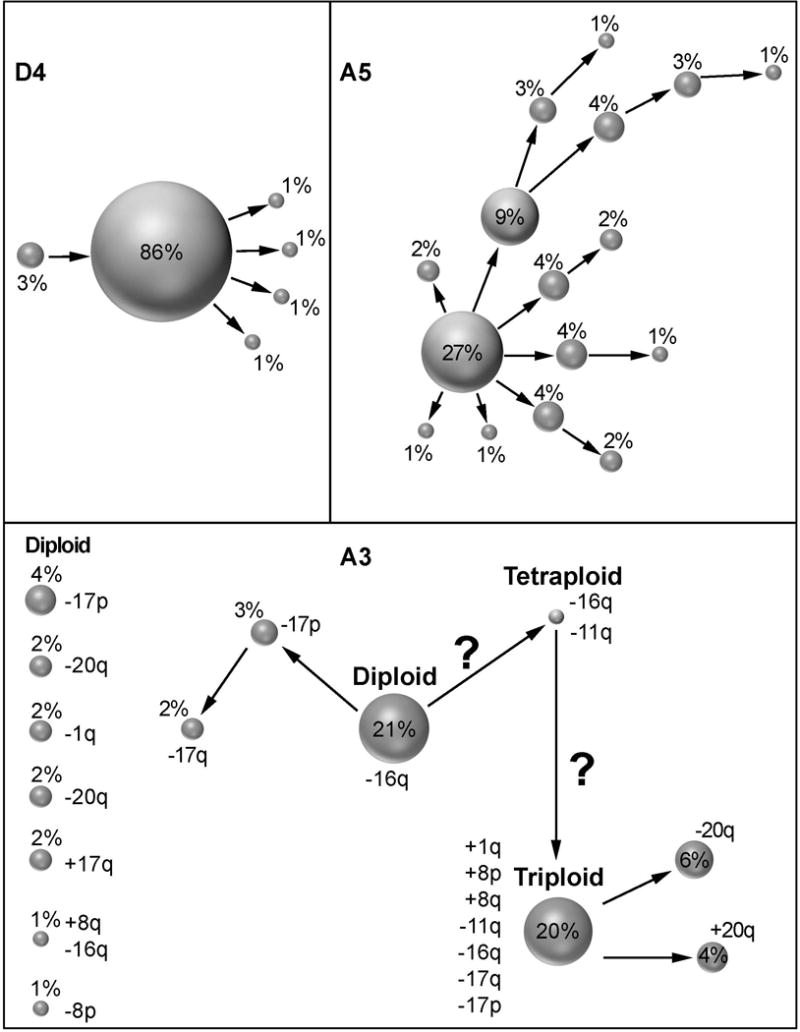
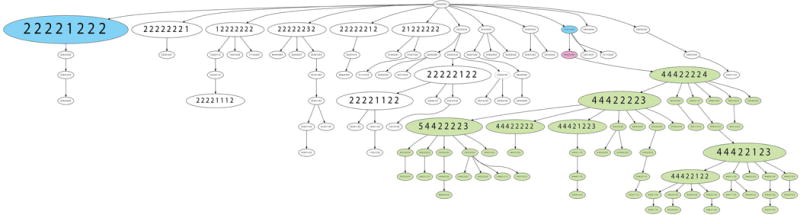
The clinical course of breast cancer varies from one patient to another. Currently, the choice of therapy relies on clinical parameters and histological and molecular tumor features. Alas, these markers are informative in only a subset of patients. Therefore, additional predictors of disease outcome would be valuable for treatment stratification. Extensive studies showed that the degree of variation of the nuclear DNA content, i.e., aneuploidy, determines prognosis. Our aim was to further elucidate the molecular basis of aneuploidy. We analyzed five diploid and six aneuploid tumors with more than 20 years of follow-up. By performing FISH with a multiplexed panel of 10 probes to enumerate copy numbers in individual cells, and by sequencing 563 cancer-related genes, we analyzed how aneuploidy is linked to intratumor heterogeneity. In our cohort, none of the patients with diploid tumors died of breast cancer during follow-up in contrast to four of six patients with aneuploid tumors (mean survival 86.4 months). The FISH analysis showed markedly increased genomic instability and intratumor heterogeneity in aneuploid tumors. MYC gain was observed in only 20% of the diploid cancers, while all aneuploid cases showed a gain. The mutation burden was similar in diploid and aneuploid tumors, however, TP53 mutations were not observed in diploid tumors, but in all aneuploid tumors in our collective. We conclude that quantitative measurements of intratumor heterogeneity by multiplex FISH, detection of MYC amplification and TP53 mutation could augment prognostication in breast cancer patients.
Keywords: FISH; MYC amplification; TP53 mutations; aneuploidy; breast cancer; intratumor heterogeneity.
Published 2018. This article is a US Government work and is in the public domain in the USA.
Figures
Similar articles
-
High Levels of Chromosomal Copy Number Alterations and TP53 Mutations Correlate with Poor Outcome in Younger Breast Cancer Patients.Am J Pathol. 2020 Aug;190(8):1643-1656. doi: 10.1016/j.ajpath.2020.04.015. Epub 2020 May 13. Am J Pathol. 2020. PMID: 32416097 Free PMC article.
-
Single Cell Genetic Profiling of Tumors of Breast Cancer Patients Aged 50 Years and Older Reveals Enormous Intratumor Heterogeneity Independent of Individual Prognosis.Cancers (Basel). 2021 Jul 5;13(13):3366. doi: 10.3390/cancers13133366. Cancers (Basel). 2021. PMID: 34282768 Free PMC article.
-
Inter-tumor genomic heterogeneity of breast cancers: comprehensive genomic profile of primary early breast cancers and relapses.Breast Cancer Res. 2020 Oct 15;22(1):107. doi: 10.1186/s13058-020-01345-z. Breast Cancer Res. 2020. PMID: 33059724 Free PMC article.
-
Common patterns of genetic evolution in human solid tumors.Cytometry. 1997 Sep 1;29(1):1-27. Cytometry. 1997. PMID: 9298807 Review.
-
Carcinoma in situ of the female breast. A clinico-pathological, immunohistological, and DNA ploidy study.APMIS Suppl. 2003;(108):1-67. APMIS Suppl. 2003. PMID: 12874968 Review.
Cited by
-
Prostate puzzle: Unconventional prostatic STUMP findings in a middle-aged patient prompt closer examination.Radiol Case Rep. 2024 Nov 22;20(2):882-885. doi: 10.1016/j.radcr.2024.10.104. eCollection 2025 Feb. Radiol Case Rep. 2024. PMID: 39654588 Free PMC article.
-
Tumor heterogeneity assessed by sequencing and fluorescence in situ hybridization (FISH) data.Bioinformatics. 2021 Dec 11;37(24):4704-4711. doi: 10.1093/bioinformatics/btab504. Bioinformatics. 2021. PMID: 34289030 Free PMC article.
-
A Comparative Analysis of Tumors and Plasma Circulating Tumor DNA in 145 Advanced Cancer Patients Annotated by 3 Core Cellular Processes.Cancers (Basel). 2020 Mar 16;12(3):701. doi: 10.3390/cancers12030701. Cancers (Basel). 2020. PMID: 32188081 Free PMC article.
-
Chromosome evolution screens recapitulate tissue-specific tumor aneuploidy patterns.Nat Genet. 2024 May;56(5):900-912. doi: 10.1038/s41588-024-01665-2. Epub 2024 Feb 22. Nat Genet. 2024. PMID: 38388848 Free PMC article.
-
Identification of genomic features associated with immunotherapy response in gastrointestinal cancers.World J Gastrointest Oncol. 2019 Apr 15;11(4):270-280. doi: 10.4251/wjgo.v11.i4.270. World J Gastrointest Oncol. 2019. PMID: 31040893 Free PMC article. Review.
References
-
- Aparicio S, Caldas C. The implications of clonal genome evolution for cancer medicine. N Engl J Med. 2013;368(9):842–851. - PubMed
-
- Auer GU, Eriksson E, Azavedo E, Caspersson T, Wallgren A. Prognostic significance of nuclear DNA content in mammary adenocarcinomas in humans. Cancer Res. 1984;44:394–396. - PubMed
-
- Boikos SA, Pappo AS, Killian JK, LaQuaglia MP, Weldon CB, George S, Trent JC, von Mehren M, Wright JA, Schiffman JD, Raygada M, Pacak K, Meltzer PS, Miettinen MM, Stratakis C, Janeway KA, Helman LJ. Molecular subtypes of KIT/PDGFRA wild-type gastrointestinal stromal tumors: a report from the National Institutes of Health gastrointestinal stromal tumor clinic. JAMA Oncol. 2016;2(7):922–928. - PMC - PubMed
-
- Burrell RA, McGranahan N, Bartek J, Swanton C. The causes and consequences of genetic heterogeneity in cancer evolution. Nature. 2013;501(7467):338–345. - PubMed
Publication types
MeSH terms
Substances
Grants and funding
LinkOut - more resources
Full Text Sources
Other Literature Sources
Medical
Research Materials
Miscellaneous
