. 2018 Feb;39(2):1024-1042.
doi: 10.1002/hbm.23902. Epub 2017 Nov 27.

Real-time fMRI neurofeedback of the mediodorsal and anterior thalamus enhances correlation between thalamic BOLD activity and alpha EEG rhythm

Affiliations

Real-time fMRI neurofeedback of the mediodorsal and anterior thalamus enhances correlation between thalamic BOLD activity and alpha EEG rhythm

Vadim Zotev et al. Hum Brain Mapp. 2018 Feb.

Abstract

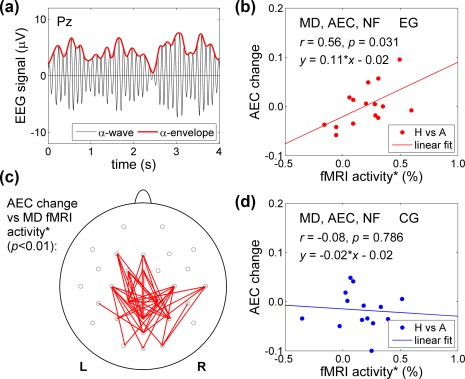
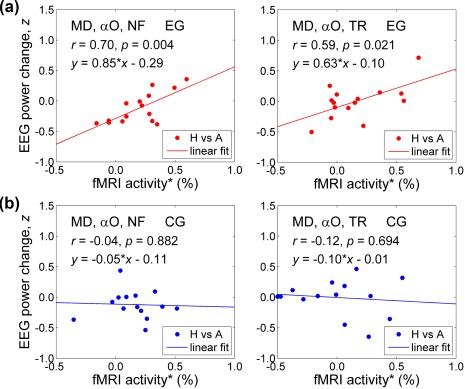
Real-time fMRI neurofeedback (rtfMRI-nf) with simultaneous EEG allows volitional modulation of BOLD activity of target brain regions and investigation of related electrophysiological activity. We applied this approach to study correlations between thalamic BOLD activity and alpha EEG rhythm. Healthy volunteers in the experimental group (EG, n = 15) learned to upregulate BOLD activity of the target region consisting of the mediodorsal (MD) and anterior (AN) thalamic nuclei using rtfMRI-nf during retrieval of happy autobiographical memories. Healthy subjects in the control group (CG, n = 14) were provided with a sham feedback. The EG participants were able to significantly increase BOLD activities of the MD and AN. Functional connectivity between the MD and the inferior precuneus was significantly enhanced during the rtfMRI-nf task. Average individual changes in the occipital alpha EEG power significantly correlated with the average MD BOLD activity levels for the EG. Temporal correlations between the occipital alpha EEG power and BOLD activities of the MD and AN were significantly enhanced, during the rtfMRI-nf task, for the EG compared to the CG. Temporal correlations with the alpha power were also significantly enhanced for the posterior nodes of the default mode network, including the precuneus/posterior cingulate, and for the dorsal striatum. Our findings suggest that the temporal correlation between the MD BOLD activity and posterior alpha EEG power is modulated by the interaction between the MD and the inferior precuneus, reflected in their functional connectivity. Our results demonstrate the potential of the rtfMRI-nf with simultaneous EEG for noninvasive neuromodulation studies of human brain function.

Keywords: EEG-fMRI; alpha rhythm; anterior nucleus; dorsal striatum; mediodorsal nucleus; memory; neurofeedback; precuneus; real-time fMRI; thalamus.


Figures

Figure 1
Figure 1
Experimental paradigm for real‐time fMRI neurofeedback modulation of the thalamus with simultaneous EEG recordings. (a) Target region of interest (ROI) used to provide the rtfMRI‐nf signal for the experimental group (EG). The target ROI consists of two thalamic nuclei: the anterior nucleus (AN, red) and the mediodorsal nucleus (MD, orange). The nuclei are defined anatomically according to the stereotaxic atlas of the human brain by Talairach and Tournoux. They are projected in the figure onto the standard anatomical template TT_N27 in the Talairach space. The cross‐section of the whole thalamus is shown in a darker grey color. (b) Generation of the sham feedback signal for the control group (CG). The sham signal waveform is computed for a 40‐s‐long condition block as a random linear combination of seven Legendre polynomials. (c) A 32‐channel MR‐compatible EEG system used to perform EEG recordings simultaneously with fMRI data acquisition. (d) Occipital (O1, O2, Oz) and parietal (P3, P4, Pz) EEG channels commonly used to study posterior alpha EEG activity [Color figure can be viewed at http://wileyonlinelibrary.com]
Figure 2
Figure 2
Protocol for the rtfMRI‐nf experiment. (a) Real‐time GUI display screens for three experimental conditions: Happy Memories, Attend, and Count. The variable‐height rtfMRI‐nf bar (red) is shown during each condition, and its height is updated every 2 s. The fixed blue bar denotes the zero level. (b) Protocol for the rtfMRI‐nf experiment includes seven runs, each lasting 8 min 46 s: Rest (RE), Run 1 (R1), Run 2 (R2), Run 3 (R3), Run 4 (R4), Transfer (TR), and Rest (RE). The experimental runs (except the Rest) consist of 40‐s‐long blocks of Happy Memories (H), Attend (A), and Count (C) conditions. No bars are shown during the Transfer run [Color figure can be viewed at http://wileyonlinelibrary.com]
Figure 3
Figure 3
Definition of EEG‐based regressors for the psychophysiological interaction (PPI) analyses of EEG‐fMRI data. A general linear model (GLM) for a PPI analysis includes one PPI correlation regressor, one PPI interaction regressor, block‐design stimulus regressors, and nuisance covariates. The PPI regressors are defined here using the time course of the normalized occipital alpha EEG power (αO) converted to z scores across each run. (a) Convolution of the EEG power z scores (cyan, 200 ms sampling) with the hemodynamic response function (HRF) yields the EEG‐based PPI correlation regressor (red). (b) Definition of the [Happy − Attend] contrast function. It is equal to +1 for the Happy Memories (H) condition blocks, −1 for the following Attend (A) condition blocks, and 0 for all other points. The condition blocks are depicted schematically in Figure 2b. (c) Convolution of the EEG power z scores multiplied by the [Happy − Attend] contrast function (cyan) with the HRF yields the EEG‐based PPI interaction regressor for the Happy vs Attend condition contrast (red). (d) Definition of the [Happy − Count] contrast function. It is equal to +1 for the Happy Memories (H) condition blocks, −1 for the Count (C) condition blocks, and 0 for all other points. (e) Convolution of the EEG power z scores multiplied by the [Happy − Count] contrast function (cyan) with the HRF yields the EEG‐based PPI interaction regressor for the Happy vs Count condition contrast (red) [Color figure can be viewed at http://wileyonlinelibrary.com]
Figure 4
Figure 4
BOLD activity levels for the anterior and mediodorsal thalamic nuclei during the rtfMRI‐nf experiment. (a) Average fMRI percent signal changes for the anterior nucleus (AN) and the mediodorsal nucleus (MD) for the experimental group (EG). The two nuclei were parts of the target ROI for the rtfMRI‐nf (Figure 1a). Each bar represents a mean GLM‐based fMRI percent signal change for the corresponding ROI with respect to the Attend baseline for the Happy Memories (H vs A) or Count (C vs A) conditions in a given run, averaged across the group. The error bars are standard errors of the means (sem) for the group average. The experimental runs and condition blocks are depicted schematically in Figure 2b. (b) Corresponding average fMRI percent signal changes for the AN and MD for the control group (CG) [Color figure can be viewed at http://wileyonlinelibrary.com]
Figure 5
Figure 5
Functional connectivity of the mediodorsal nucleus during the rtfMRI‐nf task compared between the groups. fMRI functional connectivity analyses were performed for the Happy Memories conditions in each run using the mediodorsal nucleus (MD) ROI as the seed. The results were averaged for the last two rtfMRI‐nf runs (Runs 3,4) for each participant. Statistical maps for the experimental versus control group difference (EG vs CG) in the average MD functional connectivity are shown for four regions (Table 1): (a) the right medial precuneus (BA 31); (b) the left anterior cingulate (BA 32); (c) the left inferior frontal gyrus (BA 47); (d) the left precentral gyrus (BA 6). The maps are projected onto the TT_N27 template in the Talairach space. Following the radiological notation, the left hemisphere (L) is shown to the reader's right. The crosshairs mark locations of the statistical peaks for the group difference (Table 1) [Color figure can be viewed at http://wileyonlinelibrary.com]
Figure 6
Figure 6
Amplitude modulation of alpha EEG rhythm during the rtfMRI‐nf training and its correlation with BOLD activity of the mediodorsal nucleus. (a) Envelope of alpha EEG activity obtained via the Hilbert transform. Temporal correlation between alpha envelopes for a pair of EEG channels is referred to as the alpha envelope correlation (AEC). (b) Significant positive correlation between the individual AEC changes for the Happy versus Attend conditions (H vs A), averaged across all EEG channel pairs (n = 406), and the corresponding fMRI activity* levels (H vs A) for the mediodorsal nucleus (MD) ROI. The results are for the experimental group (EG), and each data point corresponds to one participant. The fMRI activity (marked with *) is the part of the total MD BOLD activity that did not exhibit temporal correlation with the average BOLD activity of the visual cortex V1/V2 (see text). Each participants's data are averaged for the last two rtfMRI‐nf runs (Runs 3,4). (c) Correlations between the individual AEC changes (H vs A) and the corresponding MD fMRI activity* levels (H vs A) for EEG channel pairs for the EG. Each red segment denotes a pair of EEG channels for which the correlation is positive (r > 0, p < .01, uncorr.). Negative correlations (r < 0) did not reach the p < .01 statistical threshold. Each participants's data are averaged for Runs 3,4. (d) Lack of correlation between the individual AEC changes, averaged across all channel pairs, and the corresponding MD fMRI activity* levels for the control group (CG) [Color figure can be viewed at http://wileyonlinelibrary.com]
Figure 7
Figure 7
Correlations between variations in the mean occipital alpha EEG power and BOLD activity of the mediodorsal nucleus during the rtfMRI‐nf experiment. (a) Significant positive correlations between the mean individual Happy versus Attend (H vs A) changes in z scores of the normalized occipital alpha EEG power, z(αO), and the corresponding fMRI activity* levels for the MD ROI for the experimental group (EG). As in Figure 6, the fMRI activity* is the part of the total MD BOLD activity that did not show temporal correlation with the average BOLD activity of the visual cortex V1/V2. Each data point corresponds to one participant. The plot on the left (NF) shows correlation for the participants’ individual data averaged for the last two rtfMRI‐nf runs (Runs 3,4). The plot on the right (TR) shows correlation for the Transfer run without nf. (b) Lack of correlations between corresponding measures for the control group (CG) [Color figure can be viewed at http://wileyonlinelibrary.com]
Figure 8
Figure 8
Changes in temporal correlations between occipital alpha EEG power and BOLD activities of the anterior and mediodorsal nuclei across experimental conditions. (a) Average values of the psychophysiological interaction (PPI) effects for the anterior (AN) and mediodorsal (MD) thalamic nuclei for the experimental group (EG) and the control group (CG). Time courses of z scores of the normalized occipital alpha EEG power, z(αO), were used in the PPI analyses as illustrated in Figure 3. The EEG‐based PPI interaction effect for the Happy versus Attend condition contrast is denoted in the figure as “H vs A,” and the EEG‐based PPI interaction effect for the Happy vs Count condition contrast is denoted as “H vs C.” The voxel‐wise PPI interaction values were averaged within the AN and MD ROIs (Figure 1a) and across the four rtfMRI‐nf runs (Runs 1–4) for each participant. Each bar represents a group average. The error bars are standard errors of the means (sem). The t scores and p values in the figure correspond to the EG versus CG group difference (df = 27). (b) Illustration of the PPI effects for the EG using single‐subject data. The top plot shows positive correlation between the EEG‐based regressor and the fMRI time course for the AN ROI during three Happy Memories (H) condition blocks in one nf run (Figure 2b) concatenated together in the figure. The middle plot demonstrates lack of correlation between these time courses during three concatenated Attend (A) condition blocks, following the Happy Memories blocks in the same run. The bottom plot shows negative correlation between these time courses during three concatenated Count (C) condition blocks in the same run [Color figure can be viewed at http://wileyonlinelibrary.com]
Figure 9
Figure 9
Enhancement in temporal correlation between occipital alpha EEG power and BOLD activity during the rtfMRI‐nf task relative to the Attend task compared between the groups. Statistical maps for the experimental versus control group difference (EG vs CG) in the EEG‐based PPI interaction effect for the Happy vs Attend condition contrast are shown. Time courses of z scores of the normalized occipital alpha EEG power, z(αO), and the [Happy − Attend] contrast function were used to define the PPI regressors as illustrated in Figure 3a–c. The PPI interaction results for the four rtfMRI‐nf runs (Runs 1–4) were averaged for each participant. The maps are projected onto the TT_N27 template in the Talairach space, with 3 mm separation between axial slices. The number adjacent to each slice indicates the z coordinate in mm. The left hemisphere (L) is to the reader's right. Peak t statistics values for the group difference and the corresponding locations are specified in Table 2 [Color figure can be viewed at http://wileyonlinelibrary.com]
Figure 10
Figure 10
Enhancement in temporal correlation between occipital alpha EEG power and BOLD activity during the rtfMRI‐nf task relative to the Count task compared between the groups. Statistical maps for the experimental versus control group difference (EG vs CG) in the EEG‐based PPI interaction effect for the Happy versus Count condition contrast are shown. Time courses of z scores of the normalized occipital alpha EEG power, z(αO), and the [Happy − Count] contrast function were used to define the PPI regressors as illustrated in Figure 3a,d,e. The PPI interaction results for the four rtfMRI‐nf runs (Runs 1–4) were averaged for each subject. The maps are projected onto the TT_N27 template in the Talairach space, with 3 mm separation between axial slices. The number adjacent to each slice indicates the z coordinate in mm. The left hemisphere (L) is to the reader's right. Peak t statistics values for the group difference and the corresponding locations are specified in Table 3 [Color figure can be viewed at http://wileyonlinelibrary.com]

Similar articles

Cited by

References

    1. Alexander, G. E. , Crutcher, M. D. , & DeLong, M. R. (1991). Basal ganglia‐thalamocortical circuits: Parallel substrates for motor, oculomotor, “prefrontal” and “limbic” functions. Progress in Brain Research, 85, 119–146. - PubMed
    1. Allen, E. A. , Erhardt, E. B. , Damaraju, E. , Gruner, W. , Segall, J. M. , Silva, R. F. , … Calhoun, V. D. (2011). A baseline for the multivariate comparison of resting‐state networks. Frontiers in Systems Neuroscience, 5, 2. - PMC - PubMed
    1. Başar, E. (2012). A review of alpha activity in integrative brain function: Fundamental physiology, sensory coding, cognition and pathology. International Journal of Psychophysiology, 86, 1–24. - PubMed
    1. Bell, A. J. , & Sejnowski, T. J. (1995). An information‐maximization approach to blind separation and blind deconvolution. Neural Computation, 7, 1129–1159. - PubMed
    1. Birbaumer, N. , Ruiz, S. , & Sitaram, R. (2013). Learned regulation of brain metabolism. Trends in Cognitive Sciences, 17, 295–302. - PubMed