. 2017 Nov 28:6:e27798.
doi: 10.7554/eLife.27798.

Rapid re-identification of human samples using portable DNA sequencing

Affiliations

Rapid re-identification of human samples using portable DNA sequencing

Sophie Zaaijer et al. Elife. .

Abstract

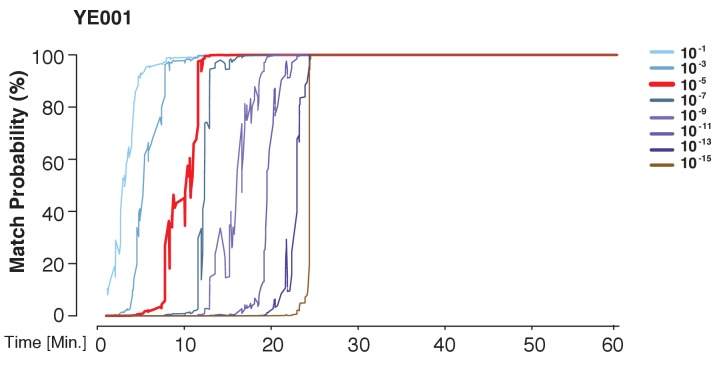
DNA re-identification is used for a broad suite of applications, ranging from cell line authentication to forensics. However, current re-identification schemes suffer from high latency and limited access. Here, we describe a rapid, inexpensive, and portable strategy to robustly re-identify human DNA called 'MinION sketching'. MinION sketching requires as few as 3 min of sequencing and 60-300 random SNPs to re-identify a sample enabling near real-time applications of DNA re-identification. Our method capitalizes on the rapidly growing availability of genomic reference data for cell lines, tissues in biobanks, and individuals. This empowers the application of MinION sketching in research and clinical settings for periodic cell line and tissue authentication. Importantly, our method enables considerably faster and more robust cell line authentication relative to current practices and could help to minimize the amount of irreproducible research caused by mix-ups and contamination in human cell and tissue cultures.

Keywords: DNA fingerprinting; cell biology; cell line authentication; evolutionary biology; forensics; genomics; human; nanopore sequencing; re-identification.


Conflict of interest statement

No competing interests declared.

YE is a consultant for DNA forensics company ArcBIO and co-founder of DNA.land.

Figures

Figure 1.
Figure 1.. Schematic overview of MinION sketching.
A DNA sample is prepared for shotgun sequencing. Libraries are prepared either for 1D or 2D MinION sequencing (without and with hairpin, respectively). Variants observed in aligned MinION reads are only selected if they coincide with known polymorphic loci while others are treated as errors. These SNPs are compared to a candidate reference database comprised of samples genotyped with whole genome sequencing or sparse genome-wide arrays (~600K-900K SNPs per candidate file). A Bayesian framework computes the posterior probability that the sample matches an individual in the database by accounting for the sequencing error rate (ε). This results in an output plot where the posterior probability is visualized as a function of time and the number of SNPs used in the computation.
Figure 2.
Figure 2.. Re-identification of three DNA samples against a database with 31,000 individuals.
(A) A Frappe plot showing the population structure of the database with a collection of 31,000 genome-wide SNP arrays. (B–D) The match probability is inferred by comparing a MinION sketch to its reference file as a function of the MinION sketching time (red line) and the number of SNPs analyzed. The prior probability for a match was set to 10−5. The match probabilities are inferred by comparing the MinION sketches to a database with 31,000 genome-wide SNP arrays (including the matched individuals). Right: Ancestral background of the corresponding individuals; only ancestry predictions of >10% are indicated. (B) The DNA sample was collected from an Ashkenazi-Uzbeki male (YE001) and sequenced using R7 chemistry. (C) The sample was collected from a Northern European female (SZ001) and sequenced using R9 chemistry. (D) The sample was collected from a Northern European-Italian-Ashkenazi male (JP001) and sequenced using R9 chemistry.
Figure 2—figure supplement 1.
Figure 2—figure supplement 1.. A prior representing a database larger than the world population still allows for identification power.
The match probability is inferred by comparing a MinION sketch of YE001 to its reference file as a function of the MinION sketching time. The prior probability for a match was modified as indicated.
Figure 3.
Figure 3.. Re-identification of HapMap sample NA12890.
The match probability is inferred by comparing a MinION sketch of NA12890 to the reference files of her own genome (red), her son’s genome (black), and her granddaughter’s genome (purple), as a function of the MinION sketching time (red line). The prior probability for a match was set to 10−5. Inset: the pedigree of 1000Genomes sample NA12890
Figure 4.
Figure 4.. Cell line authentication.
Barcoded DNA from the THP1 cell line is mixed 1:1 with a random, barcoded sample. Analysis of only the THP1 reads was used to infer ‘pure’ matches, while analyses of the mixture were used to characterize the efficiency of matching using contaminated samples. The match probability is inferred by comparing a MinION sketch to 1,099 reference files that are part of the cancer cell line encyclopedia (CCLE) generated by the Broad Institute (grey). (A) The posterior probability for an exact match between the MinION sketch of the ‘pure’ cell line THP1 (considering a single barcode) and the reference file generated by the CCLE (the red line indicates the THP1 reference file, other strains are depicted in grey). The posterior probability is plotted as a function of the sketching time and number of SNPs analyzed. (B) 10,000 simulated runs of sketching the THP1 cell line were matched against its reference file. The number of SNPs used to reach a 99.9% match (x-axis), is plotted against the number of times it is observed (y-axis). (C) The posterior probability that the contaminated (50% mixed) sample matched THP1 is plotted as a function of the sketching time and number of SNPs analyzed.
Figure 4—figure supplement 1.
Figure 4—figure supplement 1.. Cell line authentication.
(A) 10,000 simulated runs of sketching SZ001 were matched against its reference file. The number of SNPs used to reach a 99.9% match is depicted in a histogram. (B) The number of mismatches encountered between the MinION sketch and the reference file to reach a match probability of 99.9% for the 10,000 simulated runs of the THP1 cell line against its reference file. The x-axis shows the number of SNPs needed to infer a 99.9% match. The y-axis shows the number of (homozygous) mismatches.
Figure 5.
Figure 5.. Contamination simulations.
Random reads from a run with DNA from THP1 cells and a random, barcoded sample (the contaminant) are mixed in the indicated proportions and shuffled. This simulated MinION sketch is matched against the THP1 reference file, and the contaminant reference file. This process is repeated five times for each simulated contamination (pink, light-pink, purple, green and yellow lines). The match probability here is a function of the number of SNPs analyzed.
Figure 5—figure supplement 1.
Figure 5—figure supplement 1.. Theoretical effect of differences in doubling time of contaminants in a cell culture.
We set the doubling time of our cell line of interest to 24 hr. We hypothesized that our culture (with a starting number of 106 cells) would be contaminated with 10 foreign cells. We considered a doubling time of the contaminant cell line that is 4 hr, 2 hr, 1 hr and 30 min shorter than that of the original cell line. Taking various differences in doubling time shows the change in cell population over a 4-week period; this is assuming the cells are in log phase. The x-axis shows the time in weeks, the y-axis the percentage of contaminant cells in the population (number of contaminant cells/total number of cells).
Figure 6.
Figure 6.. Rapid library preparation.
(A) Schematic of the steps from sample to MinION sketch. The current method requires ~55 min until the MinION starts to generate reads. (B) The match probability is inferred by comparing a MinION sketch generated by transposase-mediated adaptor ligation (the rapid kit) to its reference file as a function of the number of SNPs analyzed. The prior probability for a match was set to 10−5. The rapid library protocol was tested in the lab. The MinION sketch was generated from sample SZ001. The library was prepared in 55 min in the laboratory. After analyzing 239 informative SNPs the posterior match probability exceeded 99.9%.

References

    1. Almeida JL, Cole KD, Plant AL. Standards for cell line authentication and beyond. PLoS Biology. 2016;14:e1002476. doi: 10.1371/journal.pbio.1002476. - DOI - PMC - PubMed
    1. Alston-Roberts C, Bauer SR, Bauer SR, American Type Culture Collection Standards Development Organization Workgroup ASN-0002 Cell line misidentification: the beginning of the end. Nature Reviews. Cancer. 2010;10:441–448. doi: 10.1038/nrc2852. - DOI - PubMed
    1. AMS Reproducibility and reliability of biomedical research: improving research practice. 2015 https://acmedsci.ac.uk/viewFile/56314e40aac61.pdf
    1. ATCC Authentication of human cell lines: Standardization of STR profiling. 2011 http://webstore.ansi.org/RecordDetail.aspx?sku=ANSI%2FATCC+ASN-0002-2011
    1. Barretina J, Caponigro G, Stransky N, Venkatesan K, Margolin AA, Kim S, Wilson CJ, Lehár J, Kryukov GV, Sonkin D, Reddy A, Liu M, Murray L, Berger MF, Monahan JE, Morais P, Meltzer J, Korejwa A, Jané-Valbuena J, Mapa FA, Thibault J, Bric-Furlong E, Raman P, Shipway A, Engels IH, Cheng J, Yu GK, Yu J, Aspesi P, de Silva M, Jagtap K, Jones MD, Wang L, Hatton C, Palescandolo E, Gupta S, Mahan S, Sougnez C, Onofrio RC, Liefeld T, MacConaill L, Winckler W, Reich M, Li N, Mesirov JP, Gabriel SB, Getz G, Ardlie K, Chan V, Myer VE, Weber BL, Porter J, Warmuth M, Finan P, Harris JL, Meyerson M, Golub TR, Morrissey MP, Sellers WR, Schlegel R, Garraway LA. The cancer cell line encyclopedia enables predictive modelling of anticancer drug sensitivity. Nature. 2012;483:603–307. doi: 10.1038/nature11003. - DOI - PMC - PubMed

Publication types

LinkOut - more resources