. 2018 Jun;15(3):033001.
doi: 10.1088/1741-2552/aa9dae. Epub 2017 Nov 28.

Multi-scale, multi-modal analysis uncovers complex relationship at the brain tissue-implant neural interface: new emphasis on the biological interface

Affiliations

Multi-scale, multi-modal analysis uncovers complex relationship at the brain tissue-implant neural interface: new emphasis on the biological interface

Nicholas J Michelson et al. J Neural Eng. 2018 Jun.

Abstract

Objective: Implantable neural electrode devices are important tools for neuroscience research and have an increasing range of clinical applications. However, the intricacies of the biological response after implantation, and their ultimate impact on recording performance, remain challenging to elucidate. Establishing a relationship between the neurobiology and chronic recording performance is confounded by technical challenges related to traditional electrophysiological, material, and histological limitations. This can greatly impact the interpretations of results pertaining to device performance and tissue health surrounding the implant.

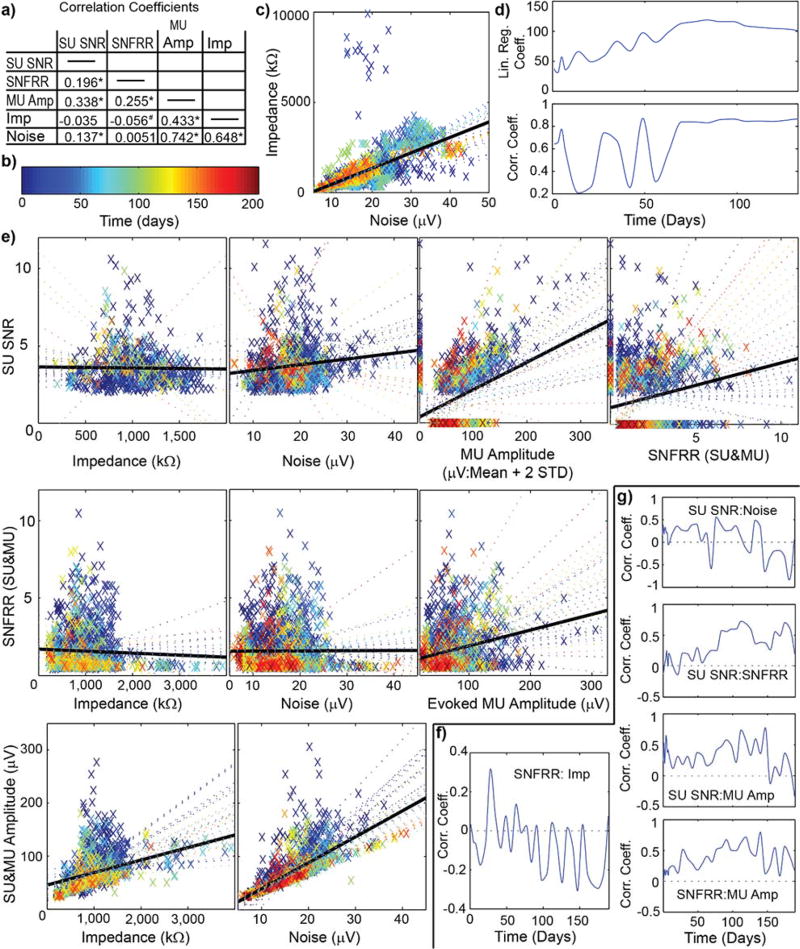
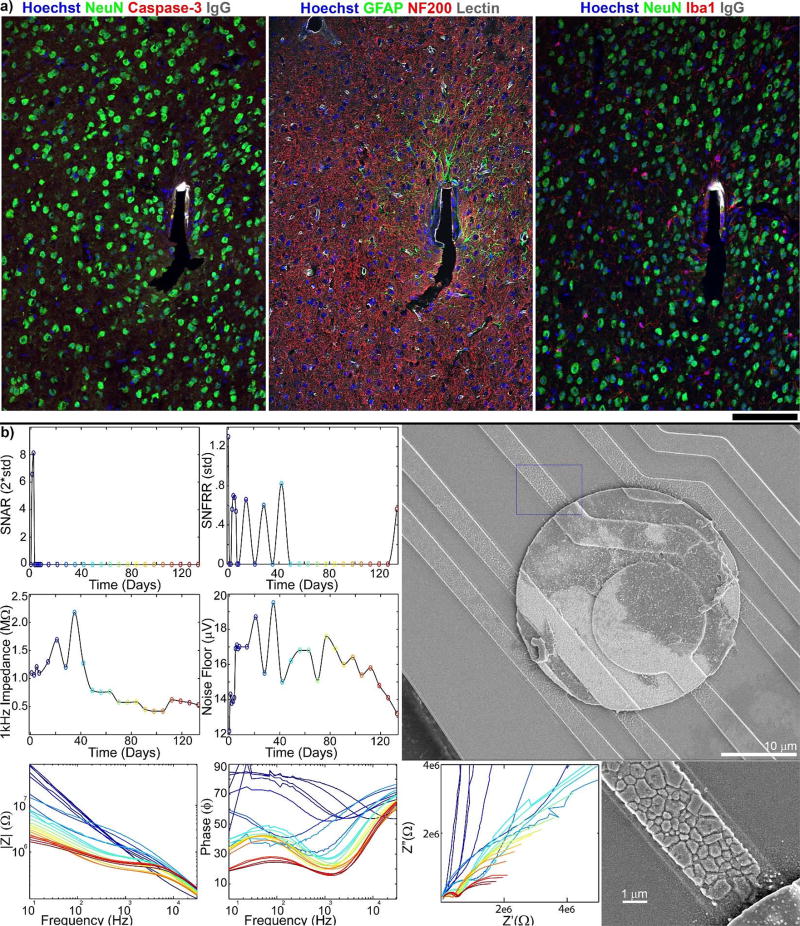
Approach: In this work, electrophysiological activity and immunohistological analysis are compared after controlling for motion artifacts, quiescent neuronal activity, and material failure of devices in order to better understand the relationship between histology and electrophysiological outcomes.

Main results: Even after carefully accounting for these factors, the presence of viable neurons and lack of glial scarring does not convey single unit recording performance.

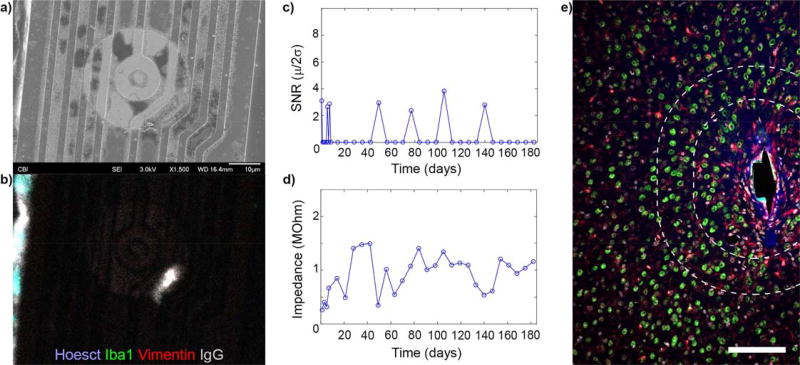
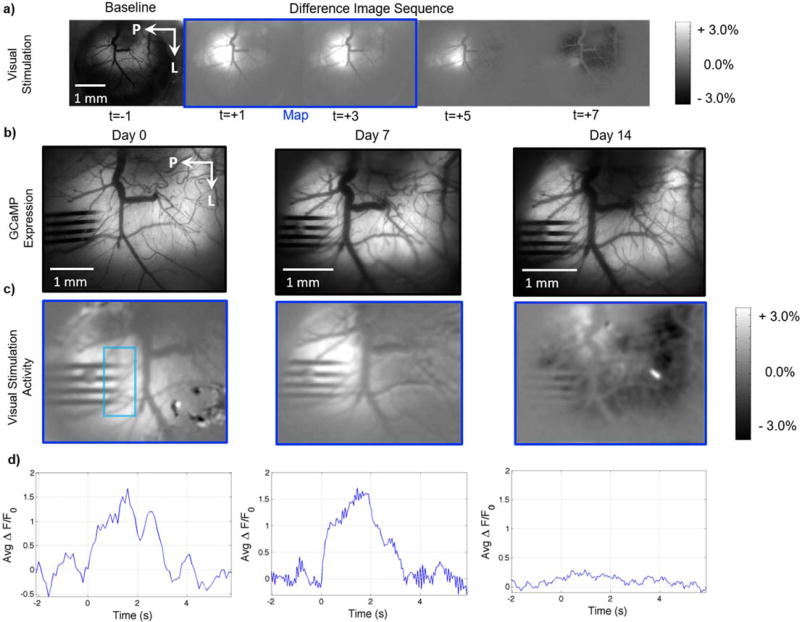
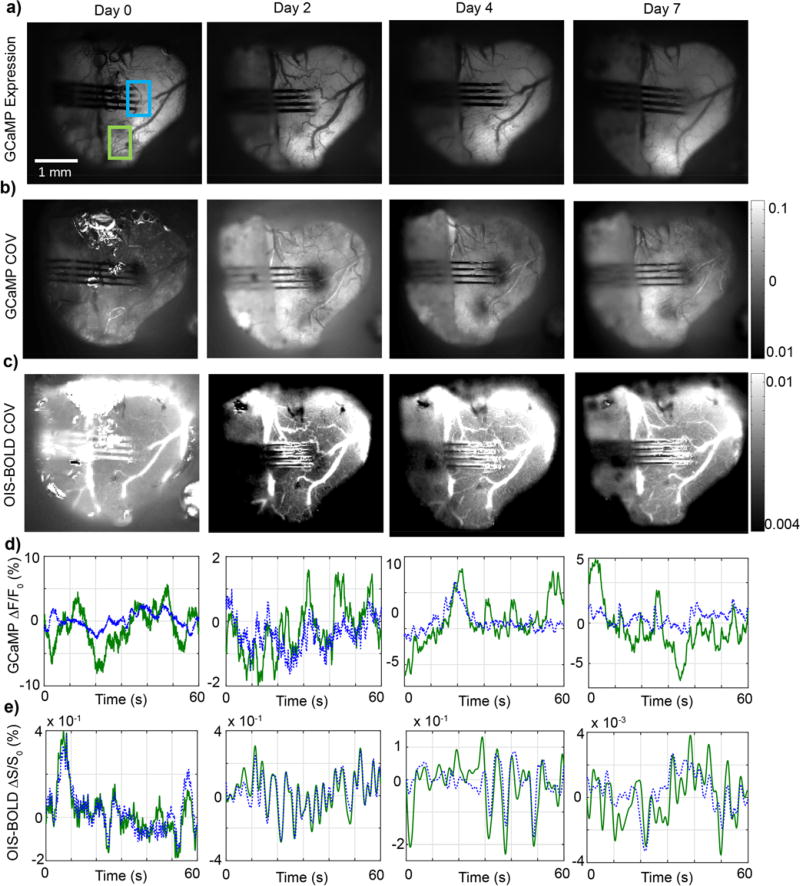
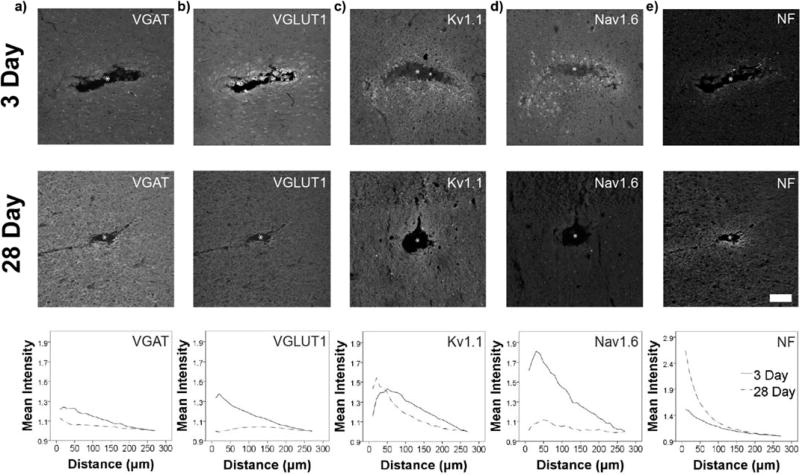
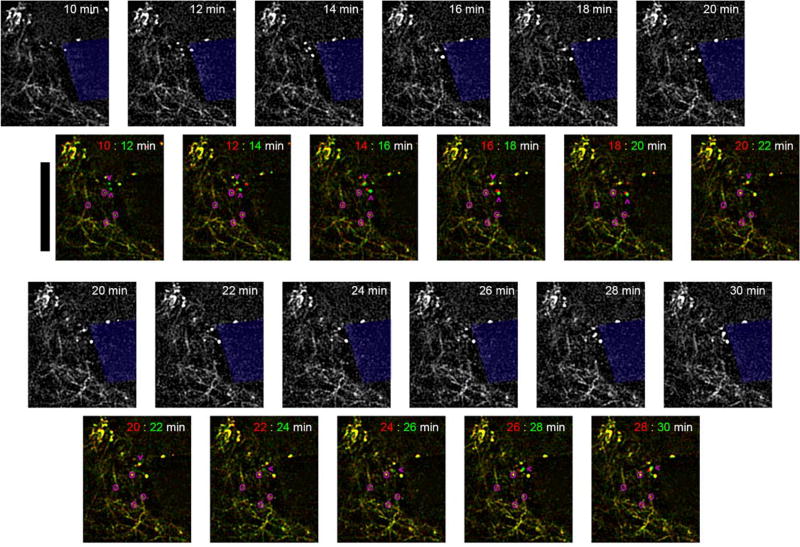
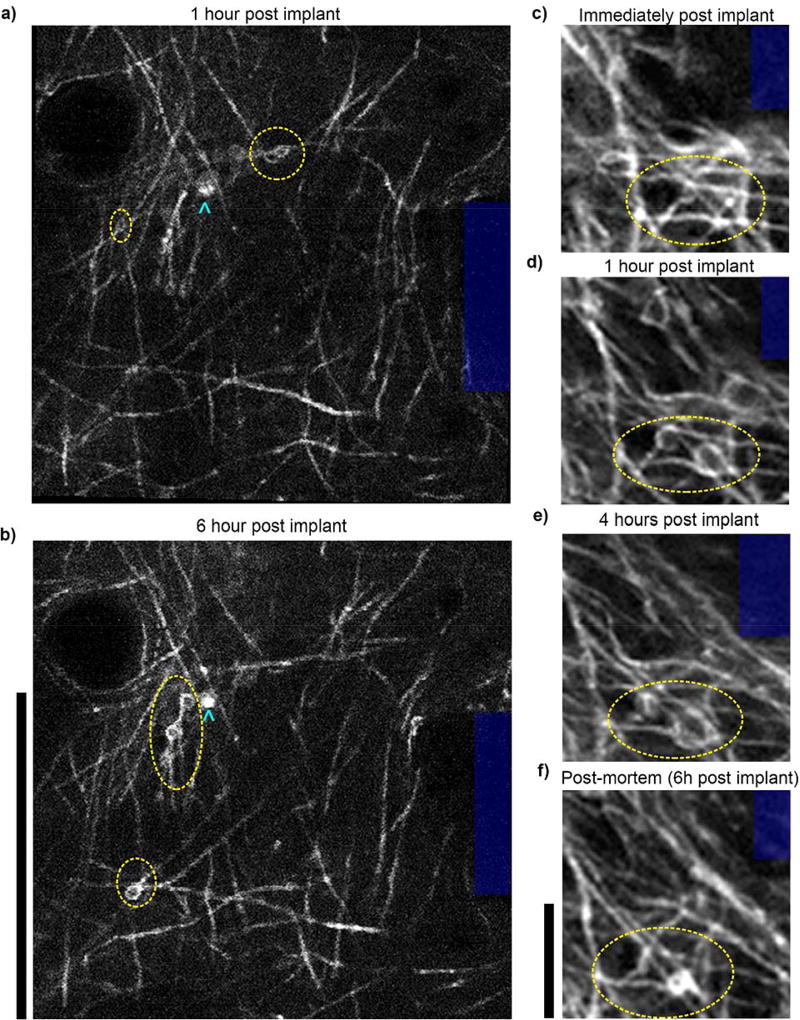
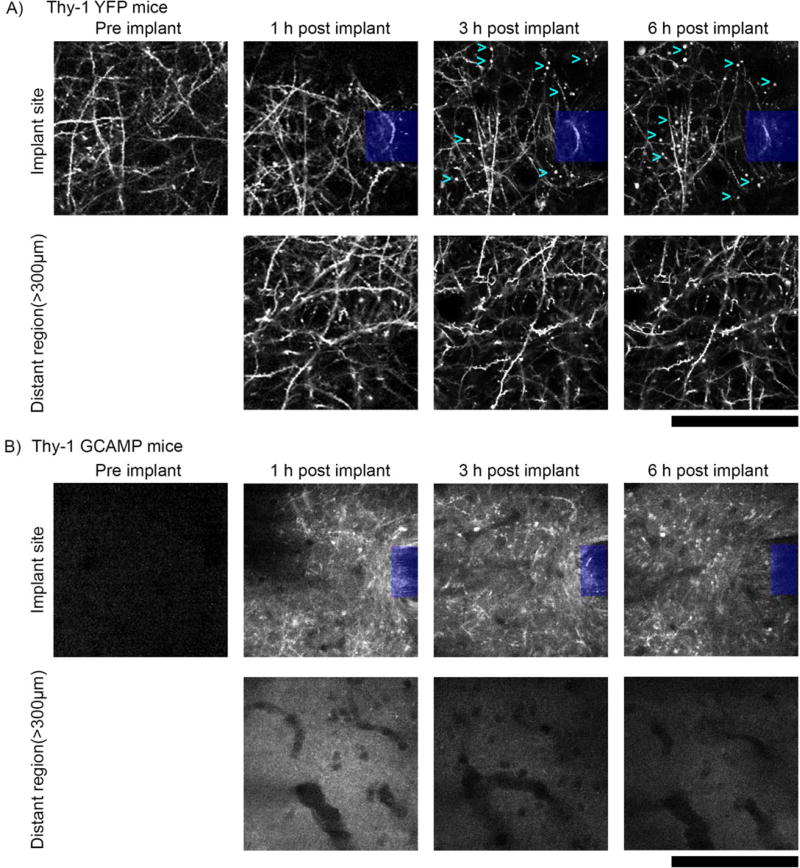
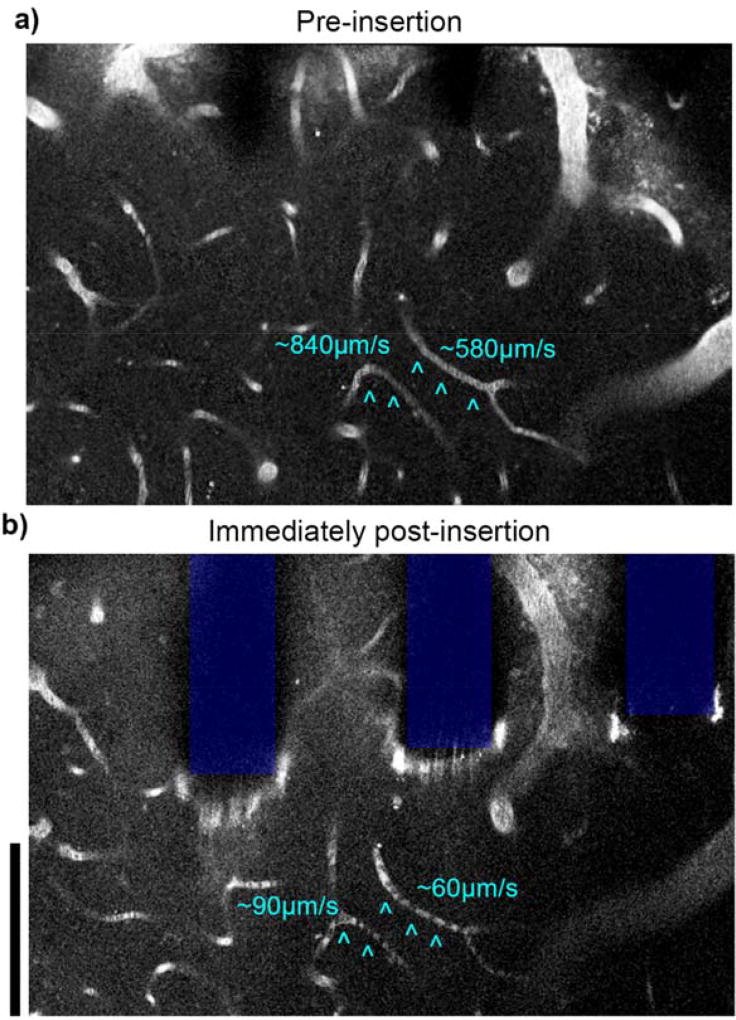
Significance: To better understand the biological factors influencing neural activity, detailed cellular and molecular tissue responses were examined. Decreases in neural activity and blood oxygenation in the tissue surrounding the implant, shift in expression levels of vesicular transporter proteins and ion channels, axon and myelin injury, and interrupted blood flow in nearby capillaries can impact neural activity around implanted neural interfaces. Combined, these tissue changes highlight the need for more comprehensive, basic science research to elucidate the relationship between biology and chronic electrophysiology performance in order to advance neural technologies.


Figures

Figure 1
Figure 1. Correlations of electrophysiological performance metrics can dramatically change over time
a) Site-by-site analysis of correlation coefficients over the entire experimental time courses, taken from visually evoked, isoflurane anesthetized, head-fixed mice implanted with 16 channel silicon arrays in V1 (n=9). * indicates p<0.00005. # indicates p<0.05. b) Colormap in days for (c) and (e). c) Impedance against noise. Each point is color coated with time point. Solid black line shows the best-fit line for all time points. Colored dotted line shows best-fit line for corresponding time point. d) Linear regression and correlation coefficients for (c) against time. Note the linear regression coefficient increases over time before stabilizing beginning on day 70. Similarly, the correlation coefficient fluctuates until day 70. e) Relationships between various performance metrics over time. Evoked measurements taken after driving activity with a drifting grating stimulus. Colored points and lines are same as (c). Note: Some relationships can completely invert over time. This can be seen by the slopes of correlations changing sign (eg. SU SNR vs Impedance) or the correlation coefficients changing sign (eg. Fig.1 f). f) Correlation coefficient for evoked firing rate SNFRR and impedance shows large fluctuations between positive and negative correlation over time. g) Changes in correlation coefficients over time. Note: Correlation between SNR and noise is significant, however, the correlation is generally positive during early time points, but negative at later time points. Examination of relationships between recording and electrical performance metrics show challenges of using surrogate metrics such as impedance to predict chronic recording performance.
Figure 2
Figure 2. Animal movement creates electrophysiological artifacts that contaminate data
a–c) Sample recordings from awake, freely moving NHP (96 channel, M1), rat (16 channel, M1), and mouse (16 channel, V1), over 50s, filtered with 2nd order, 0.3–1kHz passband Butterworth filter. Artifacts are observed as high amplitude activity that occurs across multiple channels simultaneously. d–f) Same as (a–c), except over 80ms. Gray shading highlights simultaneous spikes across channels. Action potentials and artifacts are denoted by blue and red circles, respectively. g–i) Representative waveforms detected from clustering. Thin blue and red lines are circled waveforms from (a–c). Thick lines are mean waveforms for the respective clusters. Note that in rats and mice, PCA and k-means clustering did not separate artifacts from action potentials, and therefore the mean waveform (shown in black) includes both action potentials and artifacts. Scalebars: a–f) 400µV, g–i) 100µV.
Figure 3
Figure 3. Healthy, quiescent neurons in isoflurane anesthetized mouse visual cortex are evoked with visual stimulus presentation
a) Example channel showing the firing rate of only the unsorted outlier after automated spike sorting (multiunit: black). b) Same as (a) except visually evoked with a drifting grating movie. Auto-spike sorting discriminated a high amplitude, low firing SU (green) which increased firing rate during a mild visual stimulus (1 set of 8 direction stimulus for 4 s each). Note: First 15 s are movie calibration. c) Raw spike channel (300–5000 Hz) show increased spiking during the ‘ON’ phase of strong visual stimulus (8 set of 8 direction stimulus for 1 s each). d) PSTH of (c) showing increased firing during the ‘ON’ phase of the strong visual stimulus. Colors represent sorted (green, blue) and unsorted (black) threshold crossings. e) Pile plots of green and blue SU waveforms from (b) and (d) sorted using PCA and K-means clustering. a–e) Electrophysiological recording on the same recording site from the same day, 2 months post-implant. Reprinted from, Copyright 2015, with permission from Elsevier. f) Average 20 s GCaMP6f activity in V1 and V2 layer II/III neurons during resting state (spontaneous) and visually driven via contralateral eye. g) Standard deviation of intensity changes of GCaMP6f activity during (f). Red * indicate quiescent neurons during resting state that were driven by visual stimulus.
Figure 4
Figure 4. Challenges correlating electrophysiology and histology
a–b) Average (a) and individual (b) depths of cortical layer IV, in mouse V1, where 0 represents the depth of layer IV on the day of insertion. Cortical layers drift along implants even when they are rigidly fixed to the skull. Therefore, it is not possible to correlate tissue sections to corresponding recording sites simply by tissue section depth. c) Linear silicon array next to coronal section of V1m (NeuN = green, Iba1 = red, Hoechst = blue, IgG = white). Histological cortical layers can be identified by the morphology and density of neurons. d) Current source density following presentation of visual stimulus (drifting grating) can be used to identify electrophysiological cortical layers. Current sinks are observed in L4, followed by L2/3, then L5, and then CA1. Representative CSD was recorded from isoflurane anesthetized mouse. (c) and (d) can be used to correlate histological outcomes to corresponding electrophysiological performance at the endpoint. Reprinted from, Copyright 2015, with permission from Elsevier.
Figure 5
Figure 5. Ideal histology from silicon microelectrodes does not guarantee good recording performance
a) Immunohistochemistry of tissue surrounding implant site in mouse V1, showing no BBB leakage, good neural density, minimal astrocyte activation, and no microglial encapsulation 133 days post implant. Recording site is on the left face of the shank. Reprinted from, Copyright 2014, with permission from Elsevier. b) Electrical performance outcomes of electrode site corresponding to (a) shows good SU SNR for the first week only, and loss of MUA activity after the first 40 days. Impedance and noise floor steadily increase for the first 40 days, then rapidly decline below pre-implant levels. SEM analysis indicates complete degradation of the silicon oxide insulation and cracking of the polycrystalline silicon traces near the iridium recording sites led to decreases in impedances and detected neural signals. Reprinted from, Copyright 2015, with permission from Elsevier.
Figure 6
Figure 6. Loss of recording performance in mouse V1 without material degradation or loss of neural density
a) SEM showing intact electrical traces. b) Immunohistochemistry on probe (a) showing no tissue adhesion. c) No SU were detected on (a) 6 weeks prior to animal sacrifice. d) Impedance of (a) remain in good range and does not dip below pre-implantation levels. e) Immunohistochemistry of tissue section corresponding to (a-d) (NeuN = green, Iba1 = red, Hoechst = white, IgG = blue). Recording site faces left on the shank. Some IgG is present around the implant, but there is limited microglial scarring and high density of neurons (50 neurons with 100 µm of the recording site and 150 neurons within 160 µm). (e) reprinted from, Copyright 2014, with permission from Elsevier. Scalebar = 100 µm
Figure 7
Figure 7. Decreased neural activity evoked by visual stimulation around the implant of lightly anesthetized AAV-Syn-GCaMP6f mice
a) Representative difference image sequence showing GCaMP increases in visual cortex during visual stimulation, prior to 4 shank silicon electrode implantation. The image sequence was generated by subtracting a pre-stimulation baseline image (e.g. left-most image in the row) from subsequent images (t>0s). The blinking LED visual stimulus was presented while the images outlined in the blue rectangle were acquired. b) Images of GCaMP expression on the day of implantation and the following two weeks, showing no noticeable changes in GCaMP expression around the implanted electrode. c) Visual activity maps obtained as shown in (a). Bright areas show increases in GCaMP signal evoked by visual stimulation around the implanted area on the day of implantation. The increases in activity diminish over the bottom two shanks on Day 7, and the cortex around the implanted area appears unresponsive 14 days post-implantation. No obvious superficial injury or bleeding was observed post-implantation. d) Average ROI GCaMP timeseries at each time point, showing a marked decrease in visually evoked activity, as measured by GCaMP fluorescence, at day 14. Visual stimulation from 0 to 2 seconds. ROI denoted by teal rectangle in (c)
Figure 8
Figure 8. Longitudinal GCaMP expression and neuro-physiological variance in AAV-Syn-GCaMP6f mice post-insertion
GCaMP and intrinsic optical imaging sensitive to changes in blood oxygenation levels (OIS-BOLD) were recorded post-implantation. a) Representative images of GCaMP fluorescence over time from one of the mice tested. No large changes in overall fluorescence or superficial injury is observed. The temporal coefficient of variance (COV) was computed as an indication of tissue activity level from GCaMP (b) and OIS-BOLD (c) signals. d,e) Average ROI GCaMP ΔF/F and OIS-BOLD ΔS/S at each time point. Decreases in the GCaMP and OIS-BOLD COV were observed at the implanted area. The change in GCaMP COV diminished relative to neighboring tissue 7 days post-implantation, while the changes in OIS-BOLD COV appeared indifferent from neighboring tissue 4 days post-implantation. The changes in OIS-BOLD suggest there was a transient decrease in blood oxygen supply post-implantation.
Figure 9
Figure 9. Evidence for plasticity in markers of excitability surrounding devices
Immunohistochemistry at 3 days and 28 days post single shank silicon array implantation in rat primary motor cortex (n=11). a,b) At 3 days, VGLUT1 and VGAT are both significantly elevated (**p≤0.001) and VGLUT1 intensity is significantly greater than VGAT (**p≤0.001, within the first 40µm). By four weeks, VGAT intensity is significantly elevated (*p≤0.05) and is greater than VGLUT1 (*p≤0.05) in the first 40µm of the device. c,d) Early observations suggest that Nav1.6 expression is initially upregulated at the device interface, while Kv1.1 expression is increased surrounding the device by the four week time point (statistical analysis omitted due to limited sample size). e) NF is significantly elevated nearest the implant site based on quantitative immunohistochemistry (as previously reported), suggesting possible axonal sprouting. White asterisk (*) – a,b,e) Adapted with permission from. Copyright 2017, The American Physiological Society.
Figure 10
Figure 10. Dynamic neurite sprouting following microelectrode insertions in V1 in Thy1-YFP mice
In vivo multiphoton microscopy of YFP labeled neurites show growth cones near the microelectrode minutes after insertion. Overlay images show before (red) and after (green) for each pair of time points. Yellow indicates stationary features. Pink circles identify ‘elbows’ of neurites to show there is no bulk tissue movement around the implant. Pink arrowheads point to growth cones moving towards the implant. Depth of imaging is between 0–50 µm. Scalebar = 100 µm.
Figure 11
Figure 11. In vivo multiphoton imaging in V1 of CNP-eGFP mice reveals myelin injury post insertion
In the hours following implantation, oligodendrocyte membranous protrusions (yellow ellipses) form in the cortical layer I myelinated axons near the electrode shank (blue). Cyan chevrons point to cell bodies. Note that some membranous protrusions emerge as soon as one hour post insertion (a,c,d), while some emerge hours later (b). Additionally, some protrusions recede over time (b,f). These are possible indicators of myelin damage or remodeling. Scalebars a–b: 100 µm; c–f: 12 µm
Figure 12
Figure 12. Axonal protrusions/blebs form by 3h post-implant at the implantation site, but not apparent in distant regions (> 300µm from implant)
a) Top: 2-photon microscopy of the visual cortex of transgenic mice expressing YFP in neurons under the control of the Thy1 promoter (n=3) reveal axonal dysfunction in the vicinity of silicon implants (denoted by blue box) by 3h post–implant. Axonal protrusions (examples denoted by cyan >) display as bright spherical objects, typically 1–5µm in diameter. Bottom: Axons in distant regions (> 300µm from implant) have clear axonal cable morphology, with spines clearly visible perpendicular to neurites and no signs of protrusions. b) Top: Neuronal Ca++ activity reporter mice (Thy-1 GCAMP, n=5) show similar axonal distress to Thy-1 YFP reporter mice. Compared to the same region prior to implant, axons from 1–6h post implant are brightly labeled with GCAMP, indicating sustained Ca++ influx. Bottom: Comparatively, distant regions (> 300µm from implant) do not show any discernable GCAMP(+) axons. All images, depth of imaging: between 0–50 µm. All scale bars are 100 µm.
Figure 13
Figure 13. Loss of perfusion observed in capillaries near implant
2 photon microscopy before (a) and after (b) silicon array insertion in visual cortex of Thy1-GCaMP mice. Capillaries with interrupted flow post-implantation are indicated by cyan ^. Stagnant red blood cells are observed as dark spots within the capillary. Vasculature labeled with intraperitoneal injection of SR101, depth of imaging: between 0–40 µm. Scale bars = 100 µm.

References

    1. Schwartz AB. Cortical neural prosthetics. Annual Review of Neuroscience. 2004;27:487–507. - PubMed
    1. Barrese JC, et al. Failure mode analysis of silicon-based intracortical microelectrode arrays in non-human primates. J Neural Eng. 2013;10:066014. - PMC - PubMed
    1. James CB, Juan A, John PD. Scanning electron microscopy of chronically implanted intracortical microelectrode arrays in non-human primates. Journal of Neural Engineering. 2016;13:026003. - PMC - PubMed
    1. Takmakov P, et al. Rapid evaluation of the durability of cortical neural implants using accelerated aging with reactive oxygen species. Journal of neural engineering. 2015;12:026003. - PMC - PubMed
    1. Kozai TDY, Jaquins-Gerstl A, Vazquez AL, Michael AC, Cui XT. Brain Tissue Responses to Neural Implants Impact Signal Sensitivity and Intervention Strategies. ACS Chemical Neuroscience. 2015;6:48–67. - PMC - PubMed

Publication types