Review
. 2018 Jan 16;18(2):217-248.
doi: 10.1039/c7lc00914c.

Wearable sensors: modalities, challenges, and prospects

Affiliations
Review

Wearable sensors: modalities, challenges, and prospects

J Heikenfeld et al. Lab Chip. .

Abstract

Wearable sensors have recently seen a large increase in both research and commercialization. However, success in wearable sensors has been a mix of both progress and setbacks. Most of commercial progress has been in smart adaptation of existing mechanical, electrical and optical methods of measuring the body. This adaptation has involved innovations in how to miniaturize sensing technologies, how to make them conformal and flexible, and in the development of companion software that increases the value of the measured data. However, chemical sensing modalities have experienced greater challenges in commercial adoption, especially for non-invasive chemical sensors. There have also been significant challenges in making significant fundamental improvements to existing mechanical, electrical, and optical sensing modalities, especially in improving their specificity of detection. Many of these challenges can be understood by appreciating the body's surface (skin) as more of an information barrier than as an information source. With a deeper understanding of the fundamental challenges faced for wearable sensors and of the state-of-the-art for wearable sensor technology, the roadmap becomes clearer for creating the next generation of innovations and breakthroughs.


Conflict of interest statement

Competing Financial Interests

The co-author (Heikenfeld) discloses a potential conflict of interest as he is a co-founder of Eccrine Systems Inc. which is commercializing sweat bio-sensing technologies. John Rogers is involved with several companies that are developing wearable technologies. Joseph Wang has no competing financial interests to disclosed. No potential conflict of interests exist for Tingrui Pan or Michelle Khine.

Figures
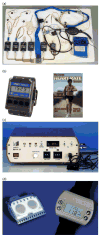
Figure 1
Figure 1
Historical examples of sensors including (a) wearable sensors for the Apollo Space Program, (b) Polar’s ‘Sport Tester PE2000’ heart rate monitor, (c) pulse oximetry worn on the fingertip, and (d) non-invasive chemical glucose sensing with the GlucoWatch product (discontinued). The devices shown in (a) and the pulse-ox meter in (c) were wearable, but they were not wireless like the devices shown in (b) and (d).
Figure 2
Figure 2
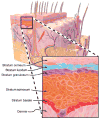
Diagrammatic cross-section of human skin, including a zoomed in view of the epidermis. Adapted from Blausen 2014.
Figure 3
Figure 3
Equivalent circuit models of electrode-skin interfaces for different electrode designs. (a) Gel electrodes, including wet and solid forms (Disposable Deep EEG Cup Electrode, Rhythmlink; ECG Electrode H1354LG, Kendall). (b) Dry contact electrodes. (c) Dry capacitive (non-contact) electrodes.
Figure 4
Figure 4
Schematic diagram of optical pathways in skin. Species largely responsible for absorption and scattering in the skin are:keratinized squamous cells (1) and large melanin aggregates (2). The vascularized dermis (3) includes absorbers such as oxygenated and deoxygenated hemoglobin, carotene and bilirubin. Scattering occurs on collagen fibrils and bundles.
Figure 5
Figure 5
Schematics illustrating the different modalities of mechanical sensors. a) Piezoresistivity b) Capacitance c) Piezoelectricity d) Iontronic.
Figure 6
Figure 6
a) Platinum thin film strain sensor using microcracking strategy. b) Scanning electron image (SEM) illustrating the microcrack junctions within the Platinum film. c) SEM image of the microcrack junctions at various strains. d) Electrical resistance change in response to strain.
Figure 7
Figure 7
a) SEM images of the processing of a Pt:Au thin film using a shrinking fabrication process: Deposition, shrinking, and then transferring to a silicone elastomer from left to right. Scale bar is 5 μm. b) Strain sensitivity curves of different thickness of Pt wrinkled thin films. c) Wrinkled Pt thin films were put in adhesive and mounted onto the body to detect respiration. d) Electrical resistance response to chest wall expansion during respiration is shown on the left. Right graph shows correlated lung volumes using spirometric and strain sensor data.
Figure 8
Figure 8
a) Schematic illustration of the elasticity of hollow sphere structured polypyrrole (PPy). b) Schematic illustration of the phase separation between water and organic components for the synthesis of PPy hydrogels. c) Electrical resistance response to induced pressure.
Figure 9
Figure 9
(a) photo of pressure and strain sensors based on transparent elastic films of carbon nanotubes. (b) Microstructured pressure sensor array. (c) Pulse pressure signal were obtained by attaching the pressure sensor to the wrist of a test person (d) The ionic gel based sensor array structure and when attached on the back of a hand. (e). Schematic and photo illustration of the energy harvesting e-skin.
Figure 10
Figure 10
(a) Iontronic droplet sensor operation principle. (b) Photo of an iontronic microdroplet sensing array. (c) Photo of a flexible ionic gel film on electrode substrate. (d) Real-time pulse pressure waveforms in the dry and underwater environments. (e) Photo of a commercial inelastic legging integrated with the iontronic flexible sensing array. (f) Prototypes of the microfluidic tactile sensors for three-dimensional force measurements.
Figure 11
Figure 11
(a) photograph of the piezoelectrical pressure sensor wrapped on a cylindrical glass support and laminated on a wrist. (b) Photographs of a piezoelectric device fully laminated on the skin and its SEM image on artificial skin sample for tissue viscoelasticity measurement.
Figure 12
Figure 12
Demonstration of dry epidermal electrodes. (a) An electronics platform with multifunctionality and matched physical properties to skin. (b) The device conformally attached to the skin through van der Waals forces with negligible mass or mechanical loading on the skin. (c) ECG signals measured with an active epidermal electronic device shown in (b), showing a clear physiological signal corresponding to a single heartbeat (right) and (d) EMG measurements showing the comparison with that collected using conventional gel electrodes. (e) EEG measurements using a passive electronic device, including discrete Fourier transform coefficient of EEG alpha rhythms at ~10 Hz (left), the spectrogram of the alpha rhythm corresponding to the eyes close and open, and demonstration of Stroop effects in EEG. (f) Epidermal electronics with fractal architectures, showing devices laminated on the auricle and mastoid and finite element method analysis on the device with simultaneous bending along two orthogonal axes. (g) Conformal contact of carbon nanotubes (CNT)/PDMS adhesives with the textured skin surface, confirmed by a SEM cross-sectional image (h). (i) Structure of an ECG electrode composed of a CNT/PDMS interfacial layer and serpentine interconnect metal wires. (j) Schematic and photograph of dry electrodes with PEDOT:PSS coatings.
Figure 13
Figure 13
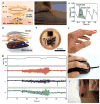
Exploded-view illustration of the construction of skin mounted PPG device (a), during operation in a mechanically deformed state (b). Pulse signal extracted with skin mounted device (c). Exploded-view schematic visualizing layer makeup of the miniaturized NFC enabled pulse oximeter device. (d). Microscopic picture of device without elastomeric encapsulation (e). Wireless fingernail mounted oximeter during operation (f). Extracted oxygenation information with simultaneous measurement of acceleration revealing high resistance against motion artefacts. (g) Device in operation on a NFC enabled computer input device (h). Device operation behind earlobe (i).
Figure 14
Figure 14
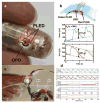
a) Organic pulse oximeter based reflectance scheme. (b) layout of the system with concentric LED’s and circular photodiode with resulting signal output. (c) Organic Transmission based oximeter, with subsequent resulting raw data and signal extraction (d).
Figure 15
Figure 15
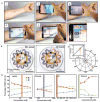
Soft colorimetric sensing patch NFC interface to a smartphone and image processing approaches. (A) Pictures demonstrating NFC between a sweat monitoring device and a smartphone to launch software for image capture and analysis. (B) Images of the epidermal microfluidic biosensor (left) before and (right) after injecting artificial sweat. (C) Location tracking of sweat accumulation with polar coordinates and their relationship to total captured volume of sweat (inset). (D) Standard calibration curves between normalized %RGB value and concentration of markers for quantitative analysis (n = 3, error bars represent the SD). Each vertical colored bar represents the marker concentration determined from the corresponding reservoirs in the right image of (B) as an example.
Figure 16
Figure 16
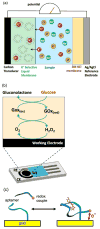
Examples of continuous electrochemical sensing modalities including (a) ion-selective/potentiometric, (b) enzymatic/amperometric where RE is reference electrode, CE is counter electrode, and WE is the working electrode, and (c) simple representation of aptamer-based sensing. Only (a) and (b) have been demonstrated in non-invasive wearable sensors while (c) has only been demonstrated in invasive sensing formats (in circulating blood). Generally the detection ranges are mM’s for (a), down to μM’s for (b) and down to nM’s for (c).
Figure 17
Figure 17
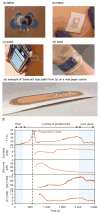
Bringing electrochemcial sensors directly onto skin to detect sweat (adapted). In all the examples provided in the figure, technology is mechanically compliant to skin, which is a first step to reduce the sweat volume between skin and sensors. The data shown in (f) is for a human-subject wearing the technology shown in (d).
Figure 18
Figure 18
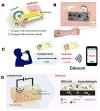
Tattoo-based transdermal alcohol sensor. (A) Schematic diagram of an iontophoretic-sensing tattoo device, containing the iontophoretic electrodes (IEs; anode and cathode) and the three sensing electrodes (working, reference, and counter electrodes: WE, RE, and CE, respectively). (B) Photograph of an alcohol iontophoretic-sensing tattoo device with integrated flexible electronics applied to a human subject. (C) Schematic diagram of a wireless operation of the iontophoretic-sensing tattoo device for transdermal alcohol sensing. In the diagrams of the tattoo-base device, blue and red highlights show the active zones during iontophoresis and amperometric detection, respectively. (D) Schematic diagram of constituents in the iontophoretic system (left) and of the reagent layer and processes involved in the amperometric sensing of ethanol on the working electrode (right).
Figure 19
Figure 19
The contact lens sensor that was under co-development by Google and Novartis (effort ceased) measures glucose concentration in tears using a miniaturized electrochemical glucose sensor and a wireless chip and antenna ring. Copyright 2014, Google X.
Figure 20
Figure 20
Pie chart of market size forecasts for 2020 by sensor type, courtesy James Haward of IDTechEx. The pie chart includes all wearable sensors that measure from the body and therefore excludes environmental sensors. Although not covered in this review, the chemical sensors are mainly continuous glucose monitors which are invasive as they place a sensor into the dermis using a small needle.

References

    1. Clarke SF, Foster JR. Br J Biomed Sci. 2012;69:83–93. - PubMed
    1. Miller J. Inventing the Apollo Spaceflight Biomedical Sensors. https://airandspace.si.edu/stories/editorial/inventing-apollo-spacefligh....
    1. Cunningham DD. In Vivo Glucose Sensing. John Wiley & Sons, Inc.; Hoboken, NJ, USA: 2010. pp. 191–215.
    1. Proksch E, Brandner JM, Jensen J-M. Exp Dermatol. 2008;17:1063–1072. - PubMed
    1. Deli MA. Biochim Biophys Acta - Biomembr. 2009;1788:892–910. - PubMed

Publication types