. 2017 Nov 28;18(12):2549.
doi: 10.3390/ijms18122549.

Graphene Oxide-Silver Nanoparticles Nanocomposite Stimulates Differentiation in Human Neuroblastoma Cancer Cells (SH-SY5Y)

Affiliations

Graphene Oxide-Silver Nanoparticles Nanocomposite Stimulates Differentiation in Human Neuroblastoma Cancer Cells (SH-SY5Y)

Sangiliyandi Gurunathan et al. Int J Mol Sci. .

Abstract

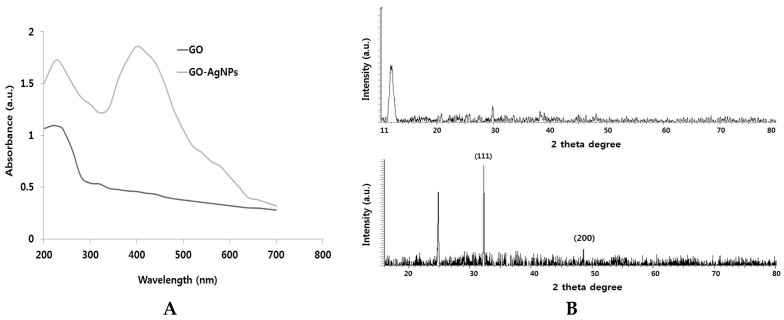
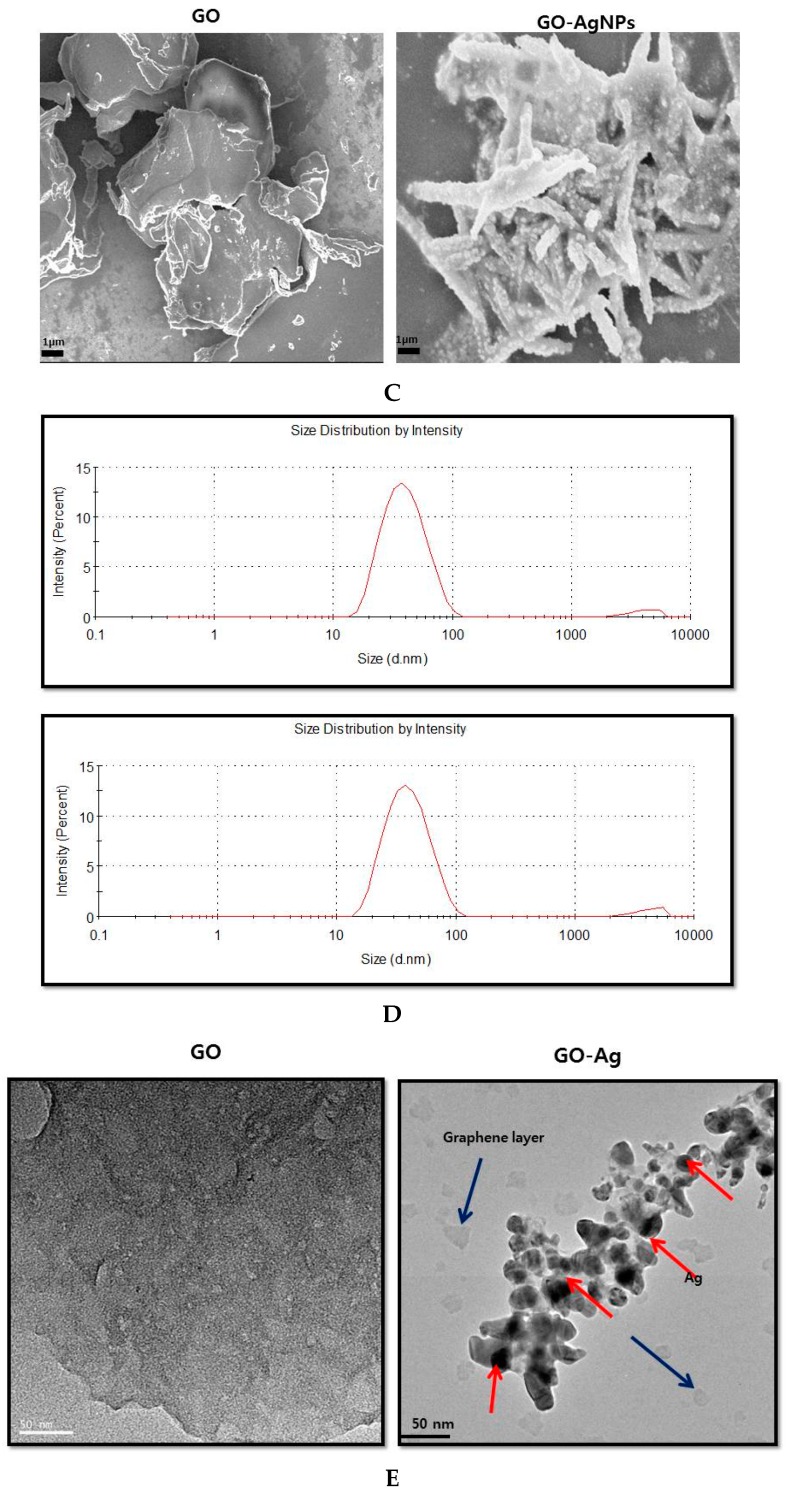
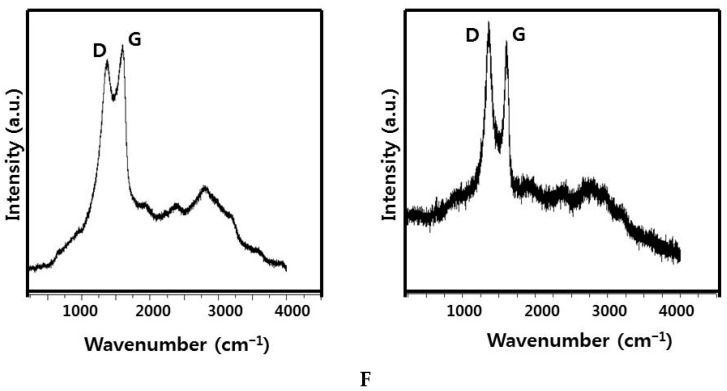
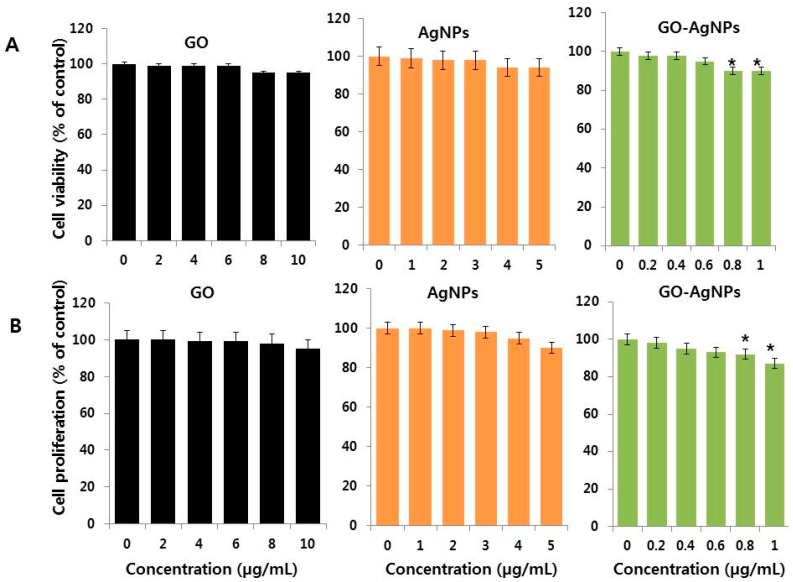
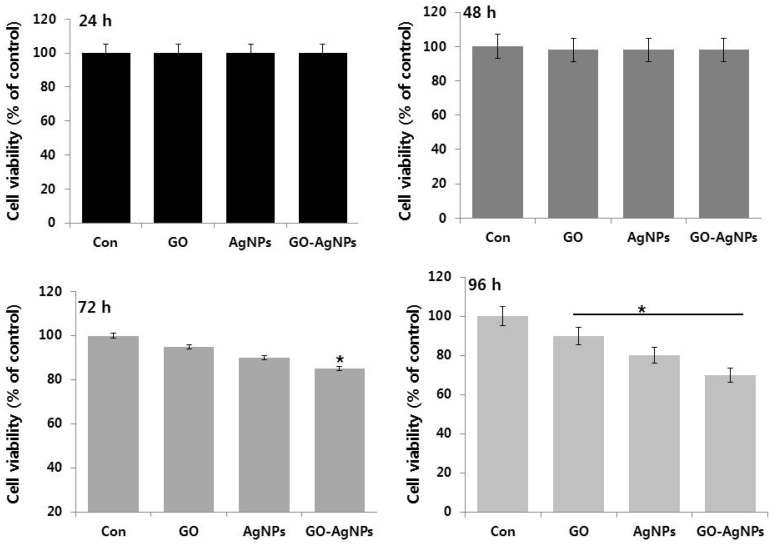
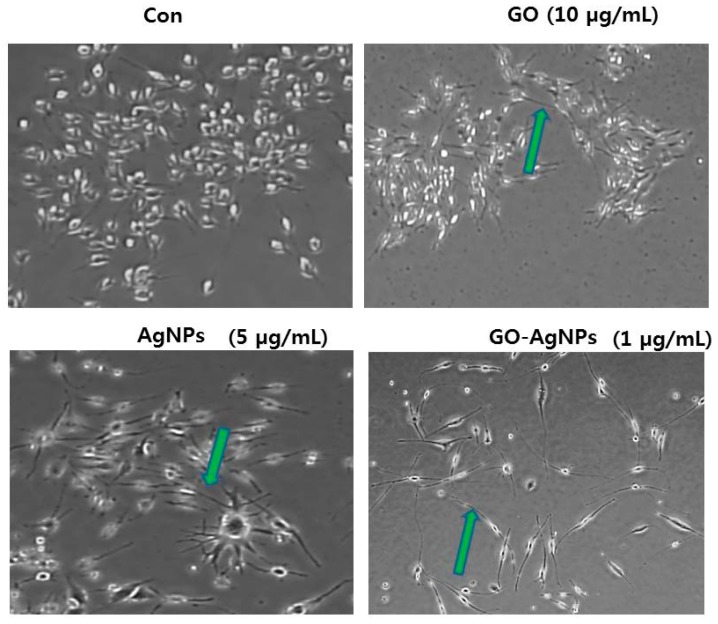
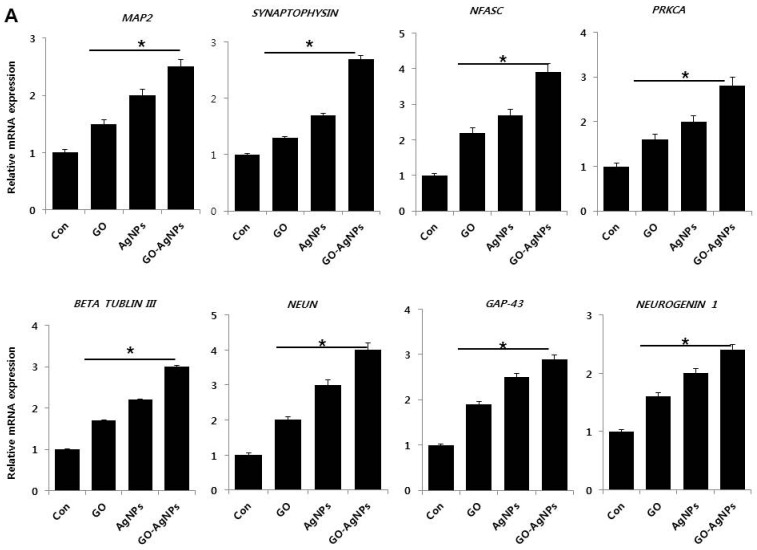
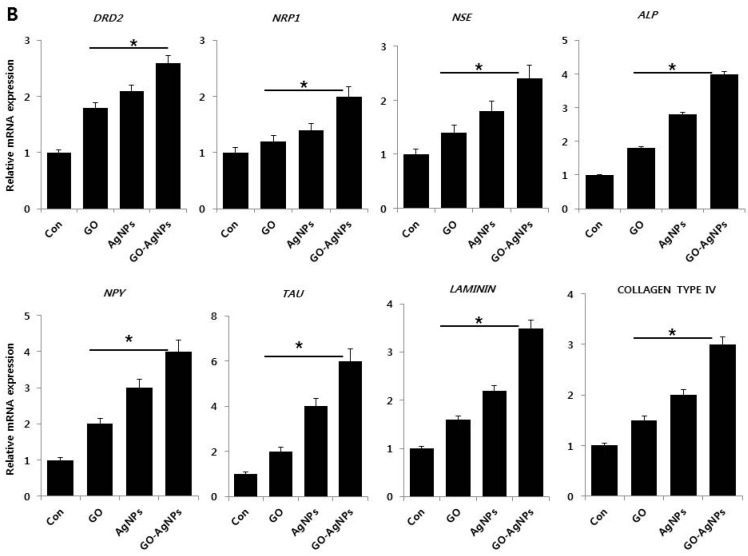
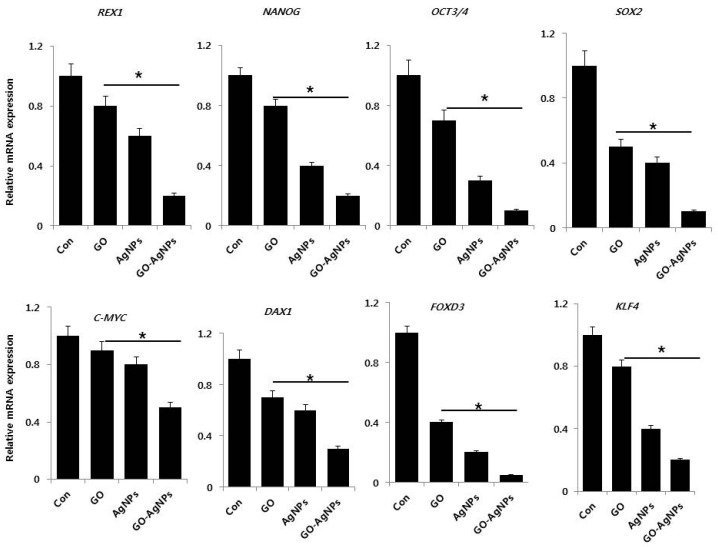
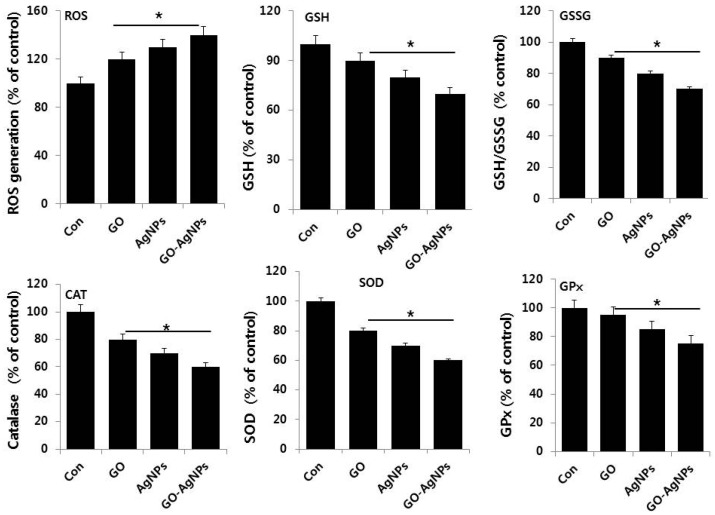
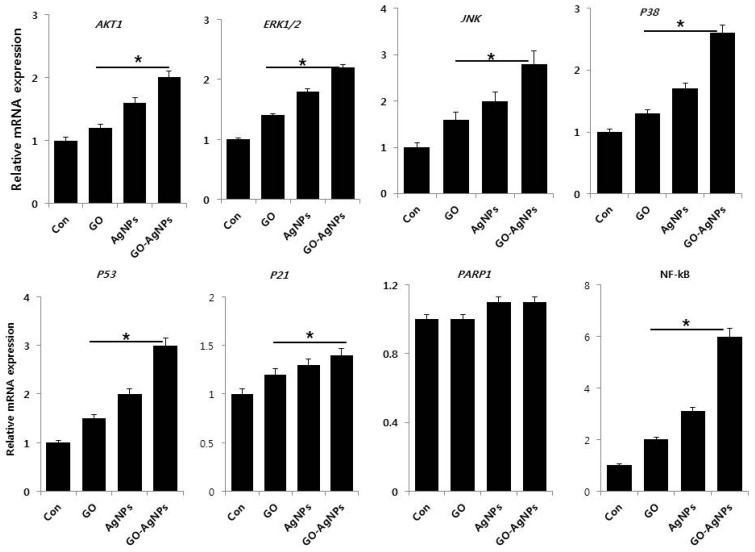
Recently, graphene and graphene related nanocomposite receive much attention due to high surface-to-volume ratio, and unique physiochemical and biological properties. The combination of metallic nanoparticles with graphene-based materials offers a promising method to fabricate novel graphene-silver hybrid nanomaterials with unique functions in biomedical nanotechnology, and nanomedicine. Therefore, this study was designed to prepare graphene oxide (GO) silver nanoparticles (AgNPs) nanocomposite (GO-AgNPs) containing two different nanomaterials in single platform with distinctive properties using luciferin as reducing agents. In addition, we investigated the effect of GO-AgNPs on differentiation in SH-SY5Y cells. The synthesized GO-AgNPs were characterized by ultraviolet-visible absorption spectroscopy (UV-vis), X-ray diffraction (XRD), scanning electron microscopy (SEM), transmission electron microscopy (TEM) and Raman spectroscopy. The differentiation was confirmed by series of cellular and biochemical assays. The AgNPs were distributed uniformly on the surface of graphene oxide with an average size of 25 nm. As prepared GO-AgNPOs induces differentiation by increasing the expression of neuronal differentiation markers and decreasing the expression of stem cell markers. The results indicated that the redox biology involved the expression of various signaling molecules, which play an important role in differentiation. This study suggests that GO-AgNP nanocomposite could stimulate differentiation of SH-SY5Y cells. Furthermore, understanding the mechanisms of differentiation of neuroblastoma cells could provide new strategies for cancer and stem cell therapies. Therefore, these studies suggest that GO-AgNPs could target specific chemotherapy-resistant cells within a tumor.

Keywords: apoptosis; differentiation; luciferin; neuroblastoma; neuronal markers; stem cell markers.


Conflict of interest statement

The authors declare no conflict of interest.

Figures

Figure 1
Figure 1
Synthesis and characterization of graphene oxide and graphene oxide–silver nanoparticle nanocomposite using lycopene. (A) Ultraviolet-visible spectroscopy of graphene oxide (GO) exhibit a maximum absorption peak at ~230 nm corresponding to the π–π transitions of aromatic C-C bonds. The absorption peak for GO-AgNPs exhibit peak at 230 nm and new peak at 410 nm is observed after deposition of AgNPs on the GO surface; the band at 410 nm in the absorption spectrum of the GO-AgNPs nanocomposite is attributed to surface plasmons and the presence of AgNPs; (B) X-ray diffraction (XRD) images of GO and GO-AgNPs; (C) scanning electron microscopy (SEM) images of GO and GO-AgNPs (D) Dynamic light-scattering (DLS) spectra of GO and GO-AgNPs dispersions. At least 200 particles were measured for each sample to obtain the size distribution; (E) transmission electron microscopy (TEM) images of GO and GO-AgNPs; (F) Raman spectroscopy images of GO and GO-AgNPs. At least three independent experiments were performed for each sample and reproducible results were obtained. The data present the results of a representative experiment.
Figure 1
Figure 1
Synthesis and characterization of graphene oxide and graphene oxide–silver nanoparticle nanocomposite using lycopene. (A) Ultraviolet-visible spectroscopy of graphene oxide (GO) exhibit a maximum absorption peak at ~230 nm corresponding to the π–π transitions of aromatic C-C bonds. The absorption peak for GO-AgNPs exhibit peak at 230 nm and new peak at 410 nm is observed after deposition of AgNPs on the GO surface; the band at 410 nm in the absorption spectrum of the GO-AgNPs nanocomposite is attributed to surface plasmons and the presence of AgNPs; (B) X-ray diffraction (XRD) images of GO and GO-AgNPs; (C) scanning electron microscopy (SEM) images of GO and GO-AgNPs (D) Dynamic light-scattering (DLS) spectra of GO and GO-AgNPs dispersions. At least 200 particles were measured for each sample to obtain the size distribution; (E) transmission electron microscopy (TEM) images of GO and GO-AgNPs; (F) Raman spectroscopy images of GO and GO-AgNPs. At least three independent experiments were performed for each sample and reproducible results were obtained. The data present the results of a representative experiment.
Figure 2
Figure 2
Effect of low concentration of GO-AgNPs on cell viability and proliferation of SH-SY5Y cells. (A) The viability of SH-SY5Y cells was determined after 24-h exposure to different concentrations of GO (2–10 µg/mL), AgNPs (1–5 µg/mL) and GO-AgNPs (0.2–1.0 µg/mL) using the CCK-8 assay; (B) Cell proliferation of SH-SY5Y cells was determined after 24-h exposure to different concentrations of GO (2–10 µg/mL), AgNPs (1–5 µg/mL) and GO-AgNPs (0.1–1.0 µg/mL) using trypan blue exclusion and BrdU assay. At least three independent experiments were performed for each sample. The results are expressed as the mean ± standard deviation of three independent experiments. The treated groups showed statistically significant differences from the control group by the Student’s t-test (* p < 0.05).
Figure 3
Figure 3
Time dependent effect on SH-SY5Y cells. The viability of SH-SY5Y cells was determined after 24-h exposure to GO (10 µg/mL), AgNPs (5 µg/mL) and GO-AgNPs (1.0 µg/mL) using the CCK-8 assay. At least three independent experiments were performed for each sample. The results are expressed as the mean ± standard deviation of three independent experiments The treated groups showed statistically significant differences from the control group by the Student’s t-test (* p < 0.05).
Figure 4
Figure 4
The effect of GO-AgNPs treatment on differentiation of SH-SY5Y cells. The GO-AgNPs induced differentiation of SH-SY5Y cells was determined after 24-h exposure to GO (10 µg/mL), AgNPs (5 µg/mL) and GO-AgNPs (1.0 µg/mL). Phase contrast microscopy images showing the morphological changes in SH-SY5Y cells after treatment with GO-AgNPs in 1% serum-supplemented medium. The green arrows indicate significant, lengthy neurite outgrowth. At least three independent experiments were performed for each sample. Scale bar is 100 μm.
Figure 5
Figure 5
(A) Reverse transcription-quantitative polymerase chain reaction (RT-qPCR) analysis of expression of various neuronal markers. Microtubule-associated protein 2 (MAP2), synaptophysin, neurofascin (NFASC), protein kinase C, alpha (PRKCA), β tublin III, fox-1 homolog 3 (NEUN), growth associated protein 43 (GAP-43) and neurogenin 1, were analyzed after exposure of SH-SY5Y cells to GO (10 µg/mL), AgNPs (5 µg/mL) and GO-AgNPs (1.0 µg/mL) for 24 h. After 24 h treatment expression fold level was determined as fold changes in reference to expression values against GAPDH; (B) Reverse transcription-quantitative polymerase chain reaction (RT-qPCR) analysis of expression of various neuronal markers. The expression pattern of various neuronal markers genes such as dopamine receptors type 2 (DRD2), neuropilin 1 (NRP1), gamma neuronal (NSE), alkaline phosphatase (ALP), neuropeptide Y, (NPY), microtubule-associated protein tau (TAU), laminin, and collagen type IV were analyzed after exposure of SH-SY5Y cells to GO (10 µg/mL), AgNPs (5 µg/mL) and GO-AgNPs (1.0 µg/mL) for 24 h. After 24 h treatment expression fold level was determined as fold changes in reference to expression values against GAPDH. Results are expressed as fold changes. At least three independent experiments were performed for each sample. The results are expressed as the mean ± standard deviation of three independent experiments The treated groups showed statistically significant differences from the control group by the Student’s t-test (* p < 0.05).
Figure 5
Figure 5
(A) Reverse transcription-quantitative polymerase chain reaction (RT-qPCR) analysis of expression of various neuronal markers. Microtubule-associated protein 2 (MAP2), synaptophysin, neurofascin (NFASC), protein kinase C, alpha (PRKCA), β tublin III, fox-1 homolog 3 (NEUN), growth associated protein 43 (GAP-43) and neurogenin 1, were analyzed after exposure of SH-SY5Y cells to GO (10 µg/mL), AgNPs (5 µg/mL) and GO-AgNPs (1.0 µg/mL) for 24 h. After 24 h treatment expression fold level was determined as fold changes in reference to expression values against GAPDH; (B) Reverse transcription-quantitative polymerase chain reaction (RT-qPCR) analysis of expression of various neuronal markers. The expression pattern of various neuronal markers genes such as dopamine receptors type 2 (DRD2), neuropilin 1 (NRP1), gamma neuronal (NSE), alkaline phosphatase (ALP), neuropeptide Y, (NPY), microtubule-associated protein tau (TAU), laminin, and collagen type IV were analyzed after exposure of SH-SY5Y cells to GO (10 µg/mL), AgNPs (5 µg/mL) and GO-AgNPs (1.0 µg/mL) for 24 h. After 24 h treatment expression fold level was determined as fold changes in reference to expression values against GAPDH. Results are expressed as fold changes. At least three independent experiments were performed for each sample. The results are expressed as the mean ± standard deviation of three independent experiments The treated groups showed statistically significant differences from the control group by the Student’s t-test (* p < 0.05).
Figure 6
Figure 6
Reverse transcription-quantitative polymerase chain reaction (RT-qPCR) analysis of expression of various stem cell markers. The expression pattern of various stem cell markers genes were analyzed by exposure of SH-SY5Y cells to GO (10 µg/mL), AgNPs (5 µg/mL) and GO-AgNPs (1.0 µg/mL) for 24 h. After 24 h treatment, expression fold level was determined as fold changes in reference to expression values against GAPDH. Results are expressed as fold changes. At least three independent experiments were performed for each sample. The results are expressed as the mean ± standard deviation of three independent experiments The treated groups showed statistically significant differences from the control group by the Student’s t-test (* p < 0.05).
Figure 7
Figure 7
Effect of GO, AgNPs and GO-AgNPs on oxidative and anti-oxidative markers. The expression patterns of various oxidative and anti-oxidative markers were analyzed by exposure of SH-SY5Y cells to GO (10 µg/mL), AgNPs (5 µg/mL) and GO-AgNPs (1.0 µg/mL) for 24 h. After incubation, the cells were harvested, washed twice with ice-cold PBS, and then disrupted by ultrasonication for 5 min on ice. ROS generation was measured as described previously. The concentration of GSH and GSH/GSSG was expressed as milligram per gram of protein. The specific activity of catalase (CAT) was expressed as unit per milligram of protein. The specific activity of superoxide dismutase (SOD) was expressed as unit per milligram of protein. The specific activity of glutathione peroxidase (GPx) was expressed as unit per milligram of protein. The results are expressed as the mean ± standard deviation of three independent experiments The treated cells showed statistically significant differences from the untreated cells, as determined by the Student’s t-test (* p < 0.05).
Figure 8
Figure 8
Reverse transcription-quantitative polymerase chain reaction (RT-qPCR) analysis of expression of various genes involved in signaling pathways. The expression pattern of various genes involved in signaling pathways were analyzed by exposure of SH-SY5Y cells to GO (10 µg/mL), AgNPs (5 µg/mL) and GO-AgNPs (1.0 µg/mL) for 24 h. After 24 h treatment, expression fold level was determined as fold changes in reference to expression values against GAPDH. Results are expressed as fold changes. At least three independent experiments were performed for each sample. The results are expressed as the mean ± standard deviation of three independent experiments The treated groups showed statistically significant differences from the control group by the Student’s t-test (* p < 0.05).

Similar articles

Cited by

References

    1. Maris J.M., Hogarty M.D., Bagatell R., Cohn S.L. Neuroblastoma. Lancet. 2007;369:2106–2120. doi: 10.1016/S0140-6736(07)60983-0. - DOI - PubMed
    1. Matthay K.K., Maris J.M., Schleiermacher G., Nakagawara A., Mackall C., Diller L., Weiss W.A. Neuroblastoma. Nat. Rev. 2016 doi: 10.1038/nrdp.2016.78. - DOI - PubMed
    1. Esposito M.R., Aveic S., Seydel A., Tonini G.P. Neuroblastoma treatment in the post-genomic era. J. Biomed. Sci. 2017;24:14. doi: 10.1186/s12929-017-0319-y. - DOI - PMC - PubMed
    1. Maris J.M. Recent advances in neuroblastoma. N. Engl. J. Med. 2010;362:2202–2211. doi: 10.1056/NEJMra0804577. - DOI - PMC - PubMed
    1. Yu A.L., Gilman A.L., Ozkaynak M.F., London W.B., Kreissman S.G., Chen H.X., Smith M., Anderson B., Villablanca J.G., Matthay K.K., et al. Anti-GD2 antibody with GM-CSF, interleukin-2, and isotretinoin for neuroblastoma. N. Engl. J. Med. 2010;363:1324–1334. doi: 10.1056/NEJMoa0911123. - DOI - PMC - PubMed

LinkOut - more resources