. 2017 Nov 28:4:170173.
doi: 10.1038/sdata.2017.173.

Monitoring transcription initiation activities in rat and dog

Affiliations

Monitoring transcription initiation activities in rat and dog

Marina Lizio et al. Sci Data. .

Abstract

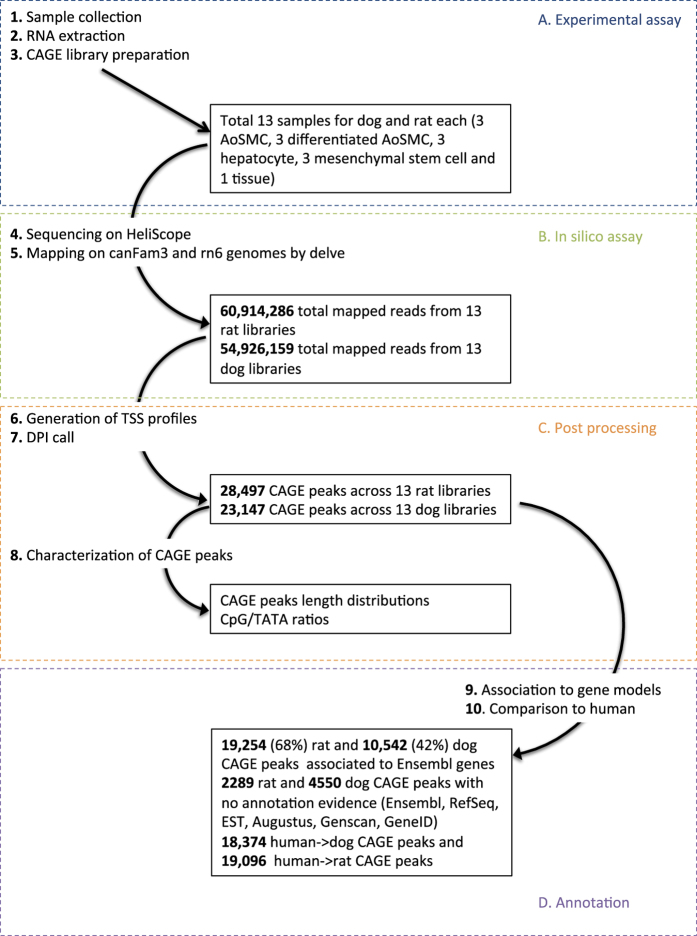
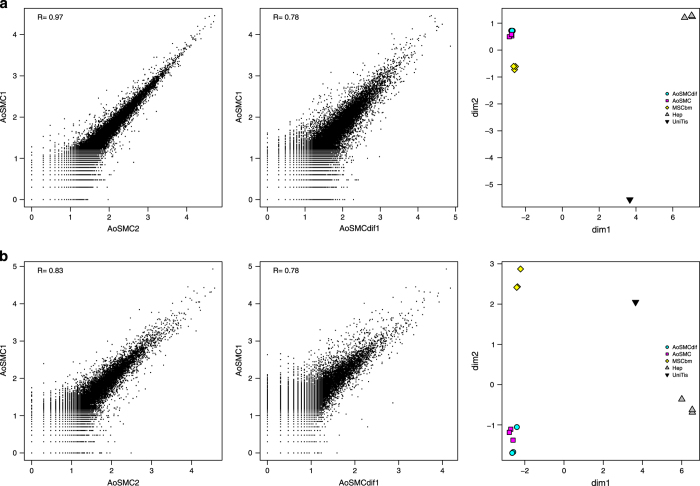
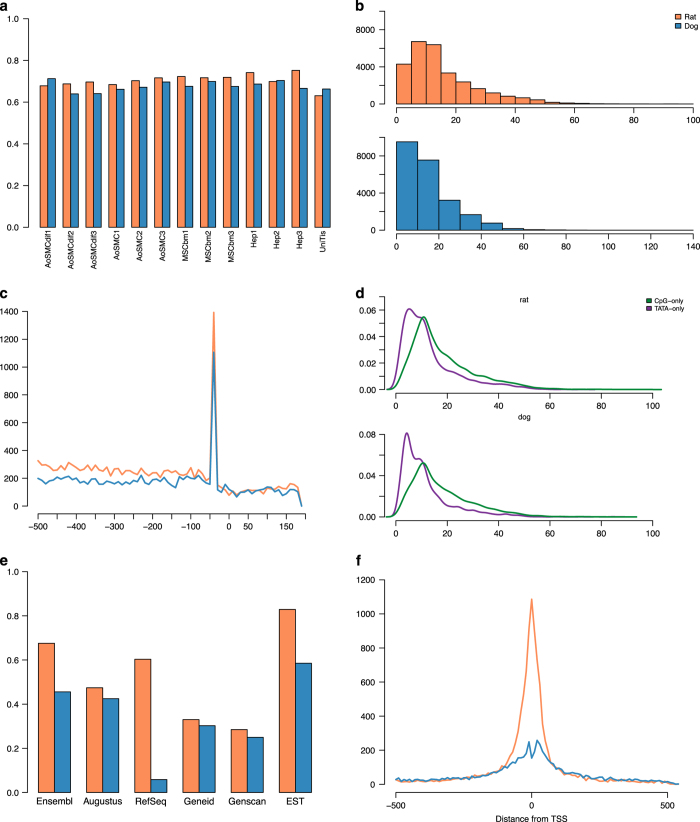
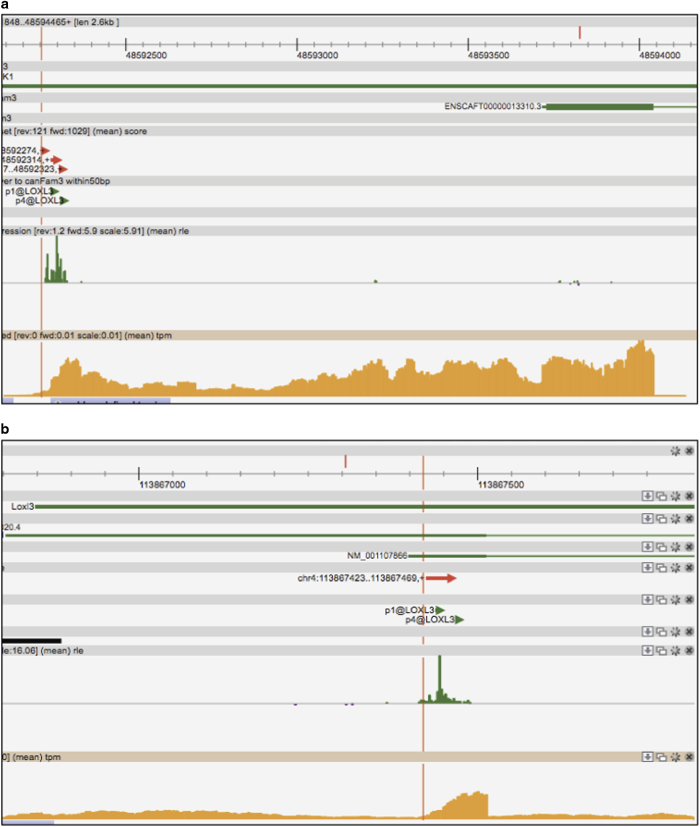
The promoter landscape of several non-human model organisms is far from complete. As a part of FANTOM5 data collection, we generated 13 profiles of transcription initiation activities in dog and rat aortic smooth muscle cells, mesenchymal stem cells and hepatocytes by employing CAGE (Cap Analysis of Gene Expression) technology combined with single molecule sequencing. Our analyses show that the CAGE profiles recapitulate known transcription start sites (TSSs) consistently, in addition to uncover novel TSSs. Our dataset can be thus used with high confidence to support gene annotation in dog and rat species. We identified 28,497 and 23,147 CAGE peaks, or promoter regions, for rat and dog respectively, and associated them to known genes. This approach could be seen as a standard method for improvement of existing gene models, as well as discovery of novel genes. Given that the FANTOM5 data collection includes dog and rat matched cell types in human and mouse as well, this data would also be useful for cross-species studies.


Conflict of interest statement

The authors declare no competing financial interests.

Figures

Figure 1
Figure 1. Study overview.
The steps of sample collection, CAGE data production, post-processing and further analyses are shown as arrows with their results indicated by squares.
Figure 2
Figure 2. Reproducibility of replicates.
Scatter plots and correlation values of normalized expression values between AoSMC samples (replicate 1 versus replicate 2 on the left and replicate 1 differentiated versus non differentiated in the center), and MDS plots highlighting the separation across cell types are shown for rat (a) and dog (b).
Figure 3
Figure 3. Characterization of CAGE peaks in dog and rat.
(a) Percentage of mapped reads at promoters identified by DPI for each sample. Labels description: AoSMC=aortic smooth muscle cell; AoSMCdiff=differentiated aortic smooth muscle cell; MESbm=mesenchymal stem cell from bone marrow; Hep=hepatocyte; UniTis=Universal tissue; (b) histograms of CAGE peaks lengths; (c) enrichment of TATA motifs near CAGE peaks; (d) graphs showing TATA-rich versus CpG-rich peaks. TATA-only bound CAGE peaks tend to be sharp whereas CpG-only peaks are generally broader; (e) percentage of genes that can be associated to a CAGE peak for each of the inspected known models; (f) distribution of the distances of CAGE peaks from their closest gene TSS. Colours: orange denotes rat and blue dog, except for (d), where colour-code is specified in the legend.
Figure 4
Figure 4. Zenbu examples of Rescue CAGE Peaks.
Screen shots of (a) LOXL3 gene in dog with RCPs supported by RNA-seq and human lift-over promoters, and (b) Loxl3 gene in rat annotated with CAGE peaks, also supported by RNA-seq and human promoters.

References

Data Citations

    1. 2016. DNA Data Bank of Japan. DRA004814
    1. 2016. DNA Data Bank of Japan. DRA004813
    1. 2015. NCBI Sequence Read Archive. SRP055477
    1. 2014. NCBI Sequence Read Archive. SRP051588
    1. 2013. NCBI Sequence Read Archive. SRP016141

References

    1. Tomato Genome, C. The tomato genome sequence provides insights into fleshy fruit evolution. Nature 485, 635–641 (2012). - PMC - PubMed
    1. Zeng X. et al. The draft genome of Tibetan hulless barley reveals adaptive patterns to the high stressful Tibetan Plateau. Proc Natl Acad Sci USA 112, 1095–1100 (2015). - PMC - PubMed
    1. Conesa A. et al. A survey of best practices for RNA-seq data analysis. Genome Biol 17, 13 (2016). - PMC - PubMed
    1. Engstrom P. G. et al. Systematic evaluation of spliced alignment programs for RNA-seq data. Nat Methods 10, 1185–1191 (2013). - PMC - PubMed
    1. Fang Z. & Cui X. Design and validation issues in RNA-seq experiments. Brief Bioinform 12, 280–287 (2011). - PubMed

Publication types