. 2017 Nov 28;12(11):e0188559.
doi: 10.1371/journal.pone.0188559. eCollection 2017.

The neural response properties and cortical organization of a rapidly adapting muscle sensory group response that overlaps with the frequencies that elicit the kinesthetic illusion

Affiliations

The neural response properties and cortical organization of a rapidly adapting muscle sensory group response that overlaps with the frequencies that elicit the kinesthetic illusion

Paul D Marasco et al. PLoS One. .

Abstract

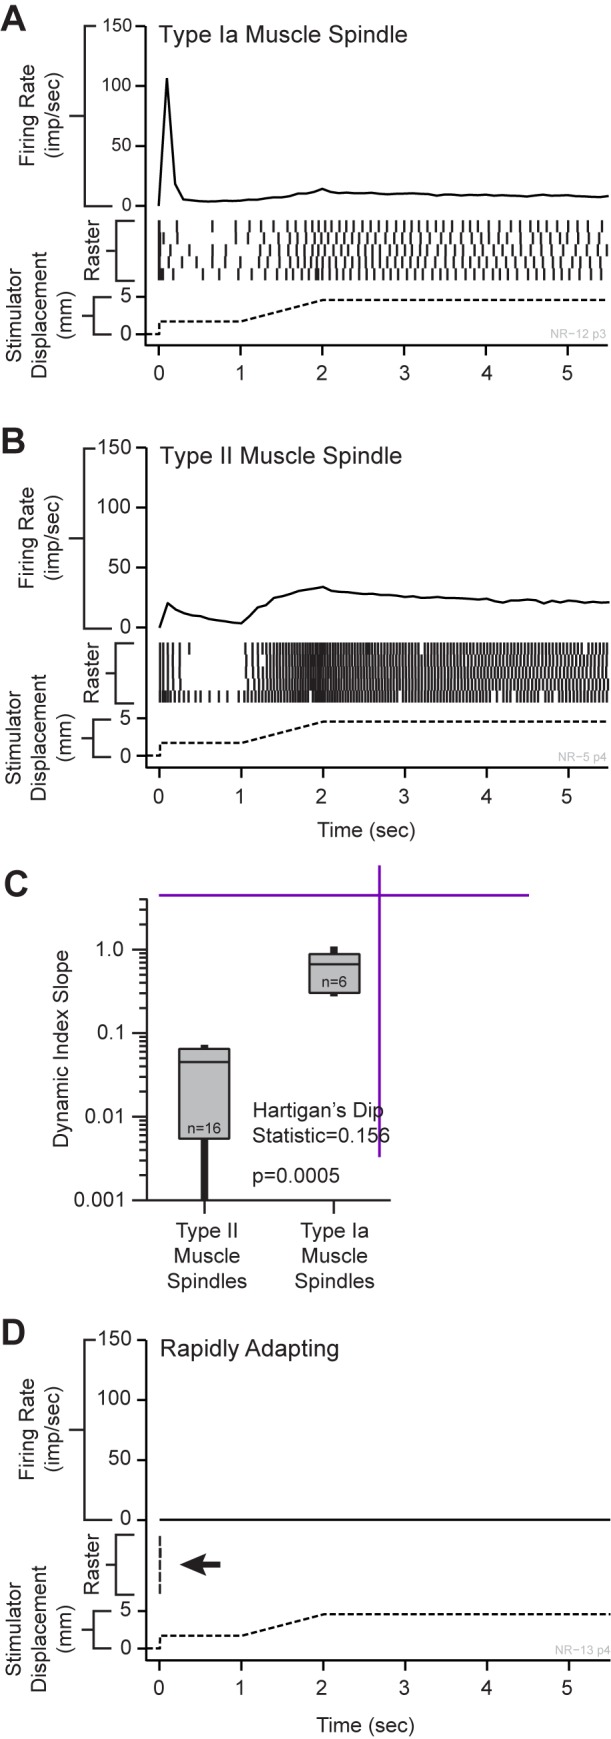
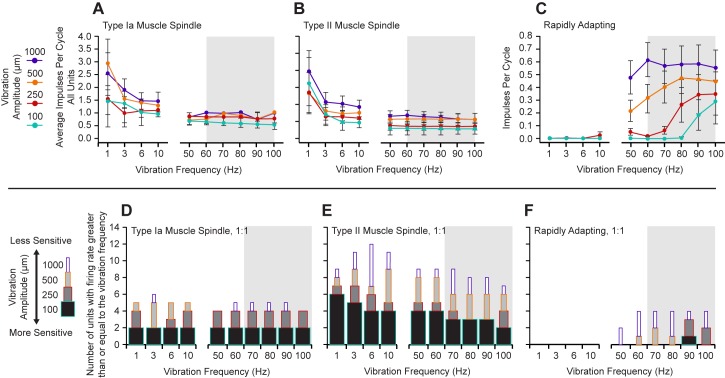
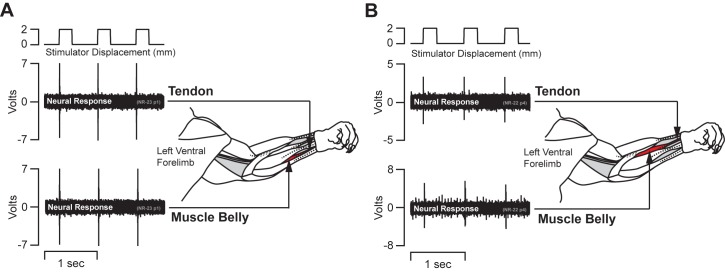
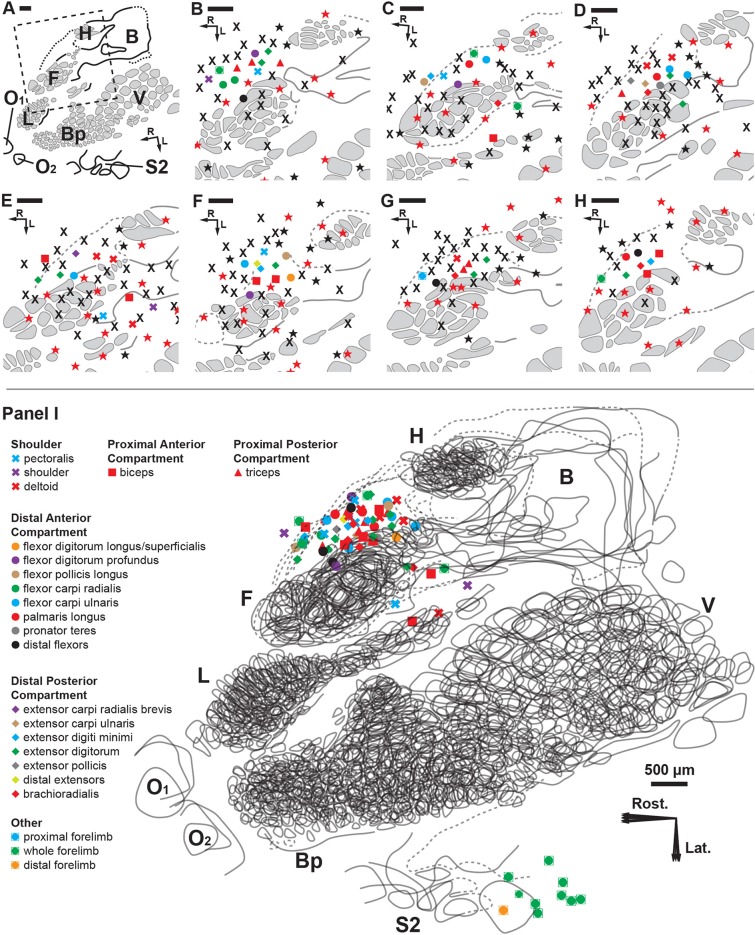
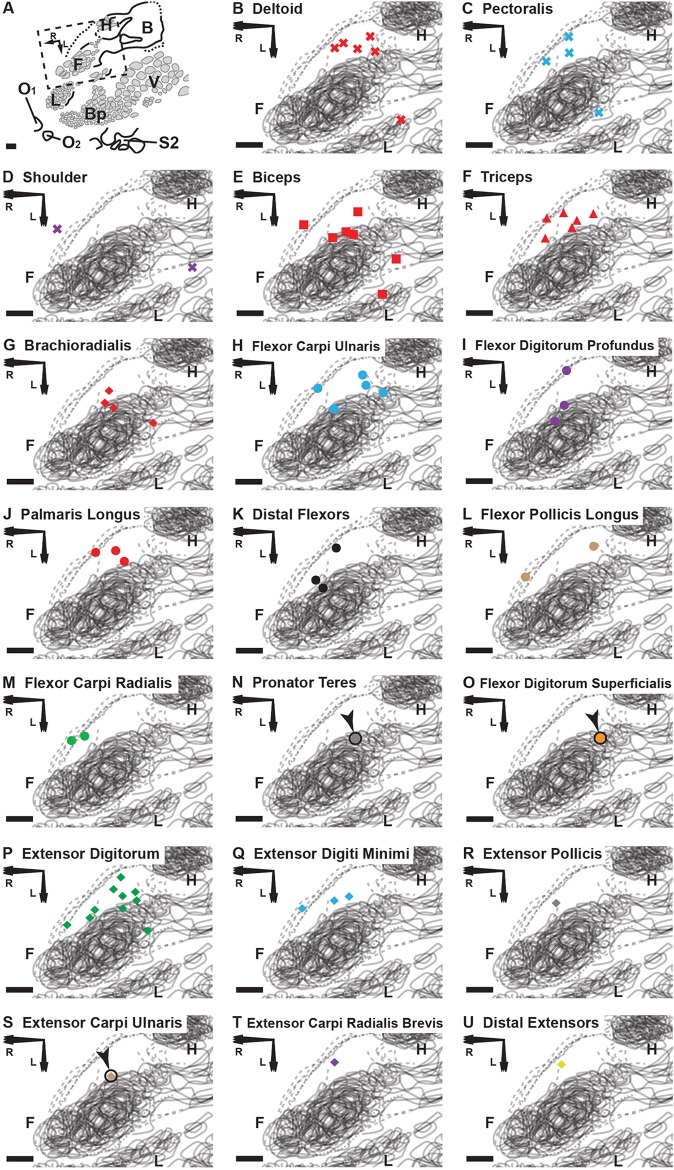
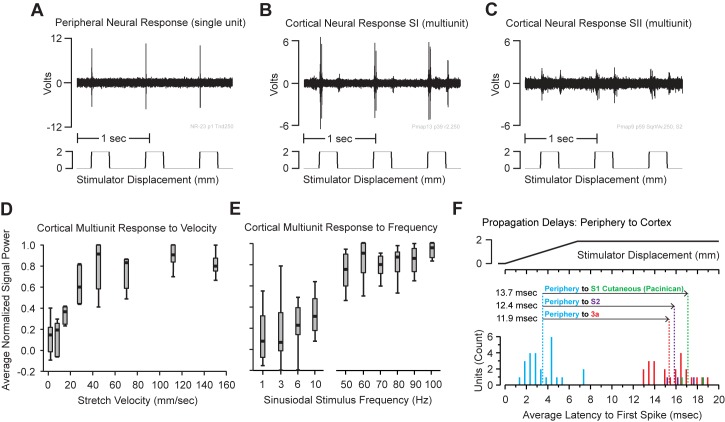
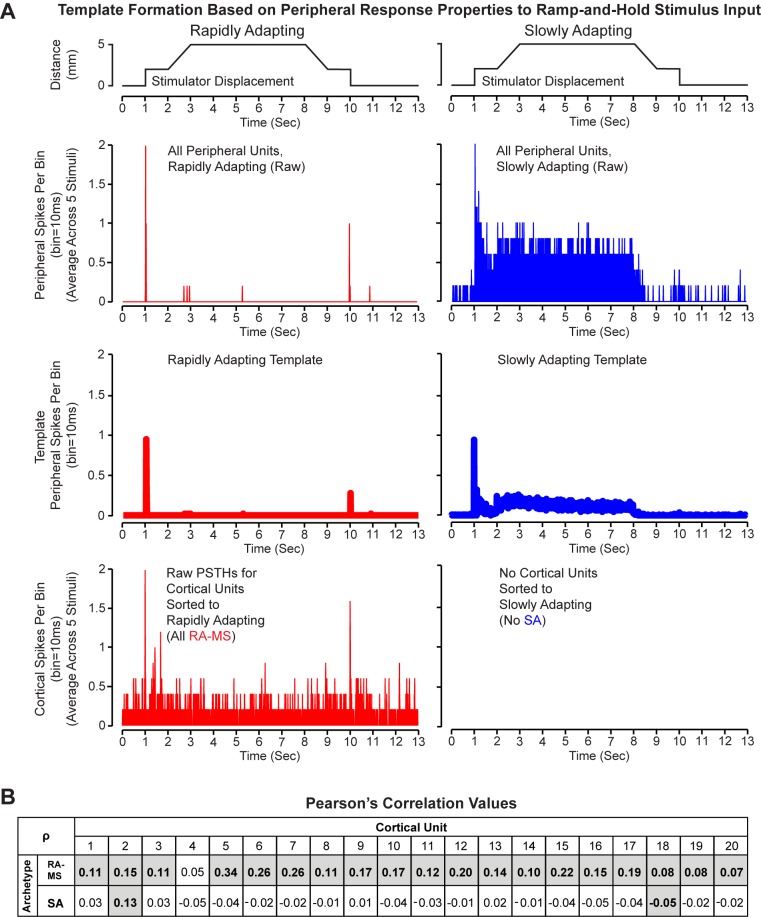
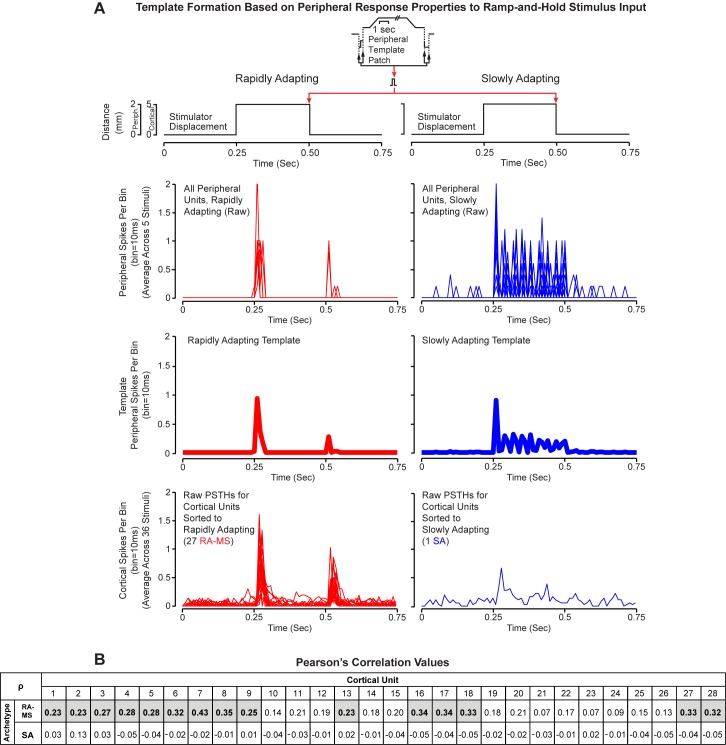
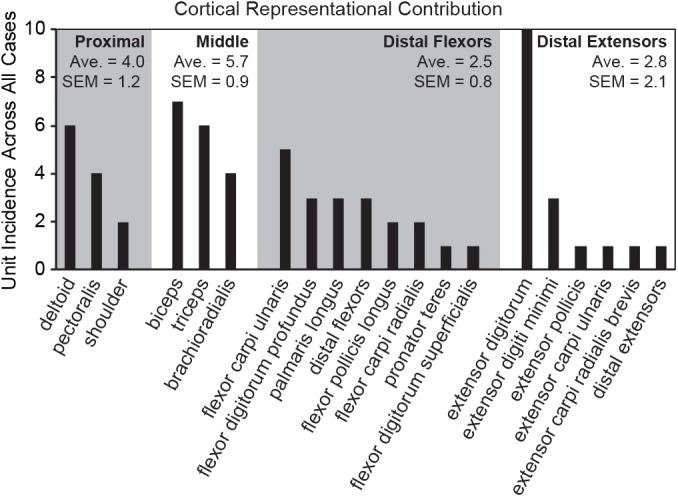
Kinesthesia is the sense of limb movement. It is fundamental to efficient motor control, yet its neurophysiological components remain poorly understood. The contributions of primary muscle spindles and cutaneous afferents to the kinesthetic sense have been well studied; however, potential contributions from muscle sensory group responses that are different than the muscle spindles have not been ruled out. Electrophysiological recordings in peripheral nerves and brains of male Sprague Dawley rats with a degloved forelimb preparation provide evidence of a rapidly adapting muscle sensory group response that overlaps with vibratory inputs known to generate illusionary perceptions of limb movement in humans (kinesthetic illusion). This group was characteristically distinct from type Ia muscle spindle fibers, the receptor historically attributed to limb movement sensation, suggesting that type Ia muscle spindle fibers may not be the sole carrier of kinesthetic information. The sensory-neural structure of muscles is complex and there are a number of possible sources for this response group; with Golgi tendon organs being the most likely candidate. The rapidly adapting muscle sensory group response projected to proprioceptive brain regions, the rodent homolog of cortical area 3a and the second somatosensory area (S2), with similar adaption and frequency response profiles between the brain and peripheral nerves. Their representational organization was muscle-specific (myocentric) and magnified for proximal and multi-articulate limb joints. Projection to proprioceptive brain areas, myocentric representational magnification of muscles prone to movement error, overlap with illusionary vibrational input, and resonant frequencies of volitional motor unit contraction suggest that this group response may be involved with limb movement processing.


Conflict of interest statement

Competing Interests: The authors have declared that no competing interests exist.

Figures

Fig 1
Fig 1. Static and dynamic response profiles for three response populations active during muscle stretch and vibrational input.
(A) Type Ia muscle spindle fibers showed a high instantaneous firing rate for the rapid onset of the square wave input and a lower instantaneous firing rate during the 3 mm/s slower onset. These receptors discharged randomly at a strong rate during the static phase. (B) Type II muscle spindle fibers showed similar instantaneous firing frequencies between the square-wave onset and the 3 mm/s dynamic phases with strong and consistent activity during the static phase. (C) The slope of the line for dynamic index by stretch rate (dynamic index slope) between points at fast (150 mm/s) and slow (3 mm/s) stretch rates had a bimodal distribution, separating the two slowly adapting receptor classes. Type Ia muscle spindles showed slopes between 0.2 and 1.1. Type II afferents showed slopes less than 0.08. (D) The RA-MS response group showed a different response to the dynamic and static phases of the ramp-and-hold tendon stretching input, firing a single impulse (occasionally two) at the onset of the square wave and with silence during all other stimulus phases.
Fig 2
Fig 2. Sinusoidal displacement frequency response profiles for the three identified response groups.
The grey background denotes the band of frequencies known to trigger the kinesthetic illusion [, –42]. The average impulses per cycle for all of the peripheral units. (A) Type Ia muscle spindles displayed high average impulses per cycle across the lower frequencies. (B) Type II muscle spindle fibers were similar to type Ia’s in the lower frequencies as well. (C) The average impulses per cycle for the RA response group were higher for the measured frequencies within the active range of the kinesthetic illusion. In contrast, the type Ia and type II slowly adapting populations showed the most activity in frequencies outside of the active range for the kinesthetic illusion. 1:1 thresholds were defined as responses tracking with 98–102 spikes over 100 cycles. Vibration amplitude boxes are stacked. (D) Type Ia muscle spindles show a flat, yet highly sensitive (at least 1:1 at 100 μm displacements) response across all measured frequencies. (E) Type II muscle spindle fibers were also sensitive across the measured frequency range although more sensitive to lower frequencies. (F) The RA-MS-type population was specifically sensitive to the higher measured frequencies with the highest sensitivity observed at 90 Hz. The RA-MS population was mostly insensitive to the lower frequencies at all but the highest (1 mm) displacement. The most sensitive portion of the frequency response profile for the RA-MS-type group response aligns with the reported frequencies of the kinesthetic illusion [, –42].
Fig 3
Fig 3. Bypassing the myotendinous junction.
(A&B) Two representative single unit peripheral nerve recording traces from the median nerve with schematic drawings of the limb tendons and musculature. The neural recordings were maintained while the stimulator pulled on the freed tendon with a 2 mm displacement. The upper neural recording trace shows responses through three cycles with the stimulator pulling on the freed distal tendon. The lower trace shows three cycles of the same afferent after the stimulator was moved to the muscle belly to bypass the myotendinous junction. The nerve signal was maintained in each position.
Fig 4
Fig 4. Cortical brain mapping of the RA-MS response group elicited by tapping the tendons of the degloved forelimb.
Symbols represent individual electrode penetrations: X = No Response; Red Stars = Cutaneous responses before paw denervation; Black Stars = Cutaneous responses after paw denervation. Scale bars = 500 μm; R = rostral; L = lateral. (A) Overview of the left cortical hemisphere in the rat. Cytochrome oxidase delineated borders and barrel patterns of primary somatosensory cortex (S1) (black lines and grey shading): F = forepaw barrel subfield; H = hindpaw barrel subfield; V = vibrissae; Bp = buccal pad; L = lower lip, O1 & O2 = oral modules 1 & 2; L = chin/lower lip; B = body; S2 = second somatosensory area. The dashed box denotes the area of interest enlarged in B through H. (B-H) The RA-MS response group projected to a region of cortex anterior and adjacent to the forepaw barrel subfield and the area between the caudal lower lip and forelimb representations. Recordings at each electrode penetration typically yielded responses from only a single muscle of the forelimb. The RA-MS responses were entirely exclusive from the cytochrome oxidase defined borders of the somatotopic S1 cutaneous representation. (I) A scaled composite overlay of all seven recording cases showing the global organization of the muscle-specific tapping-sensitive RA-MS responses in the rat. Although RA muscle afferents did project to areas near the forepaw and caudal lower lip, the majority of afferents projected to the darkly staining region connecting the forelimb and hindlimb representations (dashed lines). The random organization of the RA-MS unit responses is evident. In contrast, single electrode penetrations in the second somatosensory area (S2) had receptive fields that encompassed the entire forelimb.
Fig 5
Fig 5. Cortical brain mapping of the RA-MS response group elicited by tapping the tendons of the degloved forelimb organized by individual muscle sensory response.
(A) An overview of the left cortical hemisphere in the rat. Cytochrome oxidase delineated borders and barrel patterns of primary somatosensory cortex (black lines and grey shading): F = forepaw barrel subfield; H = hindpaw barrel subfield; V = vibrissae; Bp = buccal pad; L = lower lip, O1 & O2 = oral modules 1 & 2; L = chin/lower lip; B = body; S2 = second somatosensory area. The dashed box denotes the area of interest enlarged in (B) through (U). Scale bars = 500 μm; R = rostral; L = lateral. (B-U) The shapes of the labeled points refer to location or compartment: X = Shoulder; Square = Proximal Anterior Compartment; Triangle = Proximal Posterior Compartment; Circle = Distal Anterior Compartment; Diamond = Distal Posterior Compartment. We find that the muscles with the smallest overall representational area (the distal flexors and distal extensors) appear to project only to the transitional zone area that is rostral and medial to the S1 forepaw representation. In contrast, the proximal and middle muscles (except the triceps) and the extensor digitorum, each having a larger overall representational area, appear to project to transitional zone areas surrounding the S1 forepaw representation (A-D, F and O). Note: Although not evident in the composite overlays, the receptive fields for the RA-MS-type response group are separate from S1 (Fig 4B–4H).
Fig 6
Fig 6. Peripheral and cortical response properties of the units searched out with tapping input.
(A) A peripheral neural recording trace of an RA-MS-type single unit showing the characteristic responsiveness to the rapid onset of a square wave displacement and insensitivity to the static phase. (B) A cortical transitional zone multiunit (spike) recording of the input from a single forelimb muscle showing strong registration with the peripheral nerve activity. (C) A cortical S2 multiunit (spike) recording from an electrode penetration representing the entire forelimb showing similar response properties to both the peripheral and cortical transitional zone responses. (D) Calculation of cortical signal power shows an onset velocity of at least 30 mm/s was required for activation which was similar to the peripheral nerve RA onset rate dependent responses. (E) More cortical multiunit activity (increased signal power) was observed at the higher frequency band (50–100 Hz) with the highest measured activity recorded at 100 Hz (See also: Fig 2C and 2F). (F) Propagation delays from the periphery to cortex. Histograms for average time to first spike following a square wave input for 25 single units in the periphery (Blue), 23 single units in the transitional zone (Red), 3 single units in S2 (Purple), and 2 single units isolated with respect to a Pacinian corpuscle response in the cutaneous representation of S1 (Green). Average latencies for each population form the onset of the square wave were: 3.5 ms +/- 1.6 for the periphery, 15.4 ms +/- 1.7 for the transitional zone, 15.8 ms +/- 1.3 for S2, and 17.1 ms +/- 1.5 for the Pacinian response in the cutaneous representation of S1. The propagation delays from periphery to cortex were calculated by subtracting the average peripheral latency from the average cortical latencies for each cortical area.
Fig 7
Fig 7. Response data from cortical units and peripheral units with application of ramp-and-hold stimuli.
(A) Stimulator displacement (top), raw PSTH values for peripheral recordings from RA-MS-Type (red middle top) and SA units (blue middle top), template PSTH values for the RA-MS-Type (red middle bottom) and SA (blue middle bottom) peripheral response groups, and raw PSTH values for individual cortical units sorted to RA-MS (red bottom). All cortical recordings for ramp-and-hold inputs were classified to the RA-MS-type response group. (B) Matrix of Pearson’s correlation coefficients (ρ) calculated between each of the 20 individual cortical unit PSTHs (columns) and the two response group templates (rows). Values shaded with bold text indicate a significant correlation (p<0.05).
Fig 8
Fig 8. Response data from cortical units with application of square wave stimuli and from peripheral recordings patched from the square wave portions of the ramp-and-hold stimuli.
(A) Stimulator displacement (top), raw PSTH values for peripheral recordings from RA-MS-Type (red middle top) and SA units (blue middle top), template PSTH values for the RA-MS-Type (red middle bottom) and SA (blue middle bottom) peripheral response groups, and raw PSTH values for individual cortical units sorted to RA-MS (red bottom) and SA (blue bottom). All but one cortical recording for square wave inputs were classified to the RA-MS-type response group. (B) Matrix of Pearson’s correlation coefficients (ρ) calculated between each of the 28 individual cortical unit transformed histograms (columns) and the two response group templates (rows). Values shaded with bold text indicate a significant correlation (p<0.05).
Fig 9
Fig 9. A count of the incidence of each muscle receptive field recorded in the cortex across all seven brain mapping cases.
The highest number of RA-MS group responses projected to muscles crossing the proximal joints and the extensor digitorum, with fewer responses projecting to the distal phalangeal flexors and extensors.

References

    1. Cole JD, Sedgwick EM. The perceptions of force and of movement in a man without large myelinated sensory afferents below the neck. J Physiol. 1992;449:503–15. Epub 1992/04/01. . - PMC - PubMed
    1. Abbruzzese G, Berardelli A. Sensorimotor integration in movement disorders. Mov Disord. 2003;18(3):231–40. Epub 2003/03/07. doi: 10.1002/mds.10327 . - DOI - PubMed
    1. Phillips CG, Powell TP, Wiesendanger M. Projection from low-threshold muscle afferents of hand and forearm to area 3a of baboon's cortex. J Physiol. 1971;217(2):419–46. . - PMC - PubMed
    1. Hore J, Preston JB, Cheney PD. Responses of cortical neurons (areas 3a and 4) to ramp stretch of hindlimb muscles in the baboon. J Neurophysiol. 1976;39(3):484–500. . - PubMed
    1. Huerta MF, Pons TP. Primary motor cortex receives input from area 3a in macaques. Brain Res. 1990;537(1–2):367–71. . - PubMed

LinkOut - more resources