

Comparison of β-Cell Function Between Overweight/Obese Adults and Adolescents Across the Spectrum of Glycemia
- PMID: 29183909
- PMCID: PMC5780051
- DOI: 10.2337/dc17-1373
Comparison of β-Cell Function Between Overweight/Obese Adults and Adolescents Across the Spectrum of Glycemia
Abstract
Objective: Type 2 diabetes is a growing health problem among both adults and adolescents. To better understand the differences in the pathogenesis of diabetes between these groups, we examined differences in β-cell function along the spectrum of glucose tolerance.
Research design and methods: We evaluated 89 adults and 50 adolescents with normal glucose tolerance (NGT), dysglycemia, or type 2 diabetes. Oral glucose tolerance test results were used for C-peptide and insulin/glucose minimal modeling. Model-derived and direct measures of insulin secretion and insulin sensitivity were compared across glycemic stages and between age-groups at each stage.
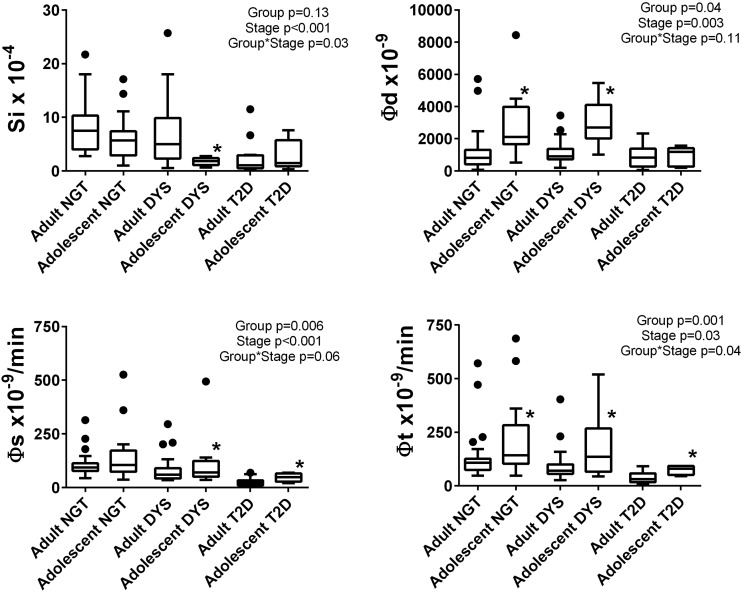
Results: In adolescents with dysglycemia, there was marked insulin resistance (insulin sensitivity index: adolescents, median [interquartile range] 1.8 [1.1-2.4] × 10-4; adults, 5.0 [2.3-9.9]; P = 0.01). The nature of β-cell dysfunction across stages of dysglycemia differed between the groups. We observed higher levels of secretion among adolescents than adults (total insulin secretion: NGT, 143 [103-284] × 10-9/min adolescent vs. 106 [71-127], P = 0.001); adults showed stepwise impairments in static insulin secretion (NGT, 7.5 [4.0-10.3] × 10-9/min; dysglycemia, 5.0 [2.3-9.9]; type 2 diabetes, 0.7 [0.1-2.45]; P = 0.003), whereas adolescents showed diabetes-related impairment in dynamic secretion (NGT, 1,905 [1,630-3,913] × 10-9; dysglycemia, 2,703 [1,323-3,637]; type 2 diabetes, 1,189 [269-1,410]; P = 0.001).
Conclusions: Adults and adolescents differ in the underlying defects leading to dysglycemia, and in the nature of β-cell dysfunction across stages of dysglycemia. These results may suggest different approaches to diabetes prevention in youths versus adults.
© 2017 by the American Diabetes Association.
Figures

Similar articles
-
Each degree of glucose intolerance in pregnancy predicts distinct trajectories of β-cell function, insulin sensitivity, and glycemia in the first 3 years postpartum.Diabetes Care. 2014 Dec;37(12):3262-9. doi: 10.2337/dc14-1529. Epub 2014 Sep 17. Diabetes Care. 2014. PMID: 25231898
-
Evidence of reduced β-cell function in Asian Indians with mild dysglycemia.Diabetes Care. 2013 Sep;36(9):2772-8. doi: 10.2337/dc12-2290. Epub 2013 Apr 17. Diabetes Care. 2013. PMID: 23596180 Free PMC article.
-
Insulin and C-peptide levels, pancreatic beta cell function, and insulin resistance across glucose tolerance status in Thais.J Clin Lab Anal. 2007;21(2):85-90. doi: 10.1002/jcla.20138. J Clin Lab Anal. 2007. PMID: 17385686 Free PMC article.
-
Progression of β-cell dysfunction in obese youth.Curr Diab Rep. 2013 Feb;13(1):89-95. doi: 10.1007/s11892-012-0347-7. Curr Diab Rep. 2013. PMID: 23179960 Review.
-
Development of type 2 diabetes mellitus in the obese adolescent: a growing challenge.Endocr Pract. 2012 Sep-Oct;18(5):791-5. doi: 10.4158/EP12142.RA. Endocr Pract. 2012. PMID: 23047931 Review.
Cited by
-
Sex-specific association of circulating Isthmin-1 with isolated post-challenge hyperglycemia.Front Endocrinol (Lausanne). 2024 Jul 25;15:1394190. doi: 10.3389/fendo.2024.1394190. eCollection 2024. Front Endocrinol (Lausanne). 2024. PMID: 39119006 Free PMC article.
-
Risk of Type 2 Diabetes Among Individuals with Excess Weight: Weight Trajectory Effects.Curr Diab Rep. 2022 Sep;22(9):471-479. doi: 10.1007/s11892-022-01486-9. Epub 2022 Jul 4. Curr Diab Rep. 2022. PMID: 35781782 Free PMC article. Review.
-
Metabolic Contrasts Between Youth and Adults With Impaired Glucose Tolerance or Recently Diagnosed Type 2 Diabetes: I. Observations Using the Hyperglycemic Clamp.Diabetes Care. 2018 Aug;41(8):1696-1706. doi: 10.2337/dc18-0244. Epub 2018 Jun 25. Diabetes Care. 2018. PMID: 29941497 Free PMC article. Clinical Trial.
-
The age of obesity onset affects changes in subcutaneous adipose tissue macrophages and T cells after weight loss.Front Immunol. 2025 Aug 4;16:1601847. doi: 10.3389/fimmu.2025.1601847. eCollection 2025. Front Immunol. 2025. PMID: 40831565 Free PMC article.
-
Sarcopenia Coexisting with High Adiposity Exacerbates Insulin Resistance and Dyslipidemia in Saudi Adult Men.Diabetes Metab Syndr Obes. 2020 Aug 25;13:3089-3097. doi: 10.2147/DMSO.S260382. eCollection 2020. Diabetes Metab Syndr Obes. 2020. PMID: 32922058 Free PMC article.
References
-
- Saad MF, Knowler WC, Pettitt DJ, Nelson RG, Charles MA, Bennett PH. A two-step model for development of non-insulin-dependent diabetes. Am J Med 1991;90:229–235 - PubMed
-
- Kahn SE, Prigeon RL, McCulloch DK, et al. . Quantification of the relationship between insulin sensitivity and β-cell function in human subjects: evidence for a hyperbolic function. Diabetes 1993;42:1663–1672 - PubMed
Publication types
MeSH terms
Substances
Grants and funding
LinkOut - more resources
Full Text Sources
Other Literature Sources
Medical
