RNA2DMut: a web tool for the design and analysis of RNA structure mutations
- PMID: 29183923
- PMCID: PMC5824348
- DOI: 10.1261/rna.063933.117
RNA2DMut: a web tool for the design and analysis of RNA structure mutations
Abstract
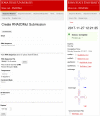
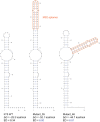
With the widespread application of high-throughput sequencing, novel RNA sequences are being discovered at an astonishing rate. The analysis of function, however, lags behind. In both the cis- and trans-regulatory functions of RNA, secondary structure (2D base-pairing) plays essential regulatory roles. In order to test RNA function, it is essential to be able to design and analyze mutations that can affect structure. This was the motivation for the creation of the RNA2DMut web tool. With RNA2DMut, users can enter in RNA sequences to analyze, constrain mutations to specific residues, or limit changes to purines/pyrimidines. The sequence is analyzed at each base to determine the effect of every possible point mutation on 2D structure. The metrics used in RNA2DMut rely on the calculation of the Boltzmann structure ensemble and do not require a robust 2D model of RNA structure for designing mutations. This tool can facilitate a wide array of uses involving RNA: for example, in designing and evaluating mutants for biological assays, interrogating RNA-protein interactions, identifying key regions to alter in SELEX experiments, and improving RNA folding and crystallization properties for structural biology. Additional tools are available to help users introduce other mutations (e.g., indels and substitutions) and evaluate their effects on RNA structure. Example calculations are shown for five RNAs that require 2D structure for their function: the MALAT1 mascRNA, an influenza virus splicing regulatory motif, the EBER2 viral noncoding RNA, the Xist lncRNA repA region, and human Y RNA 5. RNA2DMut can be accessed at https://rna2dmut.bb.iastate.edu/.
Keywords: EBV; MALAT1; RNA; influenza; ncRNA; structure.
© 2018 Moss; Published by Cold Spring Harbor Laboratory Press for the RNA Society.
Figures


Similar articles
-
Rtools: a web server for various secondary structural analyses on single RNA sequences.Nucleic Acids Res. 2016 Jul 8;44(W1):W302-7. doi: 10.1093/nar/gkw337. Epub 2016 Apr 29. Nucleic Acids Res. 2016. PMID: 27131356 Free PMC article.
-
Efficient algorithms for probing the RNA mutation landscape.PLoS Comput Biol. 2008 Aug 8;4(8):e1000124. doi: 10.1371/journal.pcbi.1000124. PLoS Comput Biol. 2008. PMID: 18688270 Free PMC article.
-
Parallel computation of genome-scale RNA secondary structure to detect structural constraints on human genome.BMC Bioinformatics. 2016 May 6;17(1):203. doi: 10.1186/s12859-016-1067-9. BMC Bioinformatics. 2016. PMID: 27153986 Free PMC article.
-
Energy-based RNA consensus secondary structure prediction in multiple sequence alignments.Methods Mol Biol. 2014;1097:125-41. doi: 10.1007/978-1-62703-709-9_7. Methods Mol Biol. 2014. PMID: 24639158 Review.
-
Recent advances in RNA folding.J Biotechnol. 2017 Nov 10;261:97-104. doi: 10.1016/j.jbiotec.2017.07.007. Epub 2017 Jul 8. J Biotechnol. 2017. PMID: 28690134 Review.
Cited by
-
Mapping the RNA structural landscape of viral genomes.Methods. 2020 Nov 1;183:57-67. doi: 10.1016/j.ymeth.2019.11.001. Epub 2019 Nov 8. Methods. 2020. PMID: 31711930 Free PMC article.
-
Analyses of human cancer driver genes uncovers evolutionarily conserved RNA structural elements involved in posttranscriptional control.PLoS One. 2022 Feb 25;17(2):e0264025. doi: 10.1371/journal.pone.0264025. eCollection 2022. PLoS One. 2022. PMID: 35213597 Free PMC article.
-
The integrity of the U12 snRNA 3' stem-loop is necessary for its overall stability.Nucleic Acids Res. 2021 Mar 18;49(5):2835-2847. doi: 10.1093/nar/gkab048. Nucleic Acids Res. 2021. PMID: 33577674 Free PMC article.
-
The RNA encoding the microtubule-associated protein tau has extensive structure that affects its biology.PLoS One. 2019 Jul 10;14(7):e0219210. doi: 10.1371/journal.pone.0219210. eCollection 2019. PLoS One. 2019. PMID: 31291322 Free PMC article.
-
Optimized photochemistry enables efficient analysis of dynamic RNA structuromes and interactomes in genetic and infectious diseases.Nat Commun. 2021 Apr 20;12(1):2344. doi: 10.1038/s41467-021-22552-y. Nat Commun. 2021. PMID: 33879794 Free PMC article.
References
Publication types
MeSH terms
Substances
Grants and funding
LinkOut - more resources
Full Text Sources
Other Literature Sources
