. 2017 Dec 12;114(50):E10838-E10847.
doi: 10.1073/pnas.1709207114. Epub 2017 Nov 28.

Proteomics of phosphorylation and protein dynamics during fertilization and meiotic exit in the Xenopus egg

Affiliations

Proteomics of phosphorylation and protein dynamics during fertilization and meiotic exit in the Xenopus egg

Marc Presler et al. Proc Natl Acad Sci U S A. .

Abstract

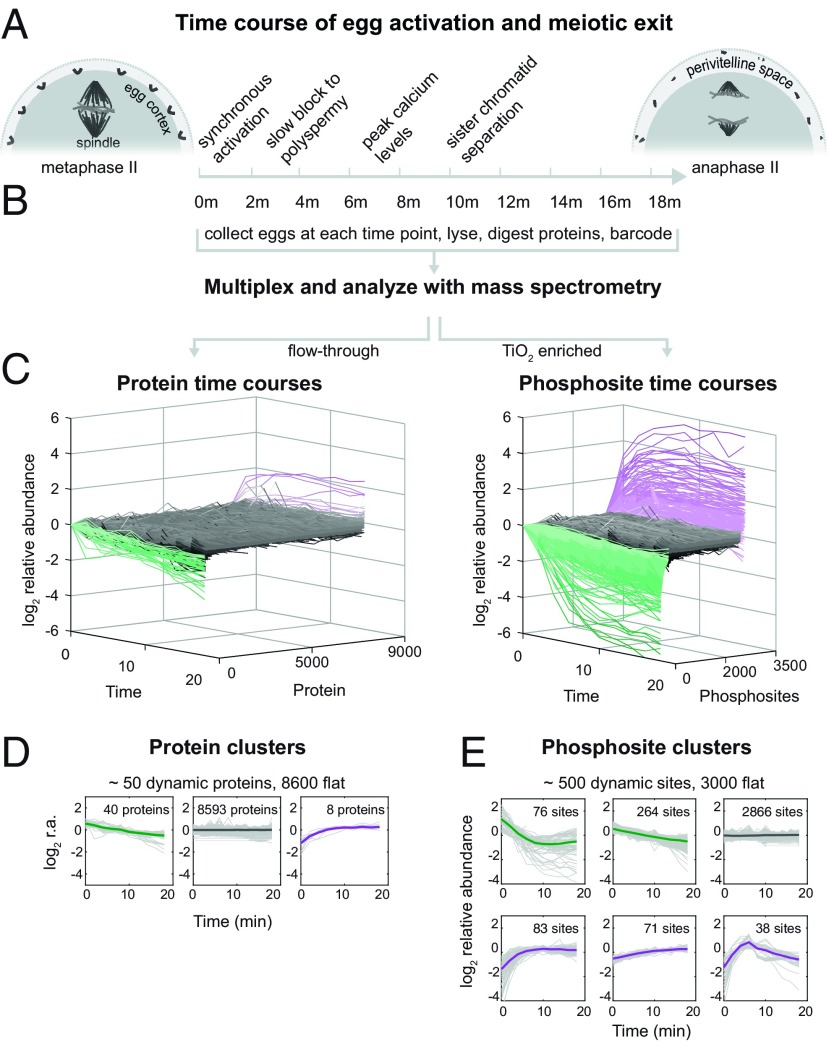
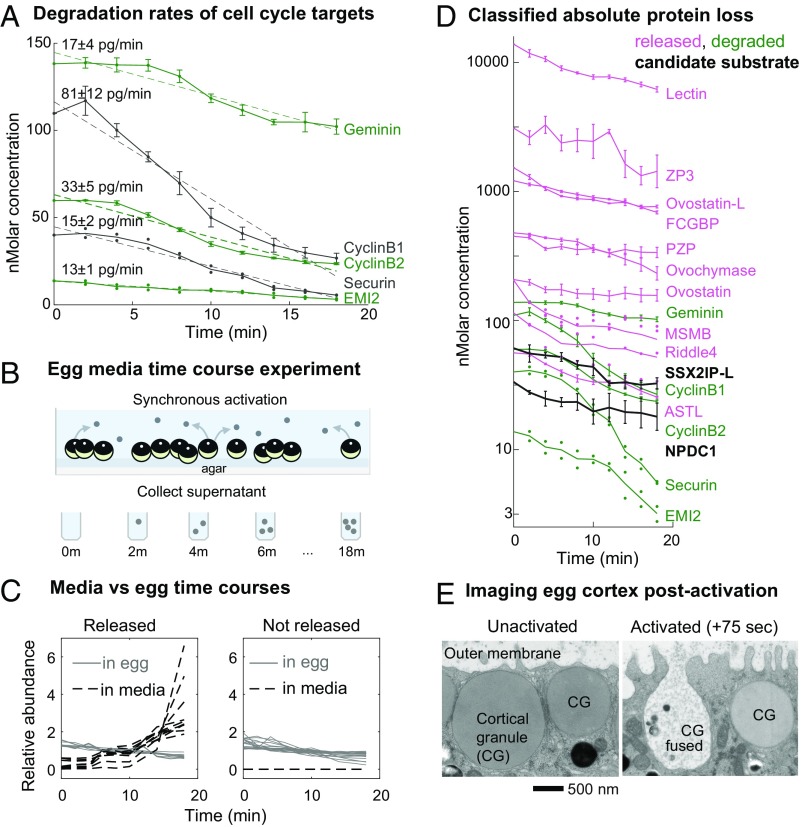
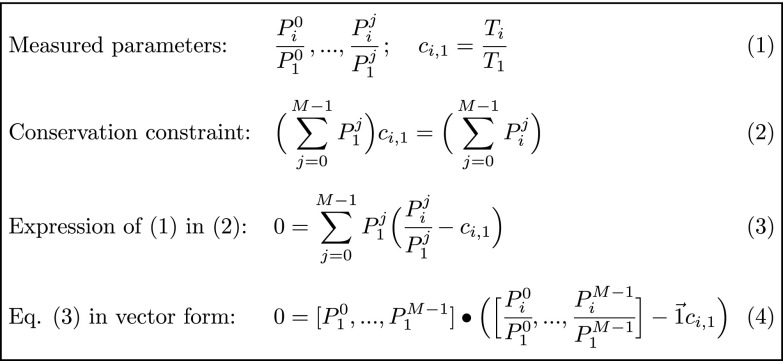
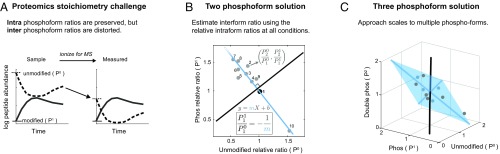
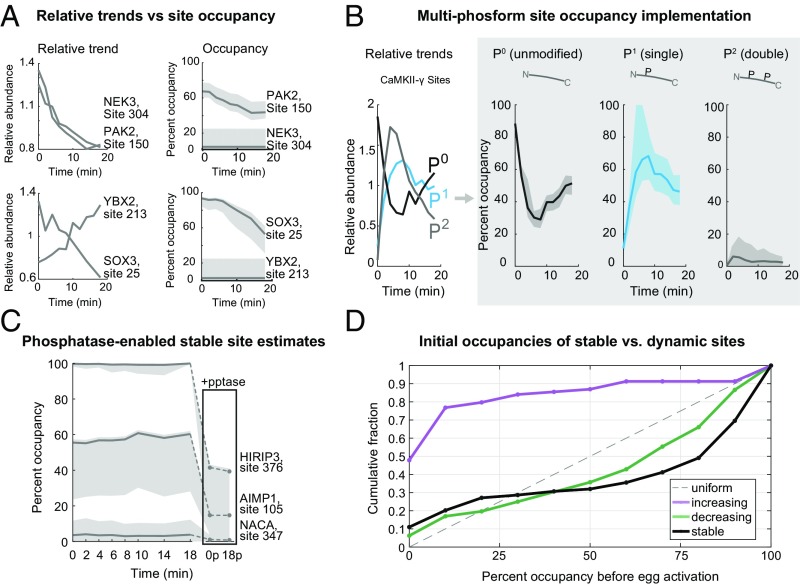
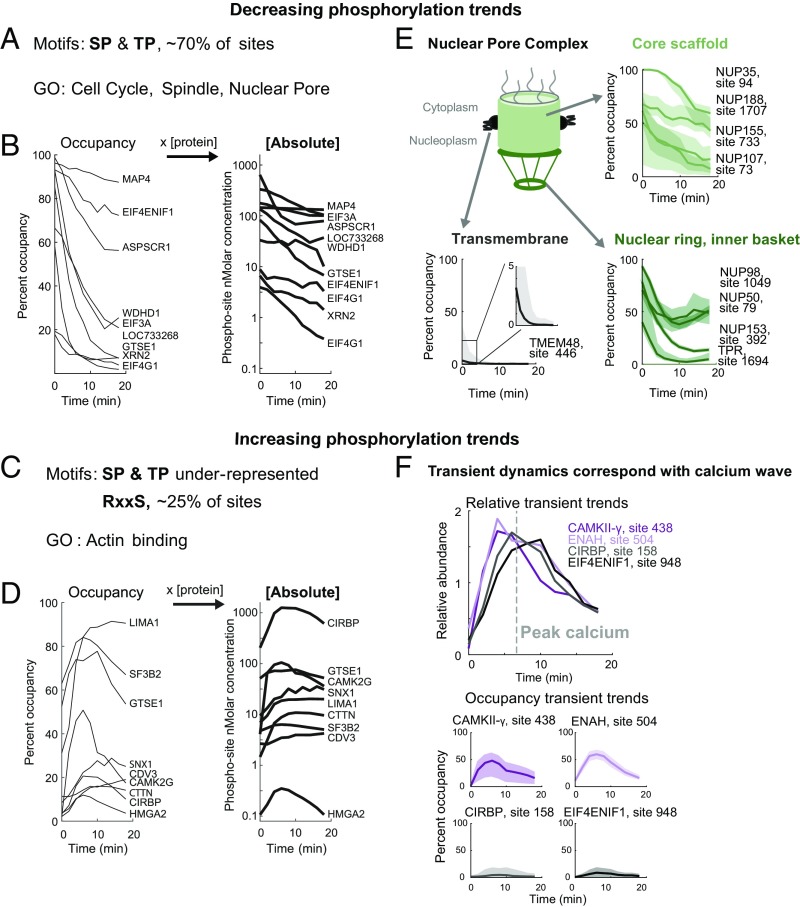
Fertilization releases the meiotic arrest and initiates the events that prepare the egg for the ensuing developmental program. Protein degradation and phosphorylation are known to regulate protein activity during this process. However, the full extent of protein loss and phosphoregulation is still unknown. We examined absolute protein and phosphosite dynamics of the fertilization response by mass spectrometry-based proteomics in electroactivated eggs. To do this, we developed an approach for calculating the stoichiometry of phosphosites from multiplexed proteomics that is compatible with dynamic, stable, and multisite phosphorylation. Overall, the data suggest that degradation is limited to a few low-abundance proteins. However, this degradation promotes extensive dephosphorylation that occurs over a wide range of abundances during meiotic exit. We also show that eggs release a large amount of protein into the medium just after fertilization, most likely related to the blocks to polyspermy. Concomitantly, there is a substantial increase in phosphorylation likely tied to calcium-activated kinases. We identify putative degradation targets and components of the slow block to polyspermy. The analytical approaches demonstrated here are broadly applicable to studies of dynamic biological systems.

Keywords: TMT; cell cycle; confidence intervals; polyspermy block; stoichiometry.


Conflict of interest statement

The authors declare no conflict of interest.

Figures

Fig. 1.
Fig. 1.
Experimental overview. (A) Fertilization and egg activation release metaphase-arrested oocytes into anaphase and initiate the slow block to polyspermy, sister chromatid separation, remodeling of the specialized egg extracellular matrix, and inflation of the perivitelline space, among other processes. We mimic fertilization and trigger egg activation via electric shock to maximize synchrony. (B) After activation, eggs were collected every 2 min, lysed, and digested with proteases. Samples were barcoded using tandem mass tags (TMTs) and multiplexed. Protein and phosphosite dynamics were measured with mass spectrometry-based proteomics. Phosphorylated peptides were enriched using TiO2, and the column flow-through peptides were used for protein analysis. (C) Modified waterfall plots displaying the trend of every protein and phosphosite in the dataset, normalized to the first time point and ordered first by clusters (see below) and then in ascending order within each cluster. (D and E) K-means clustering to summarize dynamic classes of the protein (D) and phosphorylation time series (E) (SI Appendix, SI Methods). Bold line represents the centroid of the cluster, while the gray lines are individual time courses (normalized to the time course means).
Fig. 2.
Fig. 2.
Protein loss occurs by degradation and release: Experiments and analysis performed to classify the mechanism of protein loss following egg activation. (A) Time series of the five proteins identified as significantly decreasing, which are known cell cycle degradation targets, plotted by their absolute changes. Error bars reflect SE (SEM) for proteins detected in at least three biological replicates. For proteins detected in fewer than three replicates, all data available are shown as points. Dashed lines represent a linear fit to the approximate zero-order kinetics (labeled with the slope and 95% confidence interval). (B) Experimental design to test for proteins released by eggs upon fertilization as an explanation for protein loss. Released proteins will increase in the media fraction over time. (C) Time series for proteins detected in both the egg and supernatant or the egg alone. These data were used to classify whether proteins were lost by release rather than degradation (by direct evidence or annotation; see text). This class comprised all but two of the significantly decreasing proteins (D) besides the known targets shown in A. (D) Time series of protein loss plotted by their absolute abundance (log10 transformed) and classified by the mechanism of loss. Error is visualized as in A. SSX2IP-L and NPDC1 homologs (black) are putative new degradation targets (see text for full criteria). (E) EM images of the cortical granules (CG) on the egg cortex. After egg activation, cortical granules fuse with the outer membrane and expel their contents.
Fig. 3.
Fig. 3.
The geometric relationship between the measured peptide form ratios and their unknown absolute values. Let Pij equal the absolute abundance of peptide form j in condition i, where j = 0,1, ..., M−1, 0 = unmodified, and M is the number of forms, and where i = 1, ..., N, where N is the number of measurements. Pij/P1j is the MS signal of form j at condition i normalized by the reference condition i = 1. ci,1 is the ratio of the parent protein T between measurement (i) and measurement 1 (Eq. 1). The sum of all peptide forms is conserved or scaled by ci,1 (Eq. 2). Rewriting Eq. 2 in terms of the measured parameters (1) yields Eq. 3, which is written in vector form as Eq. 4. Eq. 4 shows that the vector of absolute values is orthogonal to the M−1 dimensional subspace containing the measured ratios. When M = 2, this subspace is a line (SI Appendix, Fig. S8). For M > 2, this subspace is an M−1 dimensional plane. For overdetermined systems (N > M), this subspace can be estimated with regression (Fig. 4 and SI Appendix, SI Methods).
Fig. 4.
Fig. 4.
Calculation of phospho-stoichiometry from multiplexed phospho-dynamics measurements: Demonstrating a graphical approach to estimating phosphosite occupancy of multiplexed data. (A) Phosphosite occupancy cannot be directly calculated from the raw signal from the mass spectrometer because the interform ratios are distorted due to the differential ionization efficiencies of the peptide forms. This is depicted here as the unmodified form (P0) ionizing less efficiently than the modified form (P1). However, the intraform ratios are preserved (i.e., only the starting point is shifted). (B and C) Estimating the solution for the overdetermined system from multiplexed-MS data. (B) For each condition, the measured intraform ratios of change of the unmodified (P0) and single phosphorylated (P1) forms (Fig. 3) define coordinates in a 2D plane. The relative ratio is defined by the reference point, which in this case is point 1 (black point). The solution to the overdetermined system can be estimated by regression. The unknown interform P1/P0 ratio is the negative inverse of the fit line slope (i.e., is the orthogonal slope) [see Fig. 3 (Eq. 4) and SI Appendix, SI Methods and Fig. S8]. (C) For more than two P forms, the known ratios define a higher dimensional plane (e.g., a plane is fit in 3D space from the ratios of the P0, P1, and double-form P2). The plane is visualized as the blue shaded area spanned by two vectors. The solution (the black vector) is orthogonal to the plane, as in Fig. 4B. These vectors are calculated by principal-component analysis (see text). Data points are plotted in gray, and blue-shaded points are behind the plane.
Fig. 5.
Fig. 5.
Occupancy of phosphorylation sites in time series postactivation. (A) Time series of two kinases (NEK3, PAK2) and two transcription factors/nucleotide binding proteins (SOX3, YBX2) demonstrating that similar amounts of relative changes can give very different occupancy changes (shaded area is the 95% confidence interval). (B) Phospho-occupancy time series of a multiphosphorylated CaMKII-γ peptide. (C) Reliable estimation of stable site occupancy is enabled by inducing dynamics with phosphatase treatment (see text; SI Appendix, Fig. S12). Examples of stoichiometry estimated with phosphatase treatment are shown here. Treated conditions are replicates of the 0- and 18-min time points (boxed). (D) Cumulative distributions of the initial phosphosite occupancies at 0 min (unactivated egg) classified by whether the sites increase, decrease, or are stable after egg activation. A uniform distribution would lie on the dotted line.
Fig. 6.
Fig. 6.
Phosphosite dynamics following egg activation: Analysis of the phosphorylation trends (increasing and decreasing) following egg activation with individual examples. (A) Motif enrichment analysis (P << 0.01) results and gene set enrichment analysis (GSEA) of GO terms (P < 0.01) results for dephosphorylated proteins. (B) Time series of selected proline-directed phosphorylation plotted as occupancy and absolute phosphate dynamics (log10 transformed). All trends shown pass a 95% confidence interval width threshold of ±25%. (C) Motif analysis results as in A for proteins with increasing phosphorylation trends and GSEA results. (D) Examples of increasing phosphorylation (plotted as in B). (E) Phospho-occupancy trends showing differential dephosphorylation of nuclear pore complex (NPC) regions with confidence intervals. (F) Relative and phospho-occupancy time series of proteins showing transient trends corresponding to the peak of calcium concentrations.

References

    1. Izawa D, Pines J. How APC/C-Cdc20 changes its substrate specificity in mitosis. Nat Cell Biol. 2011;13:223–233. - PMC - PubMed
    1. Tunquist BJ, Maller JL. Under arrest: Cytostatic factor (CSF)-mediated metaphase arrest in vertebrate eggs. Genes Dev. 2003;17:683–710. - PubMed
    1. Singh SA, et al. Co-regulation proteomics reveals substrates and mechanisms of APC/C-dependent degradation. EMBO J. 2014;33:385–399. - PMC - PubMed
    1. Liu Z, et al. GPS-ARM: Computational analysis of the APC/C recognition motif by predicting D-boxes and KEN-boxes. PLoS One. 2012;7:e34370. - PMC - PubMed
    1. Sivakumar S, Gorbsky GJ. Spatiotemporal regulation of the anaphase-promoting complex in mitosis. Nat Rev Mol Cell Biol. 2015;16:82–94. - PMC - PubMed

Publication types

LinkOut - more resources