. 2017 Dec 12;114(50):E10819-E10828.
doi: 10.1073/pnas.1717337114. Epub 2017 Nov 28.

Vasopressin excites interneurons to suppress hippocampal network activity across a broad span of brain maturity at birth

Affiliations

Vasopressin excites interneurons to suppress hippocampal network activity across a broad span of brain maturity at birth

Albert Spoljaric et al. Proc Natl Acad Sci U S A. .

Abstract

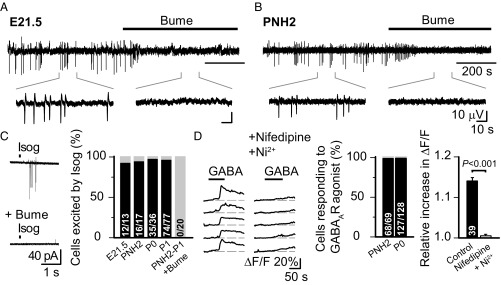
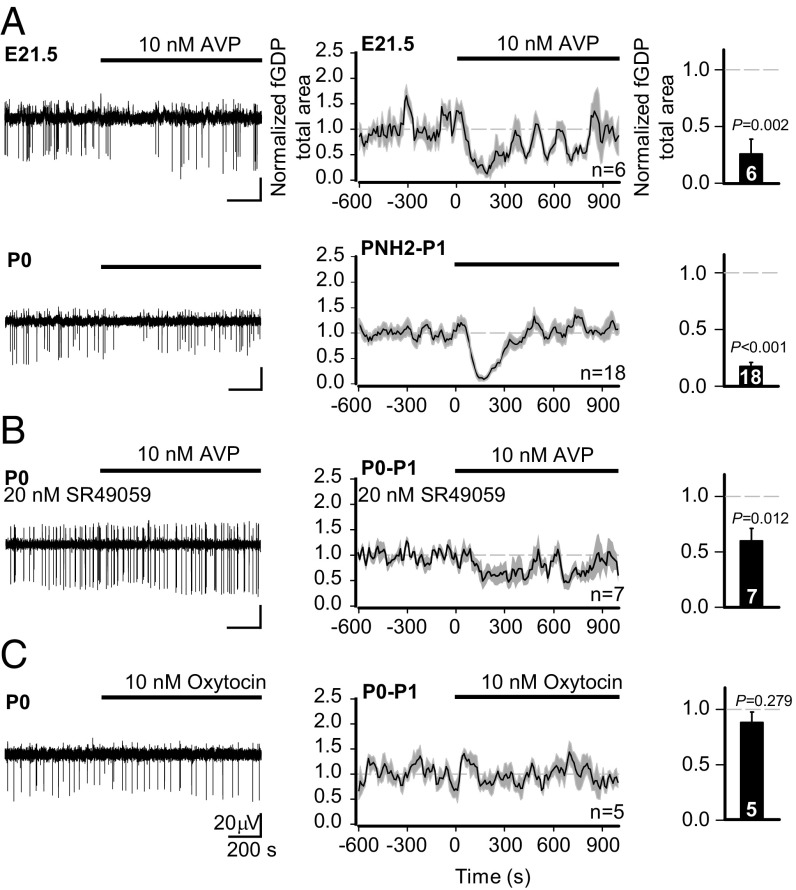
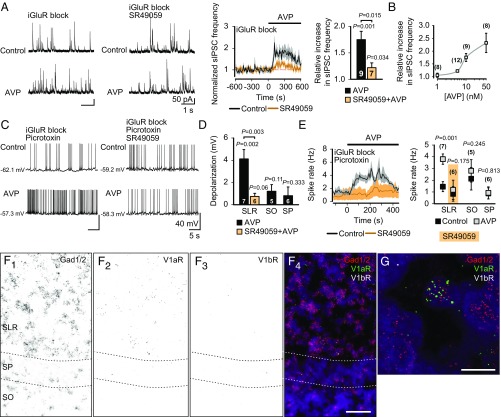
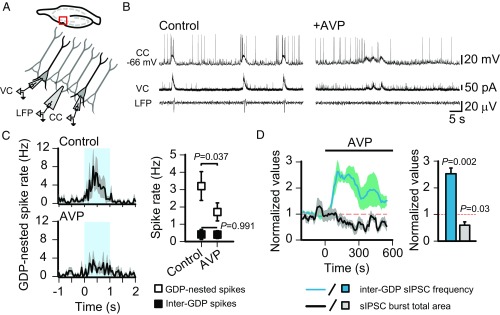
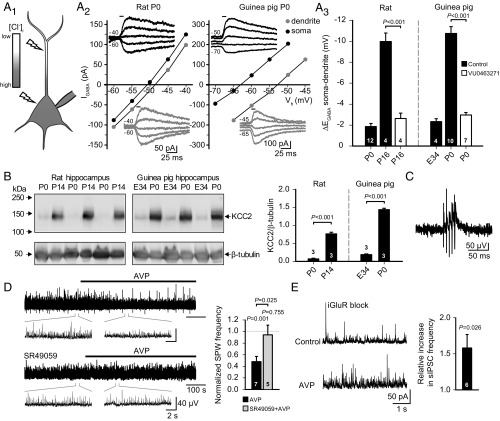
During birth in mammals, a pronounced surge of fetal peripheral stress hormones takes place to promote survival in the transition to the extrauterine environment. However, it is not known whether the hormonal signaling involves central pathways with direct protective effects on the perinatal brain. Here, we show that arginine vasopressin specifically activates interneurons to suppress spontaneous network events in the perinatal hippocampus. Experiments done on the altricial rat and precocial guinea pig neonate demonstrated that the effect of vasopressin is not dependent on the level of maturation (depolarizing vs. hyperpolarizing) of postsynaptic GABAA receptor actions. Thus, the fetal mammalian brain is equipped with an evolutionarily conserved mechanism well-suited to suppress energetically expensive correlated network events under conditions of reduced oxygen supply at birth.

Keywords: GDP; KCC2; birth asphyxia; bumetanide; oxytocin.


Conflict of interest statement

The authors declare no conflict of interest.

Figures

Fig. 1.
Fig. 1.
Hippocampus of P0 rats receives vasopressinergic innervation. (A1) Overview of a whole P0 rat brain optically cleared using CLARITY and stained against NPII (n = 2 within 2 h from birth and n = 3 during later time points at P0). Grid squares are 2 × 2 mm in size. (A2) Rectangle in A1 is shown at higher magnification. NPII staining strongly labels the vasopressinergic cell bodies in the hypothalamic area. The PVN are visible on the left side of the image, and the SON are visible in the upper right corner. 3V, third ventricle. (Scale bar: 200 μm.) (B1) NPII-positive fibers were detected in various parts of the hippocampal formation, including CA3 and the dentate gyrus (DG). (Scale bar: 200 μm.) (B2) Magnification of the rectangle shown in B1 depicts a segment of a single NPII-positive fiber in the CA3 region. (Scale bar: 50 μm.) An overview of NPII-positive fibers throughout the hippocampus is shown in Movie S1.
Fig. 2.
Fig. 2.
GABA is depolarizing throughout the perinatal period in rat CA3 pyramidal neurons. Sample traces of fGDPs from the CA3 region of E21.5 (A) and PNH2 (B) in toto hippocampi (filtered at 1–10 Hz). Bumetanide (Bume, 10 μM) fully blocked fGDPs in all recordings (E21.5, n = 3; PNH2, n = 5). (Insets) Magnified views. (Scale bar values in B apply also to A.) (C) Puff-application of isoguvacine (Isog, 100 μM) elicits spiking in perinatal CA3 pyramidal neurons in the presence of iGluR block. Evoked spikes were abolished by bath application of Bume. Sample traces from a loose patch recording (Left) and the percentage of cells responding to Isog in all perinatal age groups (Right) are shown. (D, Left) Representative sample traces showing intracellular calcium [Ca2+]i transients evoked by GABA (75 μM) in the absence and presence of the L- and T-type Ca2+ channel inhibitors nifedipine (10 μM) and Ni2+ (100 μM) in Fluo4-loaded CA3 pyramidal neurons. (D, Center) Percentages of cells responding to GABAAR activation with an increase in [Ca2+]i at PNH2 and P0 . (D, Right) Mean reduction of [Ca2+]i transients upon activation of GABAARs before and during L- and T-type Ca2+ channel inhibition (pooled data from PNH2, n = 19; P0, n = 20; paired t test was used for statistical analysis). Data are provided as mean ± SEM, and n values are provided in bars. ΔF/F, fluorescence change divided by baseline fluorescence.
Fig. 3.
Fig. 3.
AVP suppresses hippocampal fGDPs in a V1aR-dependent manner during the perinatal period. (AC, Left) Sample traces of fGDPs measured from the hippocampal CA3 region (filtered at 1–10 Hz). (AC, Center) Continuous quantification of the mean normalized fGDP total area throughout the experiment; data are shown as a moving average (60-s window, 10-s bins, 10-s step) ± SEM. (AC, Right) Quantification of the neurohormone effect on the mean normalized fGDP total area (mean ± SEM). Here and in the following figures, we quantified the (average) values during minutes 2 to 4 from the start of AVP application. (A) Effect of AVP (10 nM) on fGDPs in E21.5 and PNH2–P1 in toto hippocampi. (B) AVP application in the continuous presence of the V1aR antagonist SR49059 in P0–P1 hippocampal slices. (C) fGDPs in P0–P1 slices before and during bath application of OT (10 nM). The n values are provided in the panels. A paired t test was used for statistical analysis. (Scale bar values in C apply to all sample traces.)
Fig. 4.
Fig. 4.
AVP activates P0–P2 CA3 SLR interneurons via V1aRs. (A) Sample traces of whole-cell voltage-clamp recordings (Left) and mean normalized frequencies (Center and Right) of sIPSCs measured from CA3 pyramidal neurons before and during bath application of AVP (10 nM). AVP induced an increase in sIPSC frequency, which was significantly smaller in the presence of SR49059 (20 nM). (B) AVP concentration-response curve (1–50 nM) on normalized peak sIPSC frequency. (C) Whole-cell current-clamp recordings from visually identified hippocampal CA3 interneurons from P0–P2 VGAT-Venus transgenic rat slices before and during bath application of AVP (in the presence of iGluR block and picrotoxin). Sample traces of SLR interneurons in the absence (Top) and presence (Bottom) of SR49059 are shown. (D) Depolarization of interneurons from SLR (in the absence or presence of SR49059), SO, and SP upon application of AVP. (E, Left) Continuous quantification of the mean spike rate of SLR interneurons before and during bath application of AVP. (E, Right) Comparison of spike rates (control vs. peak effect of AVP) of interneurons from SLR (in the absence or presence of SR49059), SO, and SP before and during application of AVP. Data are presented as mean ± SEM, and n values are provided in the figure. Paired and independent t tests were used for statistical analysis. See Fig. S6 for additional data on SO and SP interneurons. (F and G) In situ hybridization with fluorescent probes against Gad1 and Gad2, V1aR, and V1bR mRNA transcripts in the CA3 region of the P0 rat hippocampus (n = 5 brains). (F1) Gad1/2 mRNA black puncta label interneurons in all layers. (F2) V1aR mRNA is predominantly expressed in the SLR. (F3) V1bR mRNA expression was not detected in the CA3 area. (F4) Merge of F1–3. (Scale bar: 50 μM.) (G) Confocal image taken from the SLR. V1aR mRNA (green) localizes to a Gad1/2-positive cell (red). (Scale bar: 10 μm.) DAPI (purple) was used for nuclear staining. A positive control of the V1bR mRNA probe is shown in Fig. S7.
Fig. 5.
Fig. 5.
AVP suppresses GDP-nested pyramidal neuron spiking by decreasing the synchronous GABAergic drive during network events. (A) Scheme of the triple-electrode recording from CA3 SP. CC, current clamp from a pyramidal neuron; VC, voltage clamp from a pyramidal neuron. (B) Sample traces before (Left) and during (Right) bath application of AVP (10 nM, n = 5 P0–P1 slices). LFP sample traces were filtered at 1–10 Hz. (C) Temporal distribution of pyramidal neuron spikes during GDPs (Left; control: 45 GDPs vs. AVP: 44 GDPs, bin size = 50 ms, the blue area indicates the 1-s time window from which the GDP-nested spikes were analyzed) and quantification of pyramidal neuron spike rates before and during application of AVP (Right). (D, Left) Mean normalized sIPSC burst total area before and during bath application of AVP. Mean normalized inter-GDP sIPSC frequency is shown for comparison. Data are shown as a moving average ± SEM. (D, Right) Bar diagram shows quantification of the effect of AVP. AVP significantly decreased the mean normalized sIPSC burst total area. Data are provided as mean ± SEM. A paired t test was used for statistical analysis.
Fig. 6.
Fig. 6.
AVP-mediated suppression of hippocampal network activity does not depend on the maturational level of neuronal Cl extrusion. (A1) Scheme for quantitative assessment of neuronal Cl extrusion capacity from CA3 pyramidal neurons under a fixed somatic Cl load imposed via the patch pipette. Flashes illustrate the site of UV photolysis of caged GABA. (A2 and A3) Whole-cell patch-clamp recordings of GABA uncaging-elicited currents (IGABA) in CA3 pyramidal neurons from P0 rat and P0 guinea pig with a somatically imposed Cl load. (A2) Sample EGABA recordings and corresponding current-voltage (I-V) curves at the soma and dendrite. Horizontal bars in the sample traces indicate the duration of the uncaging UV flash. (A3) Cl extrusion capacity of CA3 pyramidal neurons from P0 and P16 rats, as well as from E34 and P0 guinea pigs, quantified as the mean somatodendritic EGABA gradient. Some recordings were done in the presence of VU0463271 (10 μM), a specific KCC2 inhibitor. (B, Left) Western blot analysis of KCC2 expression in the hippocampus from the rat (P0 and P14) and guinea pig (E34 and P0). β-Tubulin was used as a loading control. (B, Right) Quantification of KCC2 protein levels. (C) LFP sample trace of P0 guinea pig CA3 SPW (filtered at 1–15 Hz). (D) LFP sample trace (Left, filtered at 1–15 Hz; magnification is shown in Insets) and quantification (Right) of the effect of AVP on SPW frequency, measured from the P0 guinea pig hippocampal CA3 region in the absence and presence of SR49059 (20–30 nM). (E) Effect of AVP on P0–P2 guinea pig sIPSC frequency. Sample traces of whole-cell voltage-clamp recordings (Left) and quantification of the mean increase in sIPSC frequency (Right) during bath application of AVP. Data are provided as mean ± SEM, and n values are provided in the figure. Paired and independent t tests were used for statistical analysis.

Similar articles

Cited by

References

    1. Hillman NH, Kallapur SG, Jobe AH. Physiology of transition from intrauterine to extrauterine life. Clin Perinatol. 2012;39:769–783. - PMC - PubMed
    1. Liu L, et al. Global, regional, and national causes of child mortality in 2000-13, with projections to inform post-2015 priorities: An updated systematic analysis. Lancet. 2015;385:430–440. - PubMed
    1. Ahearne CE, Boylan GB, Murray DM. Short and long term prognosis in perinatal asphyxia: An update. World J Clin Pediatr. 2016;5:67–74. - PMC - PubMed
    1. Kikkawa Y, Kaibara M, Motoyama EK, Orzalesi MM, Cook CD. Morphologic development of fetal rabbit lung and its acceleration with cortisol. Am J Pathol. 1971;64:423–442. - PMC - PubMed
    1. Motoyama EK, et al. Effect of cortisol on the maturation of fetal rabbit lungs. Pediatrics. 1971;48:547–555. - PubMed

Publication types

LinkOut - more resources