. 2017 Nov 28;8(1):1825.
doi: 10.1038/s41467-017-01946-x.

Cardiopatch platform enables maturation and scale-up of human pluripotent stem cell-derived engineered heart tissues

Affiliations

Cardiopatch platform enables maturation and scale-up of human pluripotent stem cell-derived engineered heart tissues

Ilya Y Shadrin et al. Nat Commun. .

Abstract

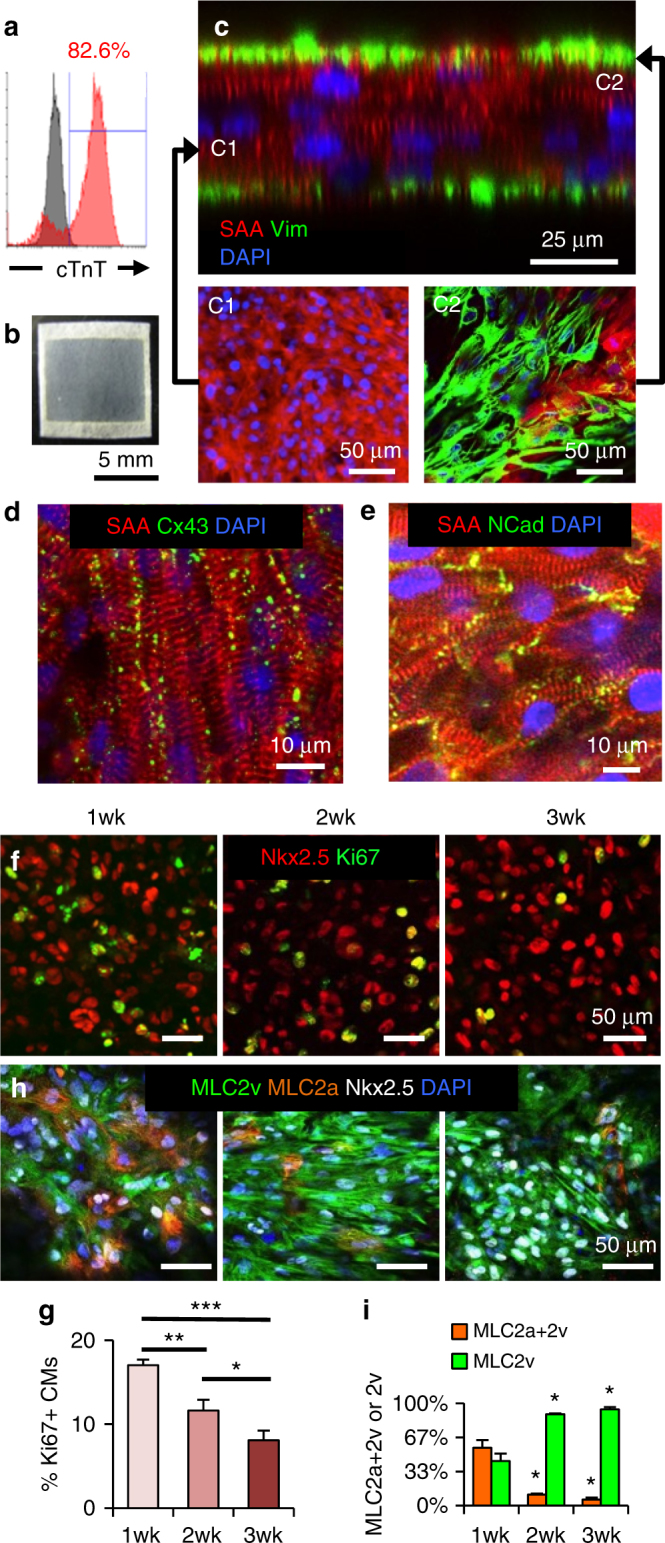
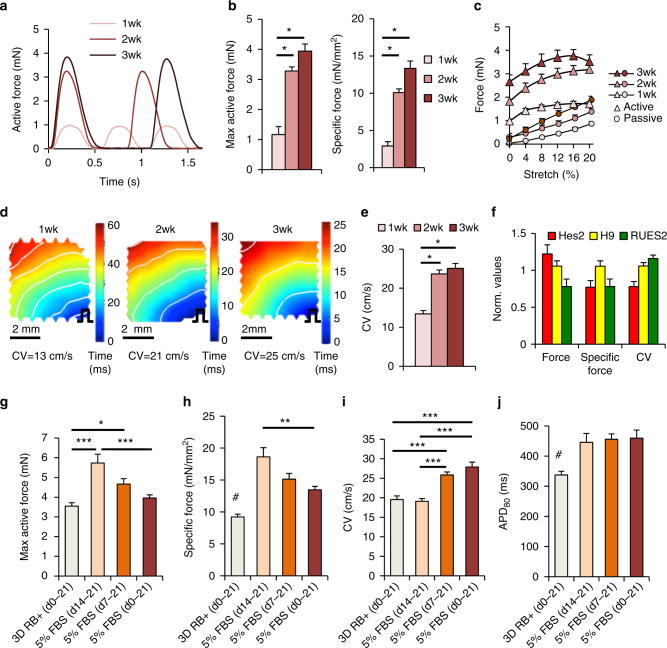
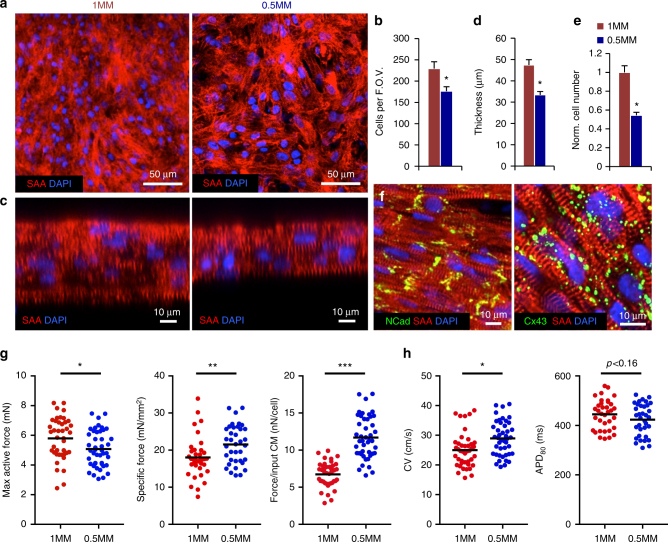
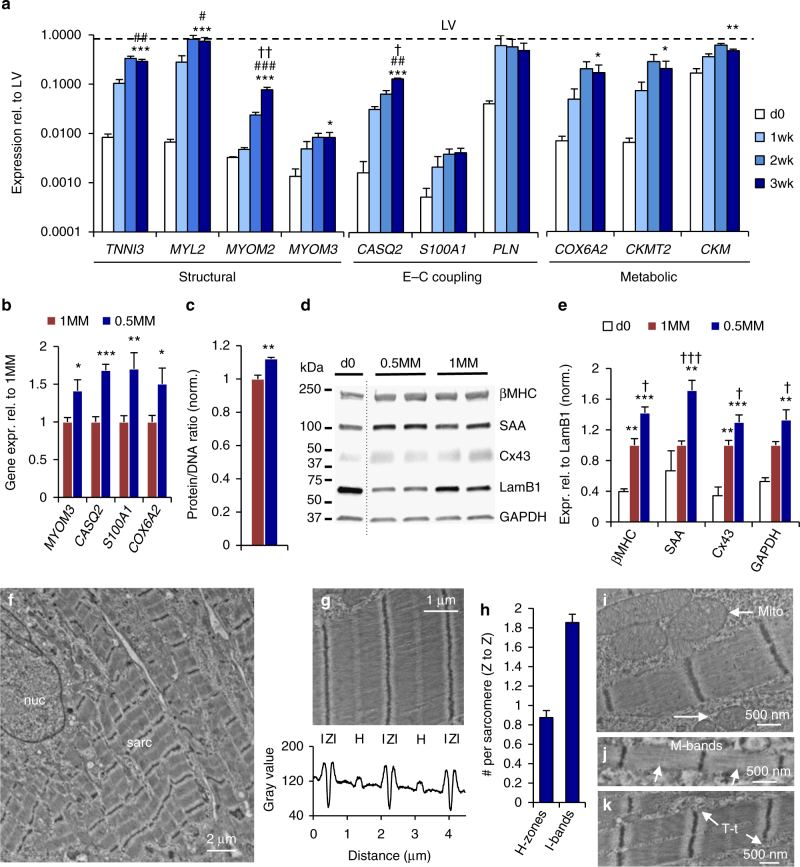
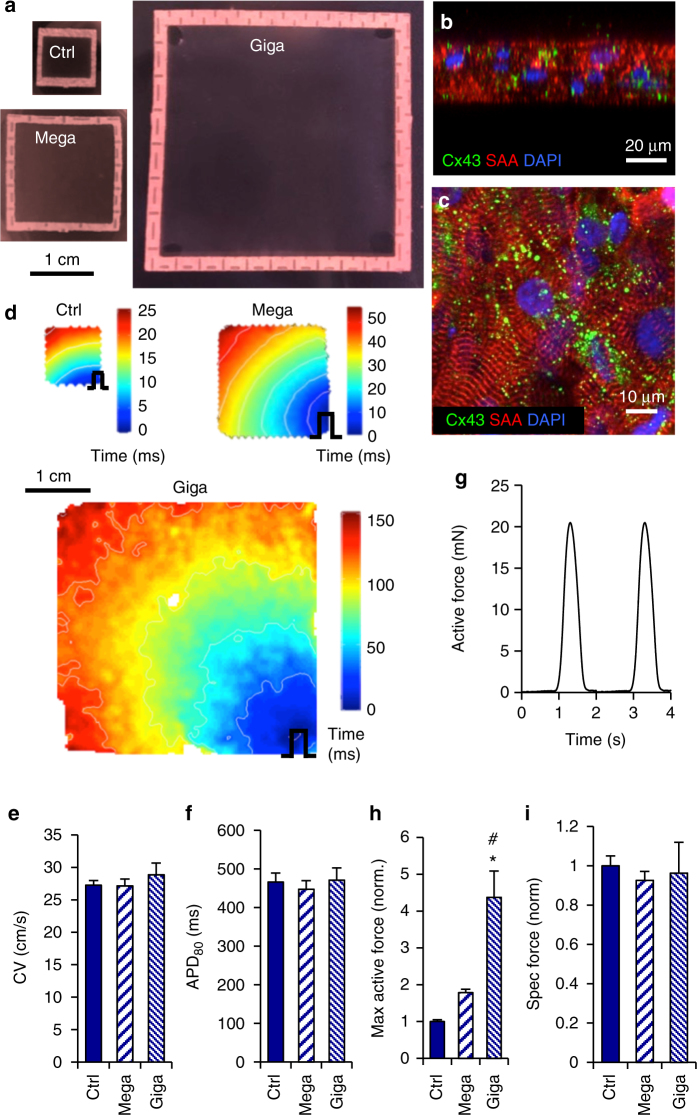
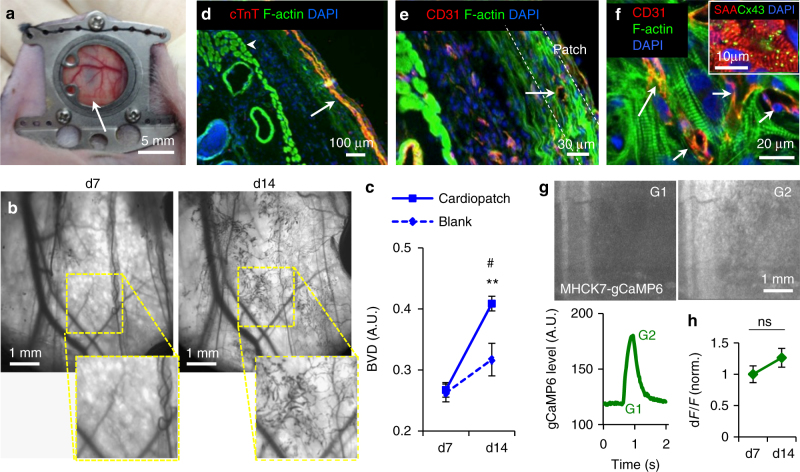
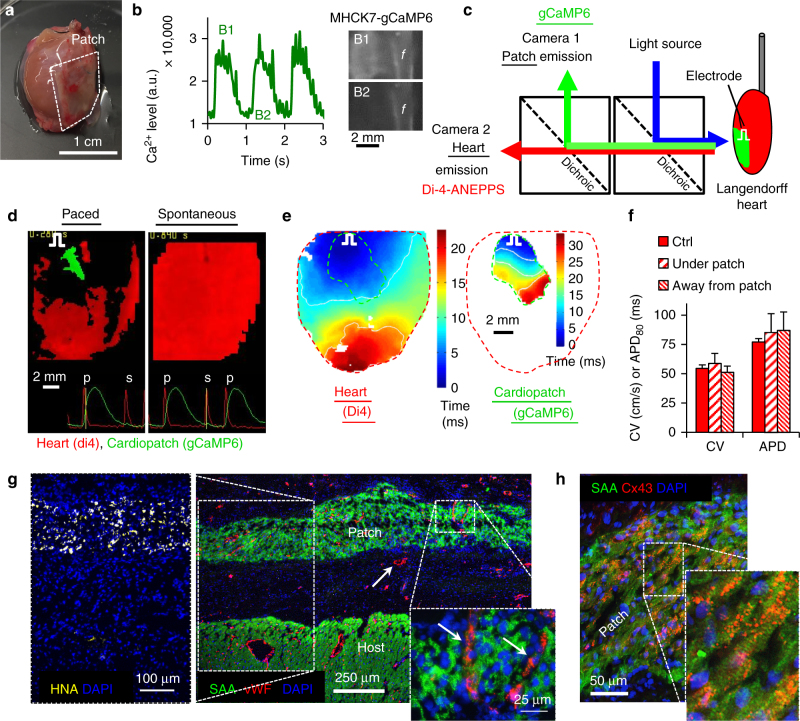
Despite increased use of human induced pluripotent stem cell-derived cardiomyocytes (hiPSC-CMs) for drug development and disease modeling studies, methods to generate large, functional heart tissues for human therapy are lacking. Here we present a "Cardiopatch" platform for 3D culture and maturation of hiPSC-CMs that after 5 weeks of differentiation show robust electromechanical coupling, consistent H-zones, I-bands, and evidence for T-tubules and M-bands. Cardiopatch maturation markers and functional output increase during culture, approaching values of adult myocardium. Cardiopatches can be scaled up to clinically relevant dimensions, while preserving spatially uniform properties with high conduction velocities and contractile stresses. Within window chambers in nude mice, cardiopatches undergo vascularization by host vessels and continue to fire Ca2+ transients. When implanted onto rat hearts, cardiopatches robustly engraft, maintain pre-implantation electrical function, and do not increase the incidence of arrhythmias. These studies provide enabling technology for future use of hiPSC-CM tissues in human heart repair.


Conflict of interest statement

The authors declare no competing financial interests.

Figures

Fig. 1
Fig. 1
Structural characterization and maturation of hiPSC-CM cardiopatches. a Representative flow cytometry histogram from hiPSC-CMs after 20 days of differentiation. b Photo of a 7 × 7 mm hiPSC-CM-derived tissue patch (human “cardiopatch”) surrounded by a Cerex® frame. c Representative cross-sectional confocal image of 3-week-old cardiopatch demonstrating several layers of densely packed sarcomeric α-actinin (SAA)+ hiPSC-CMs (C1) surrounded by a layer of vimentin (Vim)+ fibroblasts (C2). d, e Representative confocal images of connexin-43 (Cx43, d) and N-Cadherin (NCad, e) junctions in cardiopatch. f, g Representative confocal images (f) and quantification (g) of Ki67+/Nkx2.5+ CMs after 1, 2, and 3 weeks of cardiopatch culture; n = 8/11/12 patches (for 1/2/3 week) from four differentiations; *p = 0.037, **p = 0.0033, ***p < 0.0001, post-hoc Tukey’s test. h, i Relative fractions of myosin light chain 2v (ventricular) and 2a + 2v (atrial/early ventricular) positive hiPSC-CMs within cardiopatches cultured for 1–3 weeks; n = 7/5/4 patches (for 1/2/3 week) from four differentiations; *p = 0.0002 vs. 1 week, post-hoc Tukey’s test. Data are presented as mean ± SEM. Scale bars b 5 mm; c 25 µm (C1–C2, 50 µm); d, e 10 µm; fh 50 µm
Fig. 2
Fig. 2
Functional assessment and maturation of human cardiopatches. a Representative isometric contractile (active) force traces of spontaneously beating hiPSC-CM cardiopatches at 1, 2, and 3 weeks of culture. b Maximum active force (left) and specific force (right) of 1, 2, and 3-week-old cardiopatches; n = 6 patches from two differentiations; *p < 0.0001, post hoc Tukey’s test. c Active and passive force–length relationships of isometrically tested (1 Hz stimulation) cardiopatches at 1, 2, and 3 weeks of culture; same patches as in b. d, e Representative isochrone activation maps (d) and average conduction velocities (CV, e) during point stimulation from bottom right corner (pulse sign) of cardiopatches at 1, 2, and 3 weeks of culture; n = 7/7/9 patches (for 1/2/3 weeks) from two differentiations; *p < 0.0001, post hoc Tukey’s test. Scale bars d, 2 mm. f Average active force, specific force, and CV in cardiopatches obtained from three additional hESC lines (Hes2, H9, and RUES2) normalized to those made of hiPSC-CMs; n = 18/37/22 patches (for Hes2/H9/RUES2) from five to seven independent differentiations per line. g, h Maximum active force (g) and specific force (h) of cardiopatches cultured for 3 weeks in 3D RB + medium or 1, 2, and 3 weeks in 5% FBS medium; n = 15/14/13/14 patches (for 3D RB+/1/2/3 weeks in 5% FBS) from five differentiations; *p = 0.0026, **p = 0.0005, ***p < 0.0001, # p < 0.001 vs. all other groups, post hoc Tukey’s test. i, j CV (i) and action potential duration at 80% repolarization (APD80, j) in cardiopatches cultured for 3 weeks in 3D RB + medium or 1, 2, and 3 weeks in 5% FBS medium; n = 15/15/14/15 patches (for 3D RB+/1/2/3 weeks in 5% FBS) from five differentiations; ***p < 0.0001, # p < 0.002 vs. all other groups, post hoc Tukey’s test. Data are presented as mean ± SEM
Fig. 3
Fig. 3
Lowering density of hiPSC-CMs improves cardiopatch function. a Representative confocal images of 3-week-old cardiopatches generated from 1 million (1MM) and 0.5 million (0.5MM) hiPSC-CMs stained for SAA. Scale bar 50 µm. b Quantification of average number of cells per field of view in 0.5 and 1MM cardiopatches using a ×63 objective (2 µm slice); n = 13/16 patches (1/0.5MM) from seven differentiations, three to four random fields of view per patch; *p = 0.0083, unpaired t-test. c Representative optical cross-sections of 1MM and 0.5MM cardiopatches. Scale bar 10 µm. d Quantification of cardiopatch thickness made from 0.5 and 1MM cells; n = 22/25 patches (1/0.5MM) from 7/11 differentiations, average 2 thickness measurements per patch; *p < 0.0001, unpaired t-test. e Calculated cell numbers in cardiopatches (normalized to 1MM patch) based on average patch thickness and cells per field of view; n = 13/16 patches (1/0.5MM) from seven differentiations; *p < 0.001, unpaired t-test. f Representative confocal images of 3 week 0.5MM cardiopatches stained for Cx43, SAA and NCad. Scale bar 10 µm. g Maximum active force, specific force, and force per input hiPSC-CM in 1MM and 0.5MM cardiopatches; n = 36/35 patches (1/0.5MM) from 13 differentiations; *p = 0.047, **p = 0.0021, ***p < 0.0001, unpaired t-test. h Conduction velocity (CV) and action potential duration at 80% repolarization (APD80) of 1MM and 0.5MM cardiopatches; n = 42/44 patches (1/0.5MM) from 10 differentiations; **p = 0.0028, unpaired t-test. Data in b, d, and e presented as mean ± SEM, while dot plots in g and h show all data points along with mean value (black line)
Fig. 4
Fig. 4
Increased cell maturation and size in low-density cardiopatches. a Relative expression levels of 10 maturation genes in d0, 1 week, 2 week, and 3 week cardiopatches compared with those in adult human left ventricles (LV). Linear regression from d0 to 3 weeks: TNNI3, MYL2, MYOM2, CASQ2, p < 0.0001; MYOM3, CKMT2, p < 0.014; S100A1, COX6A2, CKM, p < 0.006; PLN, p = 0.1081. *p < 0.05, **p < 0.001, ***p < 0.0001 vs. d0; # p < 0.023, ## p < 0.0006, ### p < 0.0001 vs. 1 week; p < 0.037, †† p < 0.0037 vs. 2 week, via post hoc Tukey’s tests. For clarity, only 3-week statistical comparisons are shown. b Relative gene expression in 0.5MM vs. 1MM cardiopatches; *p < 0.041, **p < 0.0073, ***p < 0.0001, post hoc Tukey’s tests. c Protein/DNA ratio in 0.5MM vs. 1MM cardiopatches; n = 3/4 patches (1/0.5MM). d Representative western blots for myosin heavy chain-β (βMHC), SAA, lamin B1 (LamB1), GAPDH, and Cx43 in d0 cells and 3-week 0.5MM and 1MM cardiopatches; dotted line indicates lanes spliced from the same gel. e Quantified protein levels in d0 cells, 1MM and 0.5MM cardiopatches normalized to nuclear envelope protein LamB1, shown relative to 1MM cardiopatches; **p < 0.01, ***p < 0.001 vs. d0; p < 0.05, †† p < 0.01, ††† p < 0.001 vs. 1MM, post hoc Tukey’s tests. For gene expression studies (a, b), n = 6 patches from two differentiations; for protein studies (ce), n = 8/10 patches (1/0.5MM) from three to four differentiations. f Representative low-magnification view of cell nucleus (nuc) and surrounding sacromeric structures (sarc) in 3-week-old 0.5MM cardiopatches. Scale bar 2 µm. g Localization of I-bands, Z-discs, and H-zones within hiPSC-CM sarcomeres. Scale bar 1 µm. h Average number of H-zones and I-bands per sarcomere; n = 4 patches from two differentiations, data compiled from a total of 74 random fields of view. i Mitochondria (mito) were found positioned alongside CM myofibrils. Scale bar 500 nm. j, k Evidence of M-bands (j) and T-tubular-like structures (T-t, k) in 3-week-old 0.5MM cardiopatches. Scale bars 500 nm. All data are presented as mean ± SEM
Fig. 5
Fig. 5
Scale-up of cardiopatches without loss of function. a Representative images of control (ctrl, 7 × 7 mm), Mega (15 × 15 mm) and Giga (36 × 36 mm) cardiopatches at 3 weeks of culture. Scale bar 1 cm. b, c Representative confocal images of 3-week-old Giga cardiopatches stained for Cx43 and SAA, as seen in confocal cross-sections (b) or in the XY plane in the middle of the patch (c). Scale bars 20 µm (b), 10 µm (c). d Representative activation maps of ctrl, Mega, and Giga cardiopatches following point stimulation from bottom right corner (pulse sign). Giga patches were imaged by an EMCCD camera. Scale bar 1 cm. e Conduction velocity (CV) in 3-week-old ctrl, Mega and Giga cardiopatches; n = 11/6/7 patches (ctrl/Mega/Giga) from three to four differentiations; p = 0.56, one-way ANOVA. f Action potential duration at 80% repolarization (APD80) in 3-week-old ctrl, Mega and Giga cardiopatches; n = 11/6/5 patches (ctrl/Mega/Giga) from three to four differentiations; p = 0.52, one-way ANOVA. g Representative isometric force trace from spontaneously contracting 3-week-old Giga cardiopatch at 16% stretch. h, i Maximum active forces (h) and specific forces (i) in 3-week-old ctrl, Mega, and Giga cardiopatches shown relative to Ctrl cardiopatch; n = 10/6/10 patches (ctrl/Mega/Giga) from three to four differentiations; *p < 0.0001 vs. ctrl, # p < 0.01 vs. Mega, post hoc Tukey’s tests; (i) p = 0.76, one-way ANOVA. Data are presented as mean ± SEM
Fig. 6
Fig. 6
In vivo vascularization of cardiopatches. a Representative photograph of an implanted 3-week-old cardiopatch (arrow) in a dorsal skinfold window chamber of a nude mouse. b, c Intravital raw vascularization images (b) and quantification of blood vessel density (BVD, c) of cardiopatches on d7 and d14 post implantation relative to blank (Cerex® frame-only) controls; n = 18 mice (15 cardiopatches from 3 differentiations, 3 blank controls); repeated measures ANOVA: time F-ratio 34.8 (p < 0.0001), patch×time interaction effect F-ratio 6.81 (p < 0.02); for cardiopatch at d14: **p < 0.0001 vs. cardiopatch at d7, # p < 0.027 vs. blank at d14, post hoc Tukey’s tests. d, e Representative cross-sections of explanted cardiopatches after 2 weeks in vivo stained for F-actin, cTnT (d, arrow showing the cardiopatch) and CD31 (e, arrow showing a capillary lumen). f Representative en face image of cardiopatch explanted 2 weeks post implantation stained for F-actin and CD31 (arrows pointing to vessel lumens), and SAA and Cx43 (inset). g Representative fluorescence images and time trace of gCaMP6 signal during cardiopatch spontaneous activity 1 week after implantation; f, cardiopatch frame. h Ca2+ transient amplitude assessed as relative gCaMP6 fluorescence (dF/F) in cardiopatches at d7 and d14 following implantation; n = 12 patches from two differentiations; p = 0.2, paired t-test. Data are presented as mean ± SEM. Scale bars a 5 mm; b 1 mm; d 100 µm; e 30 µm; f 20 µm (inset 10 µm); g 1 mm
Fig. 7
Fig. 7
Epicardial implantation and ex vivo assessment of cardiopatches. a Representative image of cardiopatch 3 weeks following implantation onto nude rat epicardium; f, cardiopatch frame. b MHCK7-gCaMP6 flashes in implanted cardiopatches following direct stimulation by a platinum electrode; f, cardiopatch frame. c Schematic of a setup for dual optical mapping of gCaMP6-reported Ca2+ transients in implanted cardiopatches and Di-4-ANEPPS-reported transmembrane voltage in Langendorff-perfused rat hearts. d Representative snapshots from movies of Ca2+ transients in cardiopatches (green) and membrane voltage in the heart (red). Traces at the bottom show representative gCaMP6 (green) and Di-4 (red) signals from a single recording channel with yellow line denoting point in time corresponding to the instant of the movie snapshot. Pulse sign denotes location of stimulus electrode;p, paced; s, spontaneous. e Representative isochronal maps of action potential propagation during direct point electrode stimulation (pulse sign) of implanted cardiopatch (black dashed outline) and underlying rat myocardium (red dashed outline). f CV and APD of host epicardium optically recorded in control conditions (no patch), under implanted cardiopatch (under patch), and remote from implanted cardiopatch (away from patch); n = 6/3/3 (control/under/away). g, h Representative cross-sections of cardiopatch 3 weeks after implantation onto rat epicardium stained for SAA, von Willebrand Factor (vWF), and human nuclear antigen (HNA, h) and SAA and Cx43 (h). Data are presented as mean ± SEM. Scale bars a 1 cm; B1–2 2 mm; d, e 2 mm; g main: 250 µm, left inset: 100 µm, right inset: 25 µm; h 50 µm

References

    1. Lian X, et al. Robust cardiomyocyte differentiation from human pluripotent stem cells via temporal modulation of canonical Wnt signaling. Proc. Natl Acad. Sci. USA. 2012;109:E1848–1857. doi: 10.1073/pnas.1200250109. - DOI - PMC - PubMed
    1. Lian X, et al. Directed cardiomyocyte differentiation from human pluripotent stem cells by modulating Wnt/beta-catenin signaling under fully defined conditions. Nat. Protoc. 2012;8:162–175. doi: 10.1038/nprot.2012.150. - DOI - PMC - PubMed
    1. Burridge PW, et al. Chemically defined generation of human cardiomyocytes. Nat. Methods. 2014;11:855–860. doi: 10.1038/nmeth.2999. - DOI - PMC - PubMed
    1. Tohyama S, et al. Distinct metabolic flow enables large-scale purification of mouse and human pluripotent stem cell-derived cardiomyocytes. Cell Stem Cell. 2013;12:127–137. doi: 10.1016/j.stem.2012.09.013. - DOI - PubMed
    1. Ogle BM, et al. Distilling complexity to advance cardiac tissue engineering. Sci. Transl. Med. 2016;8:342ps313. doi: 10.1126/scitranslmed.aad2304. - DOI - PMC - PubMed

Publication types

MeSH terms