. 2017 Nov 28;7(1):16528.
doi: 10.1038/s41598-017-16466-3.

A simulation model of neuroprogenitor proliferation dynamics predicts age-related loss of hippocampal neurogenesis but not astrogenesis

Affiliations

A simulation model of neuroprogenitor proliferation dynamics predicts age-related loss of hippocampal neurogenesis but not astrogenesis

Sol Beccari et al. Sci Rep. .

Abstract

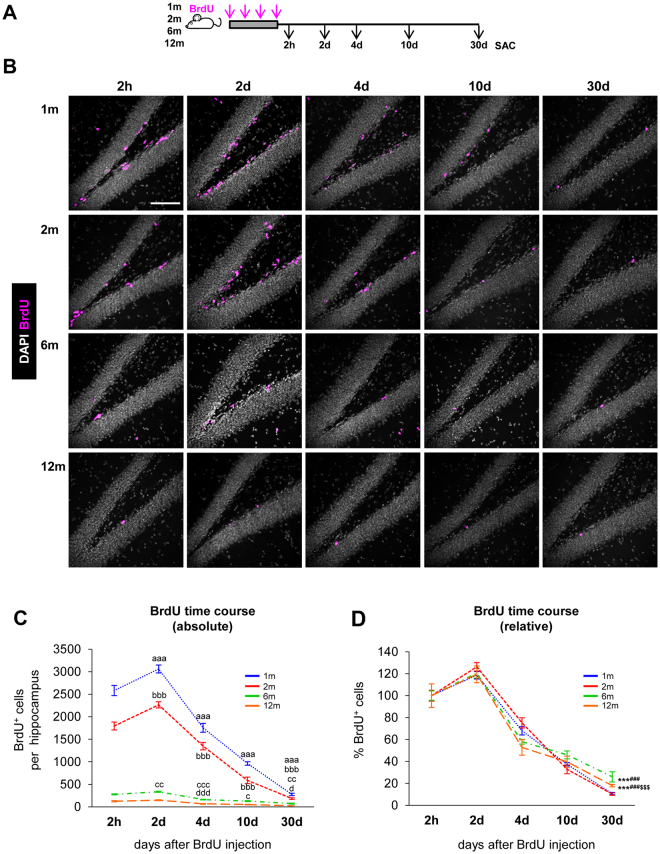
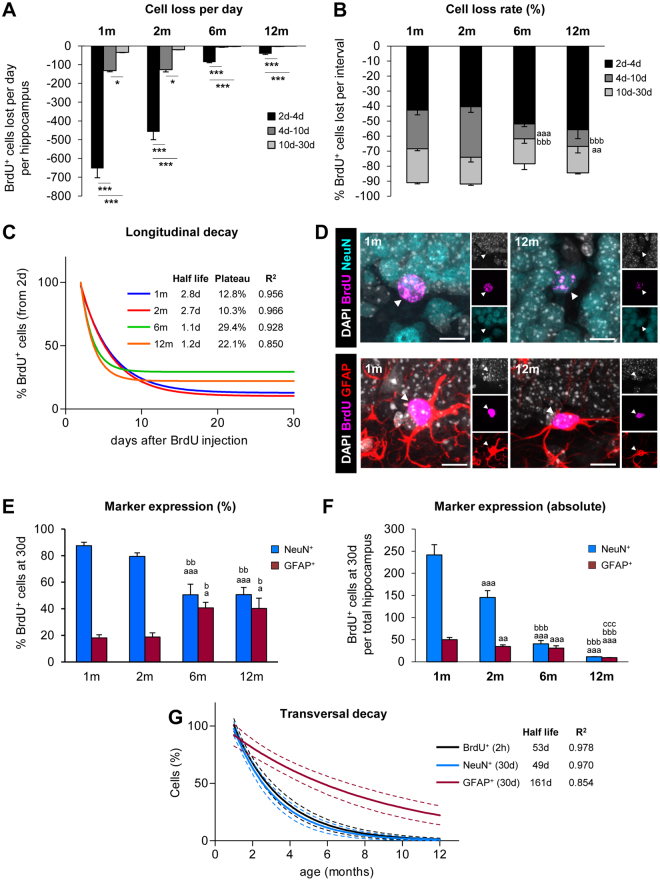
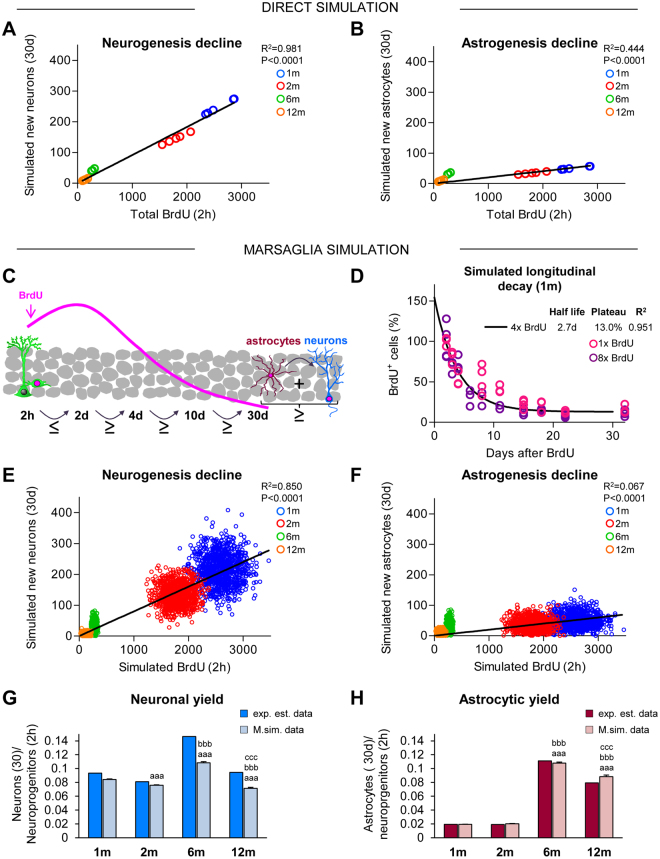
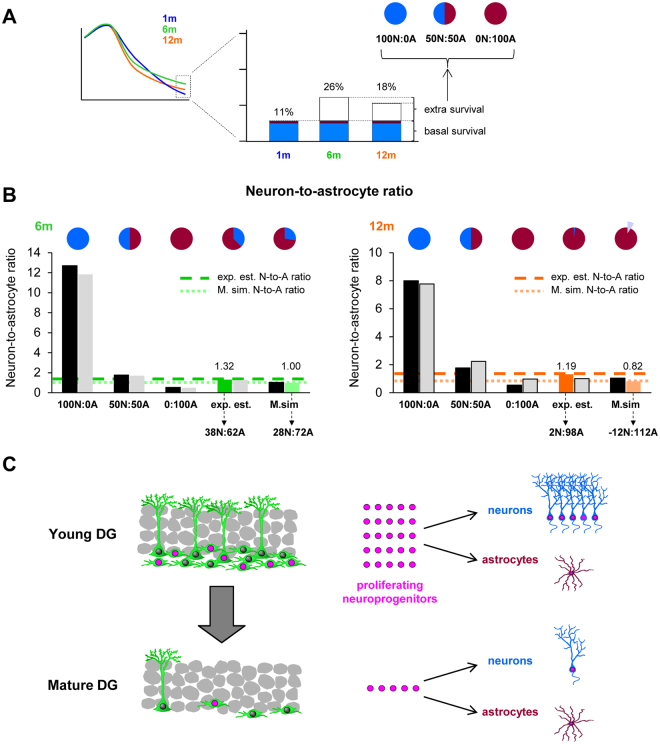
Adult hippocampal neuroprogenitors give rise to both neurons and astrocytes. As neuroprogenitors are lost with increased age, neurogenesis concomitantly decreases. However, the dynamics of neuron and astrocyte generation throughout adulthood has not been systematically examined. Here, we analyzed the hippocampal niche both longitudinally (from 2 h to 30d of cell life) and transversally (from 1 m to 12 m of age) and generated a Marsaglia polar random simulation model to predict newborn cell dynamics. The sharp decrease in newborn neuron production throughout adulthood was largely predicted by the number of proliferating neuroprogenitors at each age. In contrast, newborn astrocyte decay was slower and associated with their increased yield in mature mice. As a result, the niche shifted from neurogenic to neuro/astrogenic with increased age. Our data provide a simple "end-point" model to understand the hippocampal niche changes across adulthood and suggest yet unexplored functions of newborn astrocytes for the aging hippocampal circuitry.


Conflict of interest statement

The authors declare that they have no competing interests.

Figures

Figure 1
Figure 1
Age-related decline in hippocampal neurogenesis. (A) Experimental design used to analyze the neurogenic cascade in young (1 and 2 m) and mature (6 and 12 m) mice. Mice received an injection of BrdU every 2 h for 6 h (4x total) and were sacrificed (SAC) at different time points after the last injection. (B) Representative confocal z-stacks of the dentate gyrus (DG) of 1, 2, 6 and 12 m mice at 2 h, 2d, 4d, 10d, and 30d after the BrdU injections (magenta). DAPI staining indicates cell nuclei and the outline of the DG. Scale bar = 100 µm; z = 16.5 µm. (C) Absolute number of BrdU+ cells per hippocampus along the BrdU time course. N = 5 for 1mo and 2mo mice at 2 h, 2d, 4d, 10d, 30d; N = 4 for 6mo mice at 2 h, 2d, 4d, 10d, 30d; N = 7 for 12mo mice at 2 h, 2d, 4d and 10d, and N = 10 for 12mo mice at 30d. 2-way ANOVA (time after injection × age) showed a significant interaction between the two variables F(12, 88) = 122.982, p < 0.001. Thus 1-way ANOVA was used to analyze statistical differences due to the time after BrdU injection at each age: F(4, 20) = 199.587, p < 0.001 for 1 m; F(4,20) = 145.638, p < 0.001 for 2 m; F(4,15) = 97.491, p < 0.001 for 6 m; and F(4,33) = 43.665, p < 0.001 for 12 m. Holm-Sidak was used as a posthoc test. a, b, c and d represent significance compared to the prior time point for 1 m, 2 m, 6 m and 12 m mice, respectively. One symbol represents p < 0.05, two: p < 0.01, and three: p < 0.001. The number of BrdU+ cells in the septal hippocampus is shown in Fig. S2A. Raw data is shown in Table S1. (D) Percentage of BrdU+ cells per hippocampus. Absolute cell count was normalized to the number of BrdU+ cells found at 2 h. N as in Fig. 1C. 2-way ANOVA (time after injection × age) showed no significant interaction between the two variables: F(12, 88) = 1.463, p = 0.154; no significant effect of age: F(3,88) = 0.553, p = 0.647; and a significant effect of the time after injection: F(4,88) = 237.431, p < 0.001. While no overall effect of age was found, we analyzed statistical differences due to the age at each time point after the injection using 1-way ANOVA: F(3,17) = 0.33, p = 0.814 at 2d; F(3,17) = 3.329, P = 0.045 at 4d (although posthoc analysis by Holm-Sidak did not reveal any significant differences); F(3,17) = 1.364, p = 0.287 at 10d; F(3,20) = 91.088, p < 0.001 at 30d. Holm-Sidak was used as a posthoc test. The symbols indicate p < 0.01 between 2 m vs. 12 m; and *, #, $ represent p < 0.001 between 1 and 2 m vs. 6 m, 1 and 2 m vs. 12 m, and 6 m vs. 12 m, respectively. The percentage of BrdU+ cells in the septal hippocampus is shown in Fig. S2B. The percentage of BrdU+ cells expressing Ki67 at 2d is shown in Fig. S2C,D. N = 10 at 1 m, 2 m; N = 8 at 6 m; N = 14 at 12 m. Raw data is shown in Table S4. Points represent mean ± SEM.
Figure 2
Figure 2
Longitudinal and transversal decays of newborn cell populations. (A) Loss of BrdU+ cells per day, calculated as the total number of BrdU+ cells lost in the hippocampus during the periods 2d–4d, 4d–10d, and 10d–30d. N per group as in Fig. 1C. The effect of age in the loss of BrdU+ cells per period was analyzed using 1-way ANOVA: F(2,12) = 134.198, p < 0.001 at 1 m; F(2, 12) = 83.114, p < 0.001 at 2 m; F(2,9) = 553.774, p < 0.001 at 6 m; F(2, 21) = 94.635, p < 0.001. Holm-Sidak was used as a posthoc test.*, ** and *** indicate p < 0.05, p < 0.01 and p < 0.001 between periods for each age, respectively. (B) Cell loss rate of BrdU+ cells, calculated as the percentage of BrdU+ cells lost from the number of BrdU+ cells at 2d at each interval in the hippocampus. N per group as in Fig. 1C. The effect of the period in the loss of BrdU+ cells at each age was analyzed using 1-way ANOVA: F(3,17) = 2.593, p = 0.086 at 2d–4d; F(3,17) = 10.098, p < 0.001 at 4d–10d; F(3,20) = 2.66, p = 0.076 at 10–30d. Holm-Sidak was used as a posthoc test. a, b, and c represent significance respect to 1 m, 2 m, and 6 m, respectively. Two symbols are used for p < 0.01 and three for p < 0.001. Bars represent mean ± SEM. (C) Longitudinal decay of BrdU+ cells over the time course (2d–30d), calculated as an exponential curve with plateau. Fitting curve, cell half-life, survival plateau (%), and R2 are indicated (further data is shown in Table S7). The longitudinal decay of 1 m mice in 1x BrdU, 4x BrdU, and 8x BrdU paradigms is shown in Fig. S2E. (D) Representative confocal z-stacks of the DG of 1 and 12 m mice at 30d after the BrdU injections. BrdU+ cells (magenta) were co-labeled with the mature neuronal marker NeuN (in cyan) or the astrocyte marker GFAP (in red). DAPI staining indicated cell nuclei (in white). Scale bars = 10 µm; z = 14 µm. (E) Expression of NeuN and GFAP in the BrdU+ cells at 30d (in %). N = 4 at 1 m and 2 m, N = 6 at 6 m, and N = 5 at 12 m for % NeuN+ cells. N = 9 at 1 m and 2 m, N = 10 at 6 m, and N = 20 at 12 m for % GFAP+ cells.1-way ANOVA analysis was F(3,15) = 10.913, p < 0.001 for % NeuN+ cells and F(3,44) = 4.18, p = 0.011 for % GFAP+ cells. Holm-Sidak was used as a posthoc test. a, b, and c represent significance respect to 1 m, 2 m, and 6 m, respectively. Two symbols are used to represent p < 0.01 and three for p < 0.001. Bars represent mean ± SEM. Raw data is shown in Tables S2 and S3. (F) Absolute number of newborn neurons (BrdU+, NeuN+) and astrocytes (BrdU+, GFAP+) at 30d in the hippocampus. N = 5 at 1 m and 2 m, N = 4 at 6 m, and N = 15 at 12 m for % NeuN+ BrdU+ cells; N = 5 at 1 m and 2 m, N = 4 at 6 m, and N = 15 at 12 m for GFAP+, BrdU+ cells.1-way ANOVA analysis was F (3,25) = 115.154, p < 0.001 for NeuN+, BrdU+ cells and F(3,25) = 53.589, p < 0.001 or GFAP+, BrdU+ cells. a, b, and c represent significance respect to 1 m, 2 m, and 6 m, respectively. Two symbols are used to represent p < 0.01 and three for p < 0.001. Bars represent mean ± SEM. (G) Transversal decay of BrdU+ (2 h), BrdU+ NeuN+ (30d) and BrdU+ GFAP+ (30d), is best fitted with an exponential curve. Fitting curve, cell half-life, and R2 are indicated (further data is shown in Table S7). The transversal decay of human neuroblasts labeled with doublecortin is shown in Fig. S2F,G. N per group as in Fig. 2F.
Figure 3
Figure 3
Neurogenesis but not astrogenesis decline is due to the disappearance of proliferating neuroprogenitors. (A,B) Linear regression of the number of newborn neurons (A) and astrocytes (B) at 30d generated from proliferating progenitors at 2 h across adulthood. Estimated number of BrdU+ cells at 2 h (Fig. 1C) were correlated with the simulated number of BrdU+ NeuN+ or BrdU+ GFAP+ cells at 30d, calculated from the estimated survival and differentiation rates (Figs 1D and 2E, respectively). Each dot represents an individual value. The linear regression curve, R2, and p-value are shown (further data is shown in Table S8). N per group as in Fig. 2F. (C) Cartoon representing the Marsaglia simulation model restrictions based on Figs 1 and 2. In the model, the number of simulated BrdU+ cells at 2d must be equal or larger than at 2 h. After 2d, each time point should have the same or fewer BrdU+ cells. At the end of the 30d period, the sum of newborn astrocytes and neurons should be equal or smaller than the total BrdU+ cells at 30d. A comparison between the experimentally estimated and the Marsaglia simulated data is shown in Table S6. (D) Longitudinal decay of 1 m simulated BrdU+ cells over the time course (2d–30d), calculated as an exponential curve with plateau. Fitting curve, cell half-life, survival plateau (%), and R2 are indicated (further data is shown in Table S7). Individual dots represent two independent sets of BrdU data from single (1x BrdU) and cumulative (8x BrdU) injection paradigms. N = 3 for 2dp, 3dp, 4dp, 11dp, 18dp and 32dp and N = 4dp, 8dp, 15dp, 22dp in 1x BrdU; N = 3 for 6dp, 8dp, 11dp, 15dp, 22dp, and 32dp and N = 4 for 2dp, 4dp, 18dp for 8x BrdU. (E,F) Linear regression analysis of the simulated number of newborn neurons (E) and astrocytes (F) at 30d, generated from the proliferating progenitors at 2 h across adulthood using the Marsaglia polar simulation model. Pseudorandom simulated numbers of BrdU+ cells at 2 h and BrdU+ NeuN+ or BrdU+ GFAP+ cells at 30d were obtained using the mean and standard deviation values (Figs 1C,D and 2E, Table S6). 1,000 pseudorandom cells per age group for each population were generated. Each dot represents an individual value. The linear regression curve, R2, and p-value are shown (further data is shown in Table S8). (G,H) Neuronal (G) and astrocytic (H) yield of proliferating neuroprecursors derived from the experimentally estimated and the Marsaglia simulated data. Kruskal-Wallis analysis was H(3) = 425.9, p < 0.001 for neuronal yield, and H(3) = 2367, p < 0.001 for astrocitic yield. a, b, and c represent significance compared to 1 m, 2 m, and 6 m, respectively (p < 0.05) for Marsaglia simulated data. Two symbols are used to represent p < 0.01 and three for p < 0.001. Bars represent mean ± SEM. Further data is shown in Table S11.
Figure 4
Figure 4
Hippocampal neuroprogenitors produce differential neurogenic and astrogenic outputs throughout adulthood. (A) Cartoon represents the strategy used to create different scenarios of newborn neuronal and astrocyte survival (100:0, 50:50, and 0:100%) to account for the increased (extra-) survival found at 6 m and 12 m compared to 1 m. (B) Neuron-to-astrocyte ratio from experimentally estimated and the Marsaglia simulated data in 6 and 12 m mice was calculated for each of the scenarios of neuronal and astrocyte survival (100:0, 50:50, and 0:100% of the extra survival). Optimal proportions that allowed reaching the target ratios for the experimentally estimated and the Marsaglia simulated data are drawn on the top. At 12 m, the target ratio from the Marsaglia simulated data could only be reached with negative contributions of neurons (represented by a light purple pie slice). Further data is shown in Table S12. (C) Proposed model to explain the major effect of age on the neuroprogenitor population and newborn neuronal and astrocytic yields. The number of cells and dots shown are roughly proportional to the data from 1 m and 12 m mice (young and mature DG, respectively) shown in Figs 1 and 2.

References

    1. Kuhn HG, Dickinson-Anson H, Gage FH. Neurogenesis in the dentate gyrus of the adult rat: age-related decrease of neuronal progenitor proliferation. J Neurosci. 1996;16:2027–2033. - PMC - PubMed
    1. Kempermann G, Kuhn HG, Gage FH. Experience-induced neurogenesis in the senescent dentate gyrus. J Neurosci. 1998;18:3206–3212. - PMC - PubMed
    1. Amrein I, Slomianka L. Poletaeva, II, Bologova, N. V. & Lipp, H. P. Marked species and age-dependent differences in cell proliferation and neurogenesis in the hippocampus of wild-living rodents. Hippocampus. 2004;14:1000–1010. doi: 10.1002/hipo.20018. - DOI - PubMed
    1. Manganas LN, et al. Magnetic resonance spectroscopy identifies neural progenitor cells in the live human brain. Science. 2007;318:980–985. doi: 10.1126/science.1147851. - DOI - PMC - PubMed
    1. Knoth R, et al. Murine features of neurogenesis in the human hippocampus across the lifespan from 0 to 100 years. PLoS One. 2010;5:e8809. doi: 10.1371/journal.pone.0008809. - DOI - PMC - PubMed

Publication types

MeSH terms