. 2017 Nov 14:11:226.
doi: 10.3389/fnbeh.2017.00226. eCollection 2017.

The Role of Celestial Compass Information in Cataglyphis Ants during Learning Walks and for Neuroplasticity in the Central Complex and Mushroom Bodies

Affiliations

The Role of Celestial Compass Information in Cataglyphis Ants during Learning Walks and for Neuroplasticity in the Central Complex and Mushroom Bodies

Robin Grob et al. Front Behav Neurosci. .

Abstract

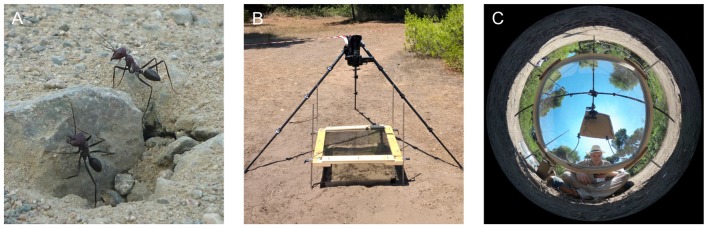
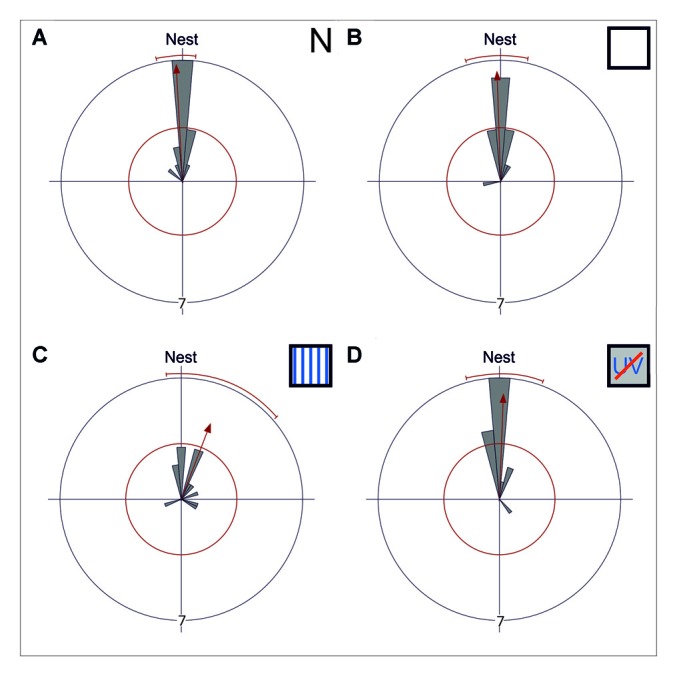
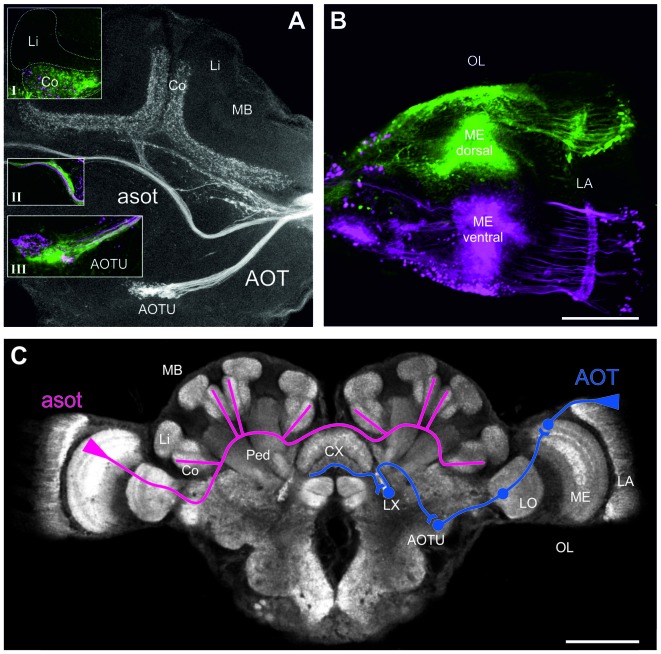
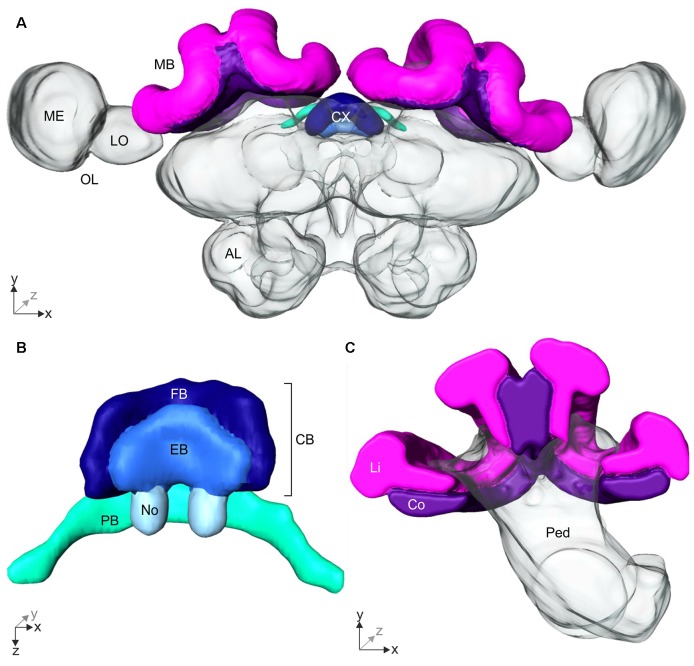
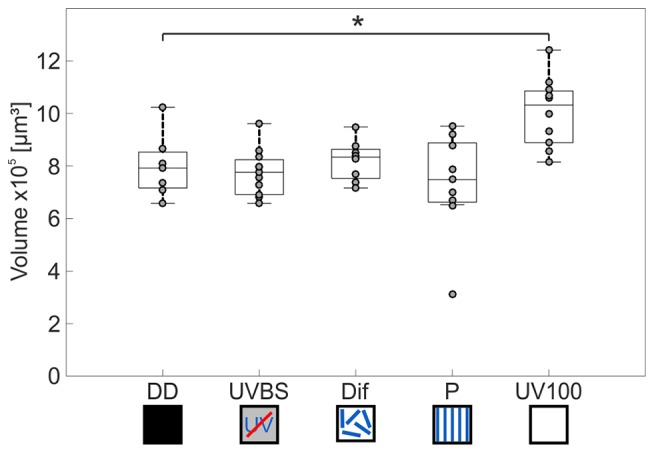
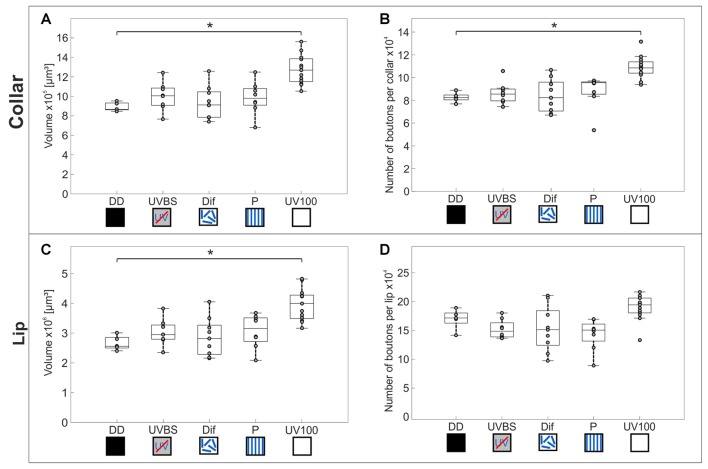
Central place foragers are faced with the challenge to learn the position of their nest entrance in its surroundings, in order to find their way back home every time they go out to search for food. To acquire navigational information at the beginning of their foraging career, Cataglyphis noda performs learning walks during the transition from interior worker to forager. These small loops around the nest entrance are repeatedly interrupted by strikingly accurate back turns during which the ants stop and precisely gaze back to the nest entrance-presumably to learn the landmark panorama of the nest surroundings. However, as at this point the complete navigational toolkit is not yet available, the ants are in need of a reference system for the compass component of the path integrator to align their nest entrance-directed gazes. In order to find this directional reference system, we systematically manipulated the skylight information received by ants during learning walks in their natural habitat, as it has been previously suggested that the celestial compass, as part of the path integrator, might provide such a reference system. High-speed video analyses of distinct learning walk elements revealed that even exclusion from the skylight polarization pattern, UV-light spectrum and the position of the sun did not alter the accuracy of the look back to the nest behavior. We therefore conclude that C. noda uses a different reference system to initially align their gaze directions. However, a comparison of neuroanatomical changes in the central complex and the mushroom bodies before and after learning walks revealed that exposure to UV light together with a naturally changing polarization pattern was essential to induce neuroplasticity in these high-order sensory integration centers of the ant brain. This suggests a crucial role of celestial information, in particular a changing polarization pattern, in initially calibrating the celestial compass system.

Keywords: central complex; desert ants; look-back behavior; memory; mushroom body; sky-compass pathway; vector navigation; visual orientation.


Figures

Figure 1
Figure 1
Experimental setup for skylight manipulation experiments. (A) Unmarked C. noda ants at the nest entrance. (B) 30 cm above the nest entrance, a filter was placed in order to alter the skylight information. Learning walks were recorded with a high-speed 4K-camera. In addition, a HD-camcorder recorded the nest entrance for the whole day. (C) Panoramic image of the UV-block with sunshade setup (UVBS). The observer was located in the south to trigger the high-speed recording and to prevent unmarked ants from leaving the area covered by the filter through the opening in the fence, which was located in the south-west.
Figure 2
Figure 2
Gaze directions during the longest stopping phases under different skylight conditions. Data are shown in gray and the corresponding statistics in red. The bins of the circular histogram include 10 degrees. The red circle indicates the critical value α = 0.05 of the Rayleigh uniformity test. The red arrow indicates the r-vector pointing towards the mean direction. If the length of the vector exceeds the red circle the data is directed (p < 0.05). When the data is directed, a red line indicates the 95% confidence interval. If the expected direction (Nest ≙ 180°) lies within the confidence intervals limits, the data is directed towards the nest entrance. The outer circle indicates tic 7. Each data point is contributed by one back turn of one ant. (A) The mean gaze direction of the longest stopping phase in pirouettes during learning walks under natural/no filter conditions (N) is directed towards the nest entrance (n = 15). (B) The same is true for the mean gaze direction of the longest stopping phase under control conditions (UV100; n = 15) and (C) under an artificial, fixed polarization pattern (P; n = 14). (D) Even when excluded from all celestial information (UVBS; n = 15) the ants were able to gaze towards the nest entrance during the longest stopping phases. The mean angle and the angular variance did not differ between the four groups. For statistical details see text.
Figure 3
Figure 3
Neuronal projections from the medualla (ME) via the anterior optical tract (AOT) and the anterior superior optic tract (asot) in the Cataglyphis noda brain. Anterograde tracings from focal dye injections the dorsal and ventral medulla (ME; microruby in magenta, Alexa 488 dextran in green, see under B): (A) Axon bundles from projection neurons in the medulla run anterior above the peduncle (Ped) and the central complex (CX) into the visual subregion of the mushroom body (MB) collar (Co) on both sides of the brain. Axonal projections from both the dorsal and the ventral ME run along the asot (inset II) into the Co. The most prominent input in the MB-calyx Co was found in injections into the dorsal ME (green) compared to those in the ventral ME (magenta) (inset I). Axonal projection from the ME also run into the anterior optical tubercle (AOTU) along the AOT. Z-projection from a stack of 27 images, 10x objective, 5 μm step size. Insets were taken with a 20x objective, 5 μm step size. (B) In the dorsal ME Dextran AlexaFloun488 (green) was injected using a glass capillary. In the ventral ME Dextran Tetramethylrhodamine (micro-Ruby) (magenta) was injected using a glass capillary. Images taken with a 10x objective, step size of 10 μm, stack of 19 images, zoom 2.65. The scale bar in (B), also valid for (A), is 100 μm. (C) Schematic depiction of the tracing of the asot (magenta) and the AOT (blue). The asot, as seen in the tracings in (A), runs from the ME anterior above the peduncle and the CX into Co. The AOT (information combined with the one from Schmitt et al., 2016) runs from the dorsal rim of the lamina (LA) to the dorsal rim of the ME, and from there via the LO to the AOTU to be relayed further to the lateral complex (LX). The anterior CX pathway terminates in the lower half of the ellipsoid body (EB) of the CX (Schmitt et al., 2016). The confocal scan of the C. noda brain shows an anti-synapsin labeled brain, similar to the staining procedure used for the neuroanatomical analyses. The scale bar is 200 μm.
Figure 4
Figure 4
3D-reconstruction of the Cataglyphis noda brain. With the 3D-reconstruction software Amira the neuropils of the C. noda brain were manually reconstructed from the image stack obtained by the confocal laser scanning microscope. (A) 3D-reconstruction of a whole C. noda brain. To analyze the influence of celestial information during learning walks on neuroplasticity, the terminal stages of two visual pathways were reconstructed. The AOT transfers visual information, including polarization information, into the central complex (CX, shades of blue). The CX is located at the midline of the ant brain. Via the asot visual information is transferred to the mushroom body calyces (MB, magenta). Additionally, antennal lobes (AL), and optical lobes (OL) with the medulla (ME) and lobula (LO) are labeled. (B) The CX comprises several neuropils: The central body (CB, dark and light blue) is located most anterior. It consists of the large fan-shaped body (FB, dark blue) and the smaller ellipsoid body (EB, light blue), which is covered by the FB dorsally. Behind the CB, two globular neuropils, the noduli (No, pale blue) are located. Dorsally to that and slightly detached from the CB, the protocerebral bridge (PB, green) spans in a bridge-like shape between the mushroom bodies (MB). (C) The MB calyx includes the visual input region, the collar (Co, violet) and the olfactory input region, the lip (Li, magenta). They are located at the dorsal rim of the peduncle (Ped). Scale bars, (A) 200 μm; (B,C) 100 μm.
Figure 5
Figure 5
Volume changes of the CX after 3 days of learning walks dependent on celestial information. The central line of each boxplot depicts the median of the data. The upper and lower limits of the boxes show the 25th and 75th percentiles, while the whiskers extend to the extreme data points without outliers. All data points (including outliers) are plotted as gray circles. A difference between the groups can be found using a Kruskal–Wallis test. With the Mann-Whitney U-test with a Bonferroni correction the data was post hoc compared to the DD group. The asterisk indicates that data is significantly different (after correction p < 0.0125) from the DD group. The central complex shows a volume increase compared to interior workers (DD; n = 7) only if the ants perceived the UV mediated natural polarization pattern that changes over the day (UV100; n = 10). If the polarization pattern was altered, either by diffusion (Dif; n = 8) or by a linear polarization filter (P; n = 9), no change in the volume of the CX occurred compared to DD. Similarly, when ants were excluded from any celestial information (UVBS; n = 11), no volume increase occurred. For statistical details and further explanations, see text.
Figure 6
Figure 6
Volume changes and changes in numbers of synaptic complexes in MB calyx subdivisions. The central line of each boxplot depicts the median of the data. The upper and lower limits of the boxes show the 25th and 75th percentiles, while the whiskers extend to the extreme data points without outliners. All data points (including outliers) are plotted as gray circles. To find a difference between the groups, a Kruskal–Wallis test was used (α = 0.05). With the Mann-Whitney U-test with a Bonferroni correction the data was post hoc compared to the DD group if the Kruskal–Wallis test indicated a difference. The asterisk indicates data significantly different (after correction p < 0.0125) from the DD group. (A) In the MB-calyx Co, a significant volume increase compared to DD (n = 5) occurred only when the learning walks were conducted under the natural UV mediated changing polarization pattern (UV100; n = 13). (B) Similarly, the total number of synaptic boutons per calyx in the Co only increased when the learning walks were performed under UV100 compared to DD. (C) In the MB-calyx Li, a volume increase occurred only under UV100 conditions compared to DD, similar to the conditions in the Co. (D) However, in the Li no change in the total number of synaptic boutons per calyx occurred under any conditions. No significant differences in the MB occurred between DD and UVBS (n = 8), Dif (n = 9), or P (n = 8). For statistical details and further explanations, see text.

Similar articles

Cited by

References

    1. Anderson J. B., Vander Meer R. K. (1993). Magnetic orientation in the fire ant, Solenopsis invicta. Naturwissenschaften 80, 568–570. 10.1007/bf01149274 - DOI
    1. Ardin P., Mangan M., Wystrach A., Webb B. (2015). How variation in head pitch could affect image matching algorithms for ant navigation. J. Comp. Physiol. A Neuroethol. Sens. Neural Behav. Physiol. 201, 585–597. 10.1007/s00359-015-1005-8 - DOI - PMC - PubMed
    1. Banks A. N., Srygley R. B. (2003). Orientation by magnetic field in leaf-cutter ants, Atta colombica (Hymenoptera: Formicidae). Ethology 109, 835–846. 10.1046/j.0179-1613.2003.00927.x - DOI
    1. Barth M., Heisenberg M. (1997). Vision affects mushroom bodies and central complex in Drosophila melanogaster. Learn. Mem. 4, 219–229. 10.1101/lm.4.2.219 - DOI - PubMed
    1. Buehlmann C., Graham P., Hansson B. S., Knaden M. (2014). Desert ants locate food by combining high sensitivity to food odors with extensive crosswind runs. Curr. Biol. 24, 960–964. 10.1016/j.cub.2014.02.056 - DOI - PubMed

LinkOut - more resources