

Functional Brain Imaging Synthesis Based on Image Decomposition and Kernel Modeling: Application to Neurodegenerative Diseases
- PMID: 29184492
- PMCID: PMC5694626
- DOI: 10.3389/fninf.2017.00065
Functional Brain Imaging Synthesis Based on Image Decomposition and Kernel Modeling: Application to Neurodegenerative Diseases
Abstract
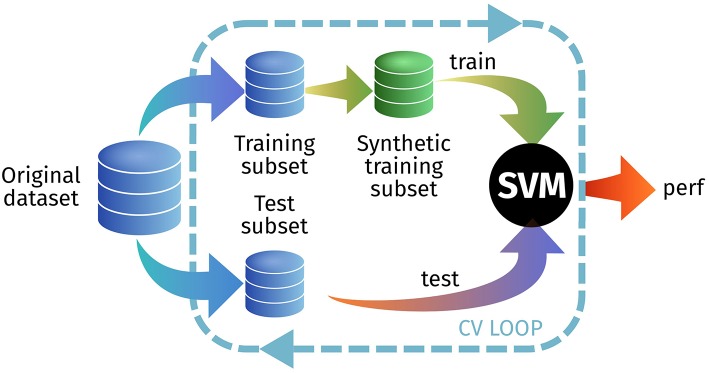
The rise of neuroimaging in research and clinical practice, together with the development of new machine learning techniques has strongly encouraged the Computer Aided Diagnosis (CAD) of different diseases and disorders. However, these algorithms are often tested in proprietary datasets to which the access is limited and, therefore, a direct comparison between CAD procedures is not possible. Furthermore, the sample size is often small for developing accurate machine learning methods. Multi-center initiatives are currently a very useful, although limited, tool in the recruitment of large populations and standardization of CAD evaluation. Conversely, we propose a brain image synthesis procedure intended to generate a new image set that share characteristics with an original one. Our system focuses on nuclear imaging modalities such as PET or SPECT brain images. We analyze the dataset by applying PCA to the original dataset, and then model the distribution of samples in the projected eigenbrain space using a Probability Density Function (PDF) estimator. Once the model has been built, we can generate new coordinates on the eigenbrain space belonging to the same class, which can be then projected back to the image space. The system has been evaluated on different functional neuroimaging datasets assessing the: resemblance of the synthetic images with the original ones, the differences between them, their generalization ability and the independence of the synthetic dataset with respect to the original. The synthetic images maintain the differences between groups found at the original dataset, with no significant differences when comparing them to real-world samples. Furthermore, they featured a similar performance and generalization capability to that of the original dataset. These results prove that these images are suitable for standardizing the evaluation of CAD pipelines, and providing data augmentation in machine learning systems -e.g. in deep learning-, or even to train future professionals at medical school.
Keywords: Alzheimer's Disease (AD); Neuroimaging; Parkinson's Disease (PD); Synthesis; data augmentation; density estimation; evaluation; validation.
Figures


Similar articles
-
Three-Dimensional Eigenbrain for the Detection of Subjects and Brain Regions Related with Alzheimer's Disease.J Alzheimers Dis. 2016;50(4):1163-79. doi: 10.3233/JAD-150988. J Alzheimers Dis. 2016. PMID: 26836190
-
Deep learning based pipelines for Alzheimer's disease diagnosis: A comparative study and a novel deep-ensemble method.Comput Biol Med. 2022 Feb;141:105032. doi: 10.1016/j.compbiomed.2021.105032. Epub 2021 Nov 21. Comput Biol Med. 2022. PMID: 34838263
-
Detection of subjects and brain regions related to Alzheimer's disease using 3D MRI scans based on eigenbrain and machine learning.Front Comput Neurosci. 2015 Jun 2;9:66. doi: 10.3389/fncom.2015.00066. eCollection 2015. Front Comput Neurosci. 2015. PMID: 26082713 Free PMC article.
-
Deep Learning and Machine Learning Algorithms for Retinal Image Analysis in Neurodegenerative Disease: Systematic Review of Datasets and Models.Transl Vis Sci Technol. 2024 Feb 1;13(2):16. doi: 10.1167/tvst.13.2.16. Transl Vis Sci Technol. 2024. PMID: 38381447 Free PMC article.
-
Deep Learning in Large and Multi-Site Structural Brain MR Imaging Datasets.Front Neuroinform. 2022 Jan 20;15:805669. doi: 10.3389/fninf.2021.805669. eCollection 2021. Front Neuroinform. 2022. PMID: 35126080 Free PMC article. Review.
Cited by
-
Transfer Learning for Alzheimer's Disease through Neuroimaging Biomarkers: A Systematic Review.Sensors (Basel). 2021 Oct 31;21(21):7259. doi: 10.3390/s21217259. Sensors (Basel). 2021. PMID: 34770565 Free PMC article.
-
Deep learning in medical imaging and radiation therapy.Med Phys. 2019 Jan;46(1):e1-e36. doi: 10.1002/mp.13264. Epub 2018 Nov 20. Med Phys. 2019. PMID: 30367497 Free PMC article. Review.
-
DiCyc: GAN-based deformation invariant cross-domain information fusion for medical image synthesis.Inf Fusion. 2021 Mar;67:147-160. doi: 10.1016/j.inffus.2020.10.015. Inf Fusion. 2021. PMID: 33658909 Free PMC article.
-
The Major Hypotheses of Alzheimer's Disease: Related Nanotechnology-Based Approaches for Its Diagnosis and Treatment.Cells. 2023 Nov 21;12(23):2669. doi: 10.3390/cells12232669. Cells. 2023. PMID: 38067098 Free PMC article. Review.
References
-
- Black J., Ellis T., Rosin P. (2003). A novel method for video tracking performance evaluation, in Proceedings of the IEEE InternationalWorkshop on Visual Surveillance and Performance Evaluation of Tracking and Surveillance (VS-PETS 03) (Nice: ), 125–132.
-
- Botev Z., Grotowski J., Kroese D. (2010). Kernel density estimation via diffusion. Ann. Stat. 38, 2916–2957. 10.1214/10-AOS799 - DOI
-
- Bron E. E., Smits M., Van Der Flier W. M., Vrenken H., Barkhof F., Scheltens P., et al. . (2015). Standardized evaluation of algorithms for computer-aided diagnosis of dementia based on structural MRI: the caddementia challenge. Neuroimage 111, 562–579. 10.1016/j.neuroimage.2015.01.048 - DOI - PMC - PubMed
-
- Brown J. D. (2009). Principal components analysis and exploratory factor analysis—definitions, differences, and choices definitions, differences, and choices. Shiken JALT Test. Eval. SIG Newslett. 13, 26–30.
Grants and funding
LinkOut - more resources
Full Text Sources
Other Literature Sources
Miscellaneous