. 2017 Nov 14:8:600.
doi: 10.3389/fneur.2017.00600. eCollection 2017.

The Video Head Impulse Test to Assess the Efficacy of Vestibular Implants in Humans

Affiliations

The Video Head Impulse Test to Assess the Efficacy of Vestibular Implants in Humans

Nils Guinand et al. Front Neurol. .

Abstract

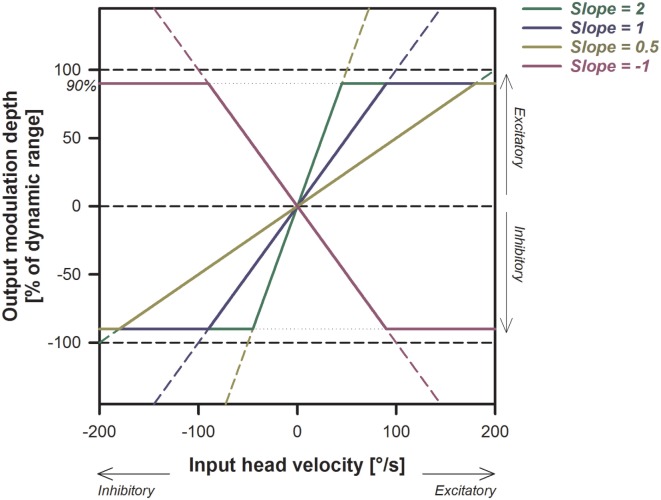
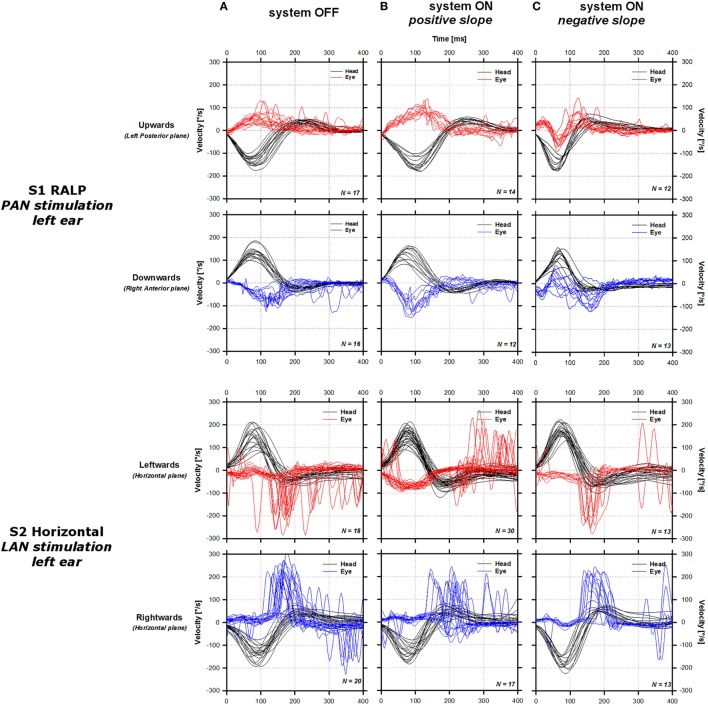
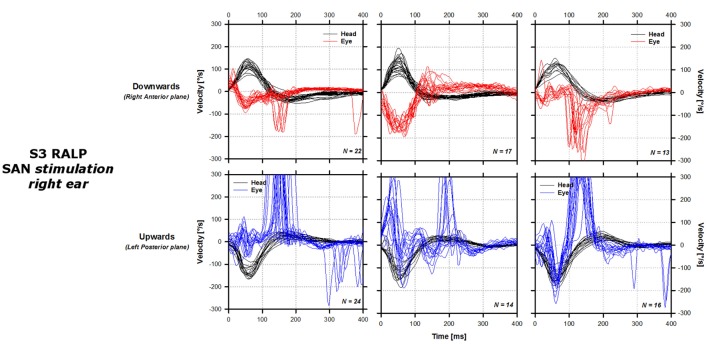
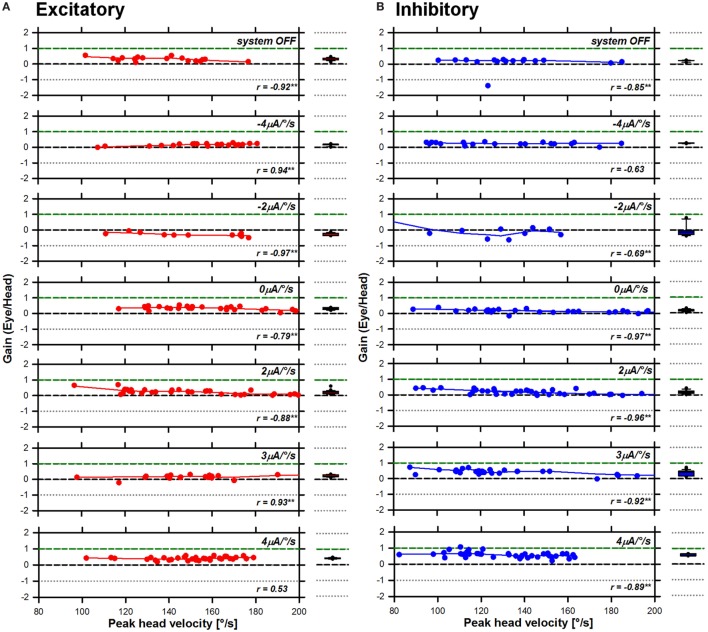
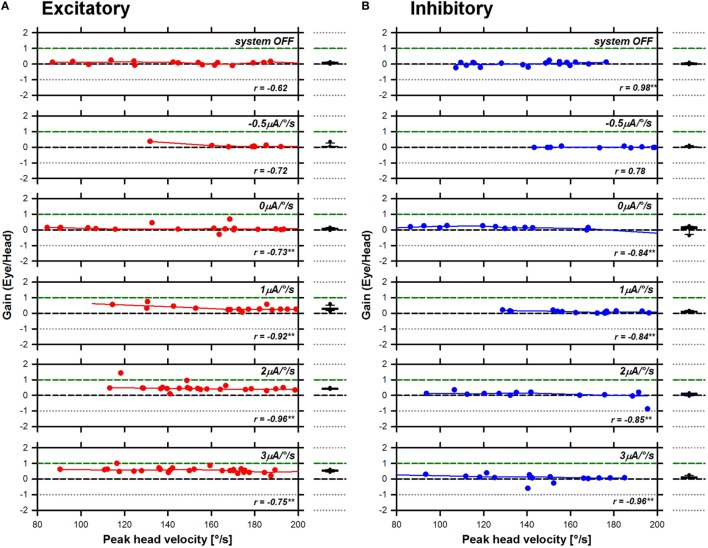
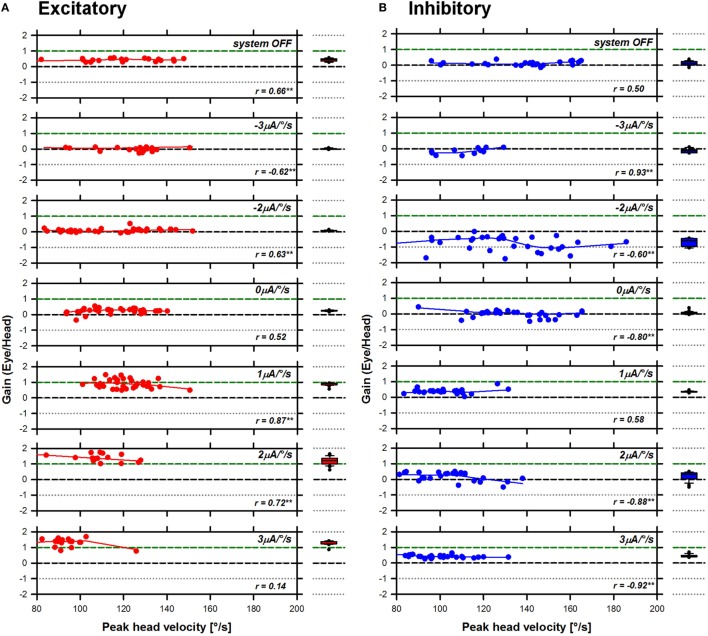
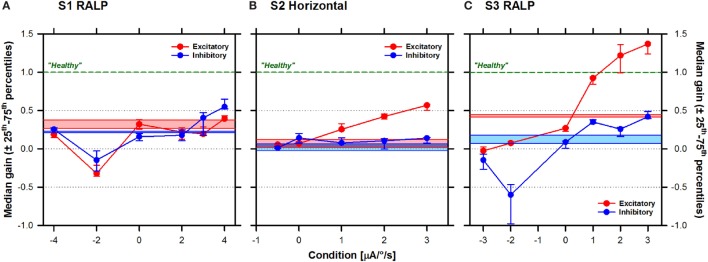
The purpose of this study was to evaluate whether it is possible to restore the high-frequency angular vestibulo-ocular reflex (aVOR) in patients suffering from a severe bilateral vestibulopathy (BV) and implanted with a vestibular implant prototype. Three patients (S1-3) participated in the study. They received a prototype vestibular implant with one to three electrode branches implanted in the proximity of the ampullary branches of the vestibular nerve. Five electrodes were available for electrical stimulation: one implanted in proximity of the left posterior ampullary nerve in S1, one in the left lateral and another one in the superior ampullary nerves in S2, and one in the right lateral and another one in the superior ampullary nerves in S3. The high-frequency aVOR was assessed using the video head impulse test (EyeSeeCam; EyeSeeTec, Munich, Germany), while motion-modulated electrical stimulation was delivered via one of the implanted vestibular electrodes at a time. aVOR gains were compared to control measurements obtained in the same patients when the device was not activated. In three out of the five tested electrodes the aVOR gain increased monotonically with increased stimulation strength when head impulses were delivered in the plane of the implanted canal. In these cases, gains ranging from 0.4 to values above 1 were measured. A "reversed" aVOR could also be generated when inversed stimulation paradigms were used. In most cases, the gain for excitatory head impulses was superior to that recorded for inhibitory head impulses, consistent with unilateral vestibular stimulation. Improvements of aVOR gain were generally accompanied by a concomitant decrease of corrective saccades, providing additional evidence of an effective aVOR. High inter-electrode and inter-subject variability were observed. These results, together with previous research, demonstrate that it is possible to restore the aVOR in a broad frequency range using motion-modulated electrical stimulation of the vestibular afferents. This provides additional encouraging evidence of the possibility of achieving a useful rehabilitation alternative for patients with BV in the near future.

Keywords: bilateral vestibular loss; bilateral vestibulopathy; cochlear implant; electrical stimulation; vestibular implant; vestibulo-ocular reflex; video head impulse test.


Figures

Figure 1
Figure 1
Illustration of the electrical stimulation paradigm and its expected effects on the stimulation output. Examples of different linear transfer functions with slopes ranging from −1 to +2 are presented. Note that the increase in the output (modulation strength) is steeper for larger slopes. Positive slopes (yellow, blue, and green solid lines) generate excitatory stimulation (up-modulation) for excitatory head movements and inhibitory stimulation (down-modulation) for inhibitory head movements. Negative slopes (pink solid line) have the opposite behavior.
Figure 2
Figure 2
Sample video head impulse test responses of the three tested patients around one of the tested planes. For each patient [S1 right anterior–left posterior (RALP), upper lines; S2 horizontal, middle lines; S3 RALP, lower lines], the panels in the first column show data gathered without stimulation [system OFF condition (A)]. The panels in the second column show data gathered upon stimulation using a linear transfer function with a positive slope [system ON positive slope (B); S1: 4 µA/°/s, S2: 3 µA/°/s, S3: 2 µA/°/s]. Panels in the third column show data gathered upon stimulation using a linear transfer function with a negative slope [system ON negative slope (C); S1: −2 μA/°/s, S2: −0.5 μA/°/s, S3: −2 μA/°/s]. Solid black lines represent the cycle plots of the angular velocity of the head around the tested plane. Solid red and blue lines represent the cycle plots of the angular velocity of the eye in the plane of the tested canal for excitatory (red) and inhibitory impulses (blue). Positive values correspond to motion directed leftward in the horizontal plane, and motion directed downward in the vertical plane.
Figure 2
Figure 2
Sample video head impulse test responses of the three tested patients around one of the tested planes. For each patient [S1 right anterior–left posterior (RALP), upper lines; S2 horizontal, middle lines; S3 RALP, lower lines], the panels in the first column show data gathered without stimulation [system OFF condition (A)]. The panels in the second column show data gathered upon stimulation using a linear transfer function with a positive slope [system ON positive slope (B); S1: 4 µA/°/s, S2: 3 µA/°/s, S3: 2 µA/°/s]. Panels in the third column show data gathered upon stimulation using a linear transfer function with a negative slope [system ON negative slope (C); S1: −2 μA/°/s, S2: −0.5 μA/°/s, S3: −2 μA/°/s]. Solid black lines represent the cycle plots of the angular velocity of the head around the tested plane. Solid red and blue lines represent the cycle plots of the angular velocity of the eye in the plane of the tested canal for excitatory (red) and inhibitory impulses (blue). Positive values correspond to motion directed leftward in the horizontal plane, and motion directed downward in the vertical plane.
Figure 3
Figure 3
Angular vestibulo-ocular reflex (aVOR) gains recorded for S1 right anterior–left posterior in all experimental conditions. Panel (A) presents data gathered during excitatory head impulses (red plots), and panel (B) presents data gathered during inhibitory head impulses (blue plots). The line and scatter plots in the main panel present individual aVOR gains (scatter) as well as their corresponding smoothed (LOWESS, see Materials and Methods) values (lines) as a function of peak head angular velocity. The insets in the graph present the result of the statistical analysis for each condition (Pearson’s product-moment correlation coefficient; **p < 0.001—two-tailed). The box plots to the right present the median values, as well as the 25th–75th percentiles of the smoothed data pooled across head velocities. The error bars represent the 10th and 90th percentiles and the symbols present all outliers outside this range.
Figure 4
Figure 4
Angular vestibulo-ocular reflex (aVOR) gains recorded for S2 horizontal in all experimental conditions. Panel (A) presents data gathered during excitatory head impulses (red plots), and panel (B) presents data gathered during inhibitory head impulses (blue plots). The line and scatter plots in the main panel present individual aVOR gains (scatter) as well as their corresponding smoothed (LOWESS, see Materials and Methods) values (lines) as a function of peak head angular velocity. The insets in the graph present the result of the statistical analysis for each condition (Pearson’s product-moment correlation coefficient; **p < 0.001—two-tailed). The box plots to the right present the median values, as well as the 25th–75th percentiles of the smoothed data pooled across head velocities. The error bars represent the 10th and 90th percentiles and the symbols present all outliers outside this range.
Figure 5
Figure 5
Angular vestibulo-ocular reflex (aVOR) gains recorded for S3 right anterior–left posterior in all experimental conditions. Panel (A) presents data gathered during excitatory head impulses (red plots), and panel (B) presents data gathered during inhibitory head impulses (blue plots). The line and scatter plots in the main panel present individual aVOR gains (scatter) as well as their corresponding smoothed (LOWESS, see Materials and Methods) values (lines) as a function of peak head angular velocity. The insets in the graph present the result of the statistical analysis for each condition (Pearson’s product-moment correlation coefficient; **p < 0.001—two-tailed). The box plots to the right present the median values, as well as the 25th–75th percentiles of the smoothed data pooled across head velocities. The error bars represent the 10th and 90th percentiles and the symbols present all outliers outside this range.
Figure 6
Figure 6
Median (±25th–75th percentiles) angular vestibulo-ocular reflex (aVOR) gains (vertical axis) for the three patients as a function of stimulation condition (horizontal axis): (A) S1 right anterior–left posterior (RALP), (B) S2 horizontal, and (C) S3 RALP. Note that a transfer function with a slope of 0 µA/°/s corresponds to constant amplitude electrical stimulation that is not modulated by motion (i.e., baseline stimulation only). Results for excitatory head impulses are plotted in red and results for inhibitory head impulses are plotted in blue. Results without electrical stimulation (system OFF) are presented as the colored solid bars in the graph. The green dotted line represents the theoretical aVOR gain of 1 for a normal subject with a “healthy” vestibular system.

Similar articles

Cited by

References

    1. Halmagyi GM, Curthoys IS. A clinical sign of canal paresis. Arch Neurol (1988) 45:737–9.10.1001/archneur.1988.00520310043015 - DOI - PubMed
    1. Jorns-Haderli M, Straumann D, Palla A. Accuracy of the bedside head impulse test in detecting vestibular hypofunction. J Neurol Neurosurg Psychiatry (2007) 78:1113–8.10.1136/jnnp.2006.109512 - DOI - PMC - PubMed
    1. Ulmer E, Chays A. [Curthoys and Halmagyi Head Impulse test: an analytical device]. Ann Otolaryngol Chir Cervicofac (2005) 122:84–90.10.1016/S0003-438X(05)82329-1 - DOI - PubMed
    1. Bartl K, Lehnen N, Kohlbecher S, Schneider E. Head impulse testing using video-oculography. Ann N Y Acad Sci (2009) 1164:331–3.10.1111/j.1749-6632.2009.03850.x - DOI - PubMed
    1. MacDougall HG, Weber KP, Mcgarvie LA, Halmagyi GM, Curthoys IS. The video head impulse test: diagnostic accuracy in peripheral vestibulopathy. Neurology (2009) 73:1134–41.10.1212/WNL.0b013e3181bacf85 - DOI - PMC - PubMed

LinkOut - more resources