. 2018 Mar;61(3):641-657.
doi: 10.1007/s00125-017-4500-3. Epub 2017 Nov 28.

Systems biology of the IMIDIA biobank from organ donors and pancreatectomised patients defines a novel transcriptomic signature of islets from individuals with type 2 diabetes

Affiliations

Systems biology of the IMIDIA biobank from organ donors and pancreatectomised patients defines a novel transcriptomic signature of islets from individuals with type 2 diabetes

Michele Solimena et al. Diabetologia. 2018 Mar.

Abstract

Aims/hypothesis: Pancreatic islet beta cell failure causes type 2 diabetes in humans. To identify transcriptomic changes in type 2 diabetic islets, the Innovative Medicines Initiative for Diabetes: Improving beta-cell function and identification of diagnostic biomarkers for treatment monitoring in Diabetes (IMIDIA) consortium ( www.imidia.org ) established a comprehensive, unique multicentre biobank of human islets and pancreas tissues from organ donors and metabolically phenotyped pancreatectomised patients (PPP).

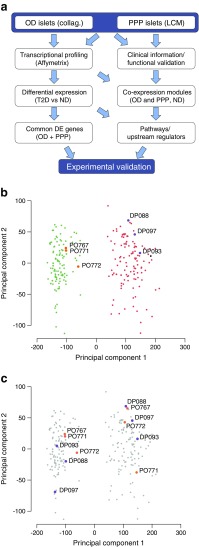
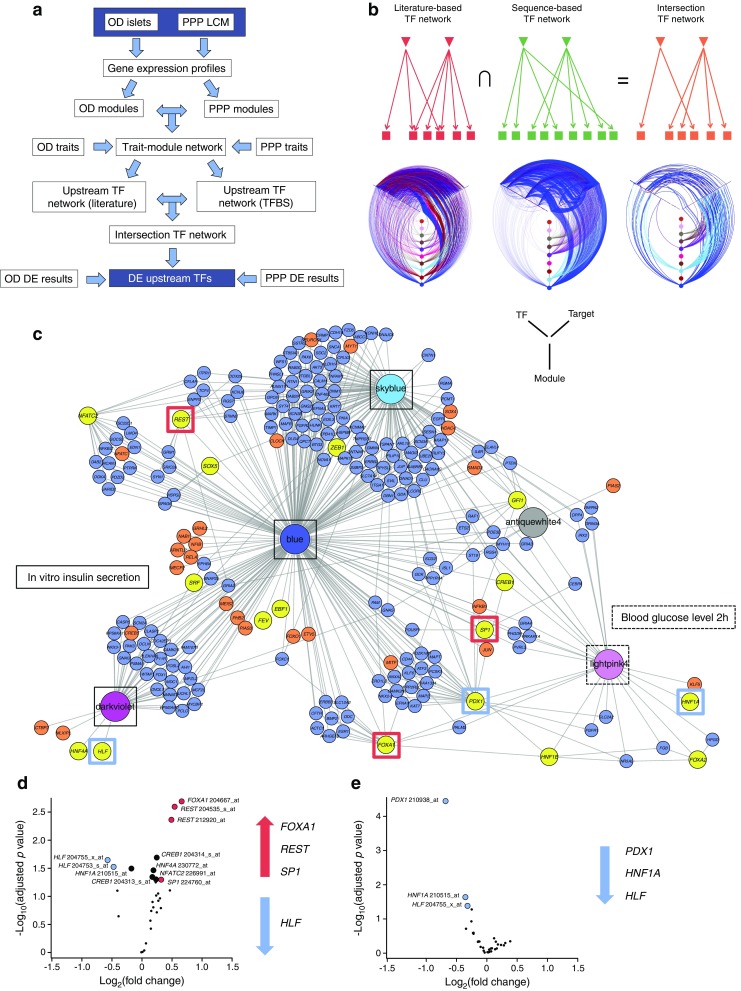
Methods: Affymetrix microarrays were used to assess the islet transcriptome of islets isolated either by enzymatic digestion from 103 organ donors (OD), including 84 non-diabetic and 19 type 2 diabetic individuals, or by laser capture microdissection (LCM) from surgical specimens of 103 PPP, including 32 non-diabetic, 36 with type 2 diabetes, 15 with impaired glucose tolerance (IGT) and 20 with recent-onset diabetes (<1 year), conceivably secondary to the pancreatic disorder leading to surgery (type 3c diabetes). Bioinformatics tools were used to (1) compare the islet transcriptome of type 2 diabetic vs non-diabetic OD and PPP as well as vs IGT and type 3c diabetes within the PPP group; and (2) identify transcription factors driving gene co-expression modules correlated with insulin secretion ex vivo and glucose tolerance in vivo. Selected genes of interest were validated for their expression and function in beta cells.

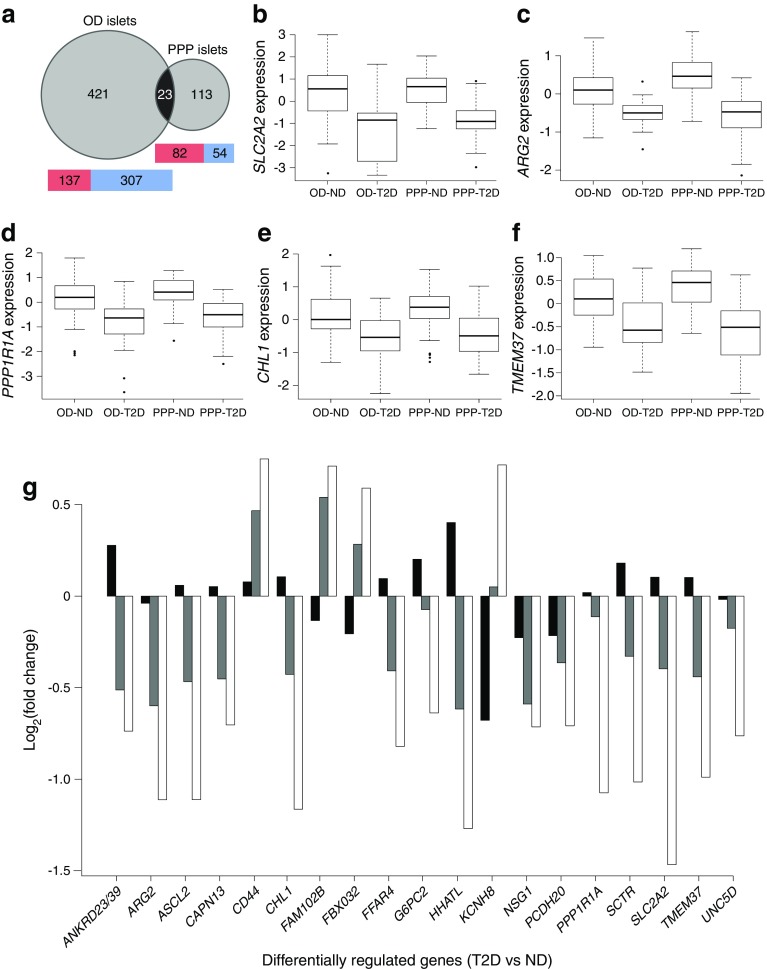
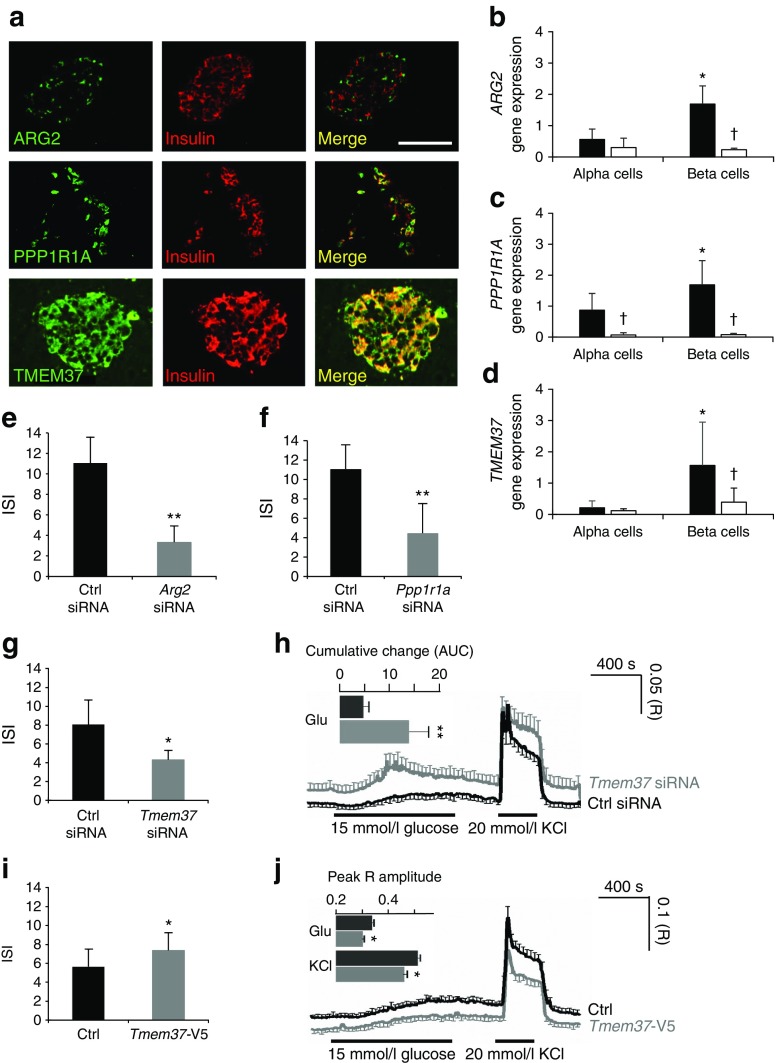
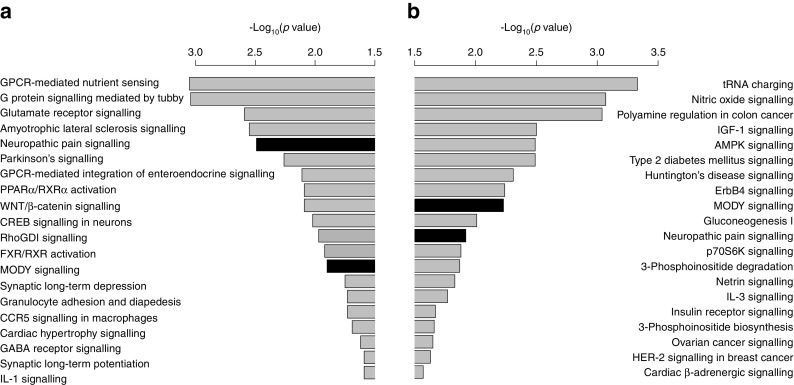
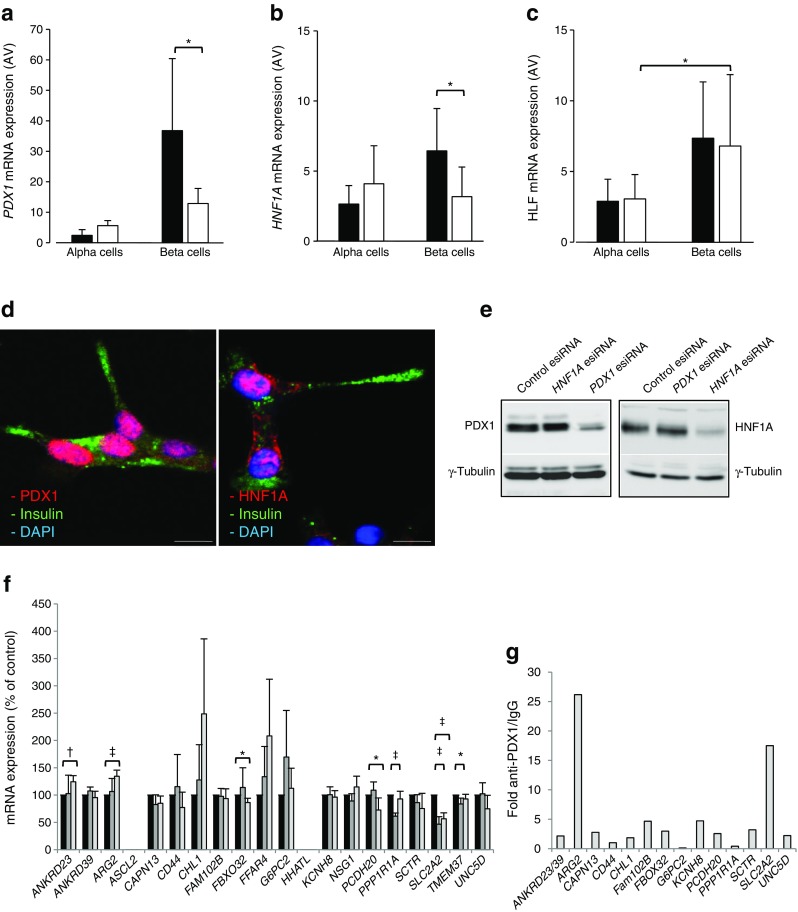
Results: Comparative transcriptomic analysis identified 19 genes differentially expressed (false discovery rate ≤0.05, fold change ≥1.5) in type 2 diabetic vs non-diabetic islets from OD and PPP. Nine out of these 19 dysregulated genes were not previously reported to be dysregulated in type 2 diabetic islets. Signature genes included TMEM37, which inhibited Ca2+-influx and insulin secretion in beta cells, and ARG2 and PPP1R1A, which promoted insulin secretion. Systems biology approaches identified HNF1A, PDX1 and REST as drivers of gene co-expression modules correlated with impaired insulin secretion or glucose tolerance, and 14 out of 19 differentially expressed type 2 diabetic islet signature genes were enriched in these modules. None of these signature genes was significantly dysregulated in islets of PPP with impaired glucose tolerance or type 3c diabetes.

Conclusions/interpretation: These studies enabled the stringent definition of a novel transcriptomic signature of type 2 diabetic islets, regardless of islet source and isolation procedure. Lack of this signature in islets from PPP with IGT or type 3c diabetes indicates differences possibly due to peculiarities of these hyperglycaemic conditions and/or a role for duration and severity of hyperglycaemia. Alternatively, these transcriptomic changes capture, but may not precede, beta cell failure.

Keywords: Beta cell; Biobank; Diabetes; Gene expression; Insulin secretion; Islet; Laser capture microdissection; Organ donor; Pancreatectomy; Systems biology.


Figures

Fig. 1
Fig. 1
Transcriptional profiling of islet samples using complementary isolation techniques. (a) Overview of our approach. Islets from OD and PPP were analysed by Affymetrix profiling to identify differentially expressed (DE) genes. These data were combined with clinical and functional data to identify gene co-expression modules correlated with T2D-related traits. ‘Collag.’ refers to enzymatic digestion. ‘Common DE genes’ refers to genes differentially regulated in T2D vs ND in both OD and PPP islets. ‘Pathways/Upstream regulators’ refers to pathways downstream of and regulatory genes upstream of gene co-expression modules. (b, c). Principal component analysis of OD and PPP islets isolated enzymatically or by LCM using all transcribed genes. Principal component 1 (PC1) accounts for 49% of the total variance; PC2 accounts for 4%. (b) LCM islet samples (green, PPP; orange, OD) cluster separately from enzymatically isolated islet samples (orange, OD; grey, PPP) regardless of patient origin. (c) Duplicate OD (orange) and PPP (purple) samples isolated either enzymatically or by LCM are highlighted, confirming that clustering is according to the isolation method. DP, code for Dresden pancreatectomised patient samples; ND, non-diabetic; PO, code for Pisa OD samples; T2D, type 2 diabetic
Fig. 2
Fig. 2
Transcriptomic analyses revealed a common gene signature in type 2 diabetic islets of OD and PPP. (a) Venn diagram showing the number of differentially expressed (DE) genes in T2D OD and PPP islets and in ND OD and PPP islets. The numbers include genes mapping to more than one probe set. Twenty-three differentially expressed genes overlapped between the two datasets (p = 9.1 × 10−12; hypergeometric test assuming a background of 15,165 expressed genes). Heatmaps indicate the number of upregulated (red) and downregulated (blue) genes in OD and PPP islets. (bf). Box plots for the expression changes of five of the 19 differentially expressed genes that were dysregulated in the same direction in T2D compared to ND in OD and PPP islets. Circles represent outliers. (g) Fold changes in the expression of the 19 commonly dysregulated genes in T2D in islets from IGT PPP (black bars), T3cD PPP (grey bars) and T2D PPP (white bars) vs expression in ND PPP islets. See ESM Tables 7 and 8 for more details. ND, non-diabetic; T2D, type 2 diabetic; T3cD, type 3c diabetic
Fig. 3
Fig. 3
Functional validation of the dysregulated genes ARG2, PPP1R1A and TMEM37 in insulin-producing cells. (a) Confocal microscopy of human pancreas tissue sections co-immunostained for insulin and ARG2, PPP1R1A or TMEM37. (b-d) RT-qPCR analysis of ARG2, PPP1R1A and TMEM37 expression levels in human islet alpha and beta cell-enriched fractions from ND (n = 5, black columns) and T2D (n = 4, white columns) OD (*p < 0.05, beta vs alpha cells; p < 0.05 T2D vs ND beta cells, Student’s t test). (e-g) Insulin stimulation index (ISI) of INS-1 832/13 cells after silencing of Arg2 (e), Ppp1r1a (f) or Tmem37 (g) expression with small interfering RNA (siRNA) (grey columns) vs cells treated with a control (Ctrl siRNA, black columns) siRNA oligonucleotide (*p < 0.05, **p < 0.01, Student’s t test). (h) Ca2+ concentrations in INS-1 832/13 cells after silencing of Tmem37 (grey trace) vs cells treated with a control (Ctrl siRNA) siRNA oligonucleotide (black trace). The curves show the mean ± SEM Fura-2 AM ratios for 11 (n = 351 siGLO+, Ctrl siRNA-treated cells) and 12 (n = 480 siGLO+, Tmem37 siRNA-treated cells) coverslips. Changes in glucose and KCl concentrations are indicated. The inset shows the mean ± SEM cumulative Ca2+ changes (AUC) in response to glucose (**p < 0.01 vs Ctrl, Mann–Whitney U test). (i) ISI of INS-1 832/13 cells transfected with Tmem37-V5 or the empty pcDNA3.1 vector (Ctrl) (*p < 0.05, Student’s t test) (j) Ca2+ concentrations in eGFP+ INS-1 832/13 cells co-transfected with Tmem37-V5 (grey trace) and eGFP+ INS-1 832/13 cells co-transfected with the empty pcDNA3.1 vector (Ctrl) (black trace). The curves show the mean ± SEM Fura Red ratios (R) for ten (n = 332 eGFP+, Tmem37-V5 co-transfected cells) and 12 (n = 419 eGFP+, pcDNA3.1 co-transfected cells) coverslips. The glucose concentration was increased from 3 to 15 mmol/l, and 20 mmol/l KCl was added at the indicated times. The inset shows mean + SEM of the peak R amplitude in response to high glucose and KCl stimulation (*p < 0.05, unpaired two-tailed t test). ND, non-diabetic; T2D, type 2 diabetic
Fig. 4
Fig. 4
Genes regulated in type 2 diabetic OD and PPP islets are enriched for beta cell function-related pathways. The significance of pathway enrichment is shown as the log10(enrichment p value) for significantly differentially expressed genes (Limma empirical Bayes adjusted p ≤ 0.05, absolute fold change ≤1.5 for OD and ≤1.2 for PPP) in OD (a) and PPP (b) islets. Black bars represent regulated pathways in common between OD and PPP type 2 diabetic islets. AMPK, 5´ AMP-activated protein kinase; CCR5, C-C motif chemokine receptor 5; CREB, cAMP responsive element binding protein; FXR, farnesoid X receptor; GABA, γ-aminobutyric acid; GPCR, G protein-coupled receptor; HER2, human epidermal growth factor receptor 2; p70S6K, p70 ribosomal protein S6 kinase; PPARα, peroxisome proliferator-activated receptor α; RhoGDI, rho GDP dissociation inhibitor; RXRα, retinoid X receptor α. See ESM Tables 10–12 for more details
Fig. 5
Fig. 5
Systems biology analysis predicted the key transcription factors (TFs) regulated in type 2 diabetes. (a) Workflow to identify upstream TFs. (b) Schematic showing how literature and sequence-based networks were combined to generate an intersection network. TFs are represented by inverted triangles and genes are represented by squares. Evidence for TF gene targets is shown by arrows (literature red, sequence-based green). Intersection Network (orange) shows TF–target gene interactions present in both literature and sequence-based networks. Underneath each schematic is a hive plot showing edges between upstream TFs, target genes and gene co-expression modules. Modules are shown as coloured nodes on the vertical axes. TFs are represented on the left axes and their predicted target genes on the right axes. Edges are coloured according to the gene co-expression module of the source node. Nodes are ordered along the axes by increasing degree from the centre outwards. (c) Network representation of the Intersection Network shown in (b). Gene co-expression modules are represented as large coloured nodes in the corresponding module colour. skyblue, blue and darkviolet modules are correlated with the insulin stimulation index (ISI) of OD islets (solid black outlines), while lightpink4 module correlates with glucose concentrations at 2 h after an OGTT in PPP islets (dashed box). Yellow nodes indicate potential upstream TFs for each module. Blue or orange nodes indicate putative target genes (TFs in orange). Network edges were predicted by both literature and sequence motif-based approaches. For visualisation, the network was filtered to remove all gene nodes except for TFs with only one edge. For a more detailed view, a PDF version of Fig. 5 is provided as ESM Fig. 11. (d, e) Volcano plots of differentially expressed TFs in type 2 diabetic vs non-diabetic OD (d) and PPP (e) islets. Significantly differentially regulated TFs (Limma empirical Bayes adjusted (Benjamini Hochberg method) p ≤ 0.05, fold change ≥1.2) are shown as red (upregulated) or blue (downregulated) circles, while potentially differentially regulated TFs with lower fold changes (FDR ≤0.05; no fold change cut-off) are shown as black circles. Upregulated and downregulated TFs are also indicated on the right of each plot. See ESM Table 13 for more details
Fig. 6
Fig. 6
Validation of PDX1, HNF1A and HLF as transcription factors (TFs) located upstream of the T2D islet signature genes. (ac) RT-qPCR of PDX1 (a), HNF1A (b), and HLF (c) expression levels in alpha and beta cell-enriched fractions from human ND (n = 5, black bars) and T2D (n = 4, white bars) OD islets. *p < 0.05, Student’s t test. (d) Co-immunostaining for insulin (green) and PDX1 or HNF1A (red) in human EndoC-βH1 cells. Nuclei are counterstained with DAPI (blue). (e) Immunoblots for PDX1, HNF1A or γ-tubulin in EndoC-βH1 cells treated with esiRNA for PDX1, HNF1A or with a control esiRNA. Bar, 10 μm. (f) RT-qPCR of the 19 T2D islet signature genes in EndoC-βH1 cells treated with esiRNA for PDX1 or HNF1A or with a control esiRNA (*p < 0.05, p < 0.01 and p < 0.001; ANOVA) (n = 4, except for ANKRD39, which was measured three times). (g) Fold enrichment (y-axis) of T2D islet signature genes with predicted binding sites for PDX1 as measured upon chromatin immunoprecipitation with anti-PDX1 antibody vs control IgG followed by RT-qPCR with primers flanking the predicted binding site. The values in (g) are from three independent chromatin immunoprecipitations. esiRNA, endoribonuclease-prepared small interfering RNA; ND, non-diabetic; T2D, type 2 diabetic

References

    1. Fuchsberger C, Flannick J, Teslovich TM, et al. The genetic architecture of type 2 diabetes. Nature. 2016;536:41–47. doi: 10.1038/nature18642. - DOI - PMC - PubMed
    1. Halban PA, Polonsky KS, Bowden DW, et al. β-cell failure in type 2 diabetes: postulated mechanisms and prospects for prevention and treatment. Diabetes Care. 2014;37:1751–1758. doi: 10.2337/dc14-0396. - DOI - PMC - PubMed
    1. Kahn SE. The relative contributions of insulin resistance and beta-cell dysfunction to the pathophysiology of type 2 diabetes. Diabetologia. 2003;46:3–19. doi: 10.1007/s00125-002-1009-0. - DOI - PubMed
    1. Rahier J, Guiot Y, Goebbels RM, Sempoux C, Henquin JC. Pancreatic beta-cell mass in European subjects with type 2 diabetes. Diabetes Obes Metab. 2008;10(Suppl 4):32–42. doi: 10.1111/j.1463-1326.2008.00969.x. - DOI - PubMed
    1. Marselli L, Suleiman M, Masini M, et al. Are we overestimating the loss of beta cells in type 2 diabetes? Diabetologia. 2014;57:362–365. doi: 10.1007/s00125-013-3098-3. - DOI - PubMed

Publication types