. 2017 Oct;1(10):1577-1583.
doi: 10.1038/s41559-017-0299-z. Epub 2017 Aug 28.

Worldwide patterns of human epigenetic variation

Affiliations

Worldwide patterns of human epigenetic variation

Oana Carja et al. Nat Ecol Evol. 2017 Oct.

Abstract

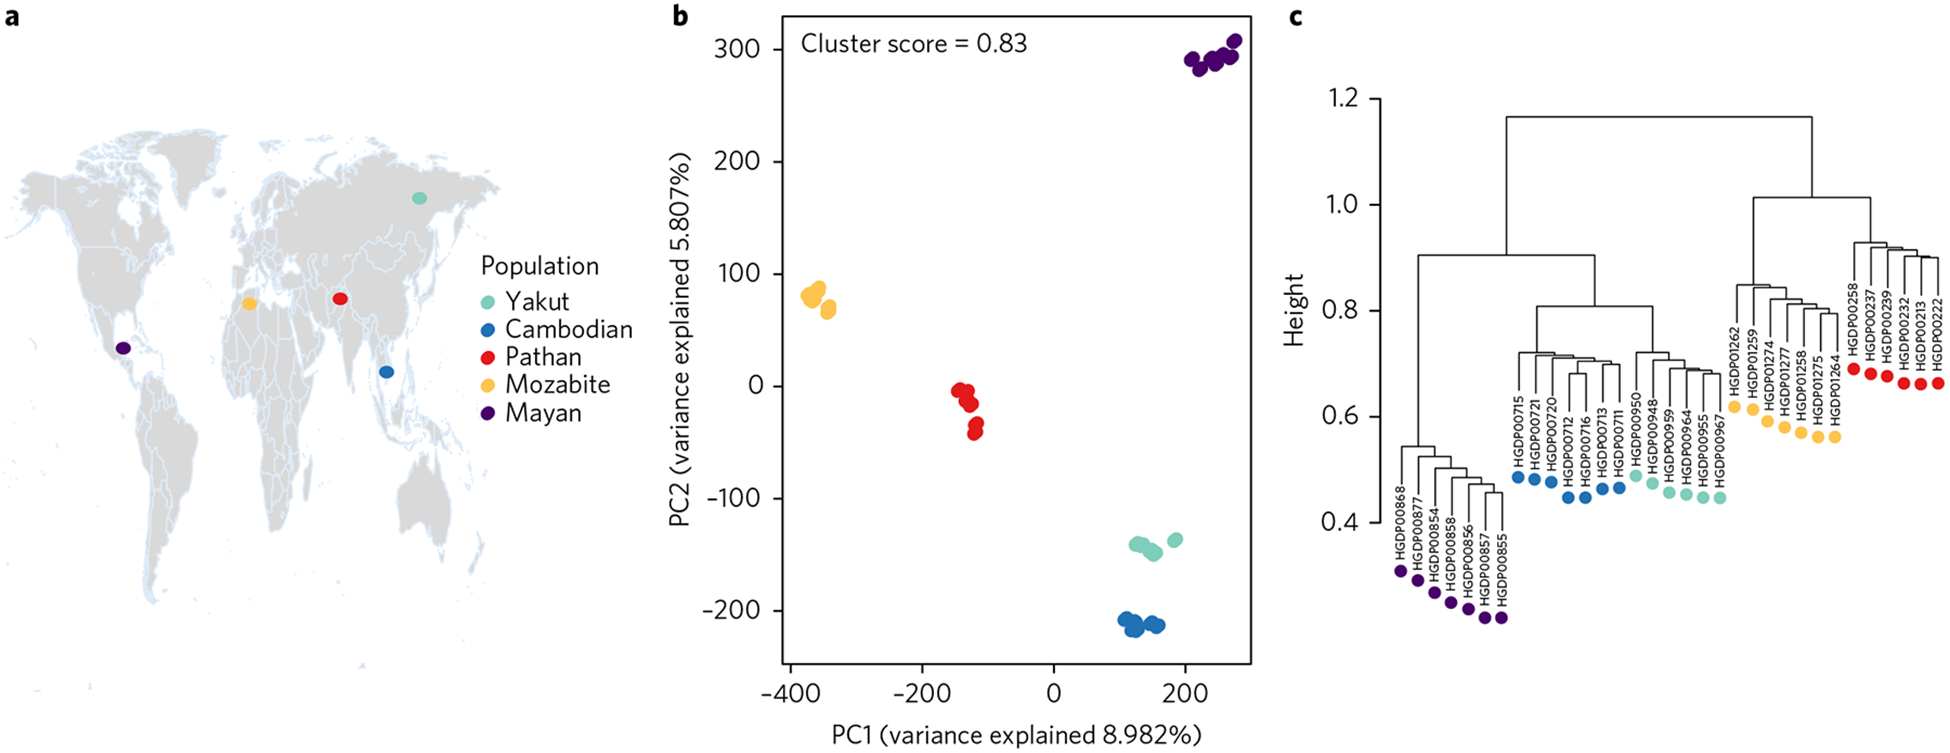
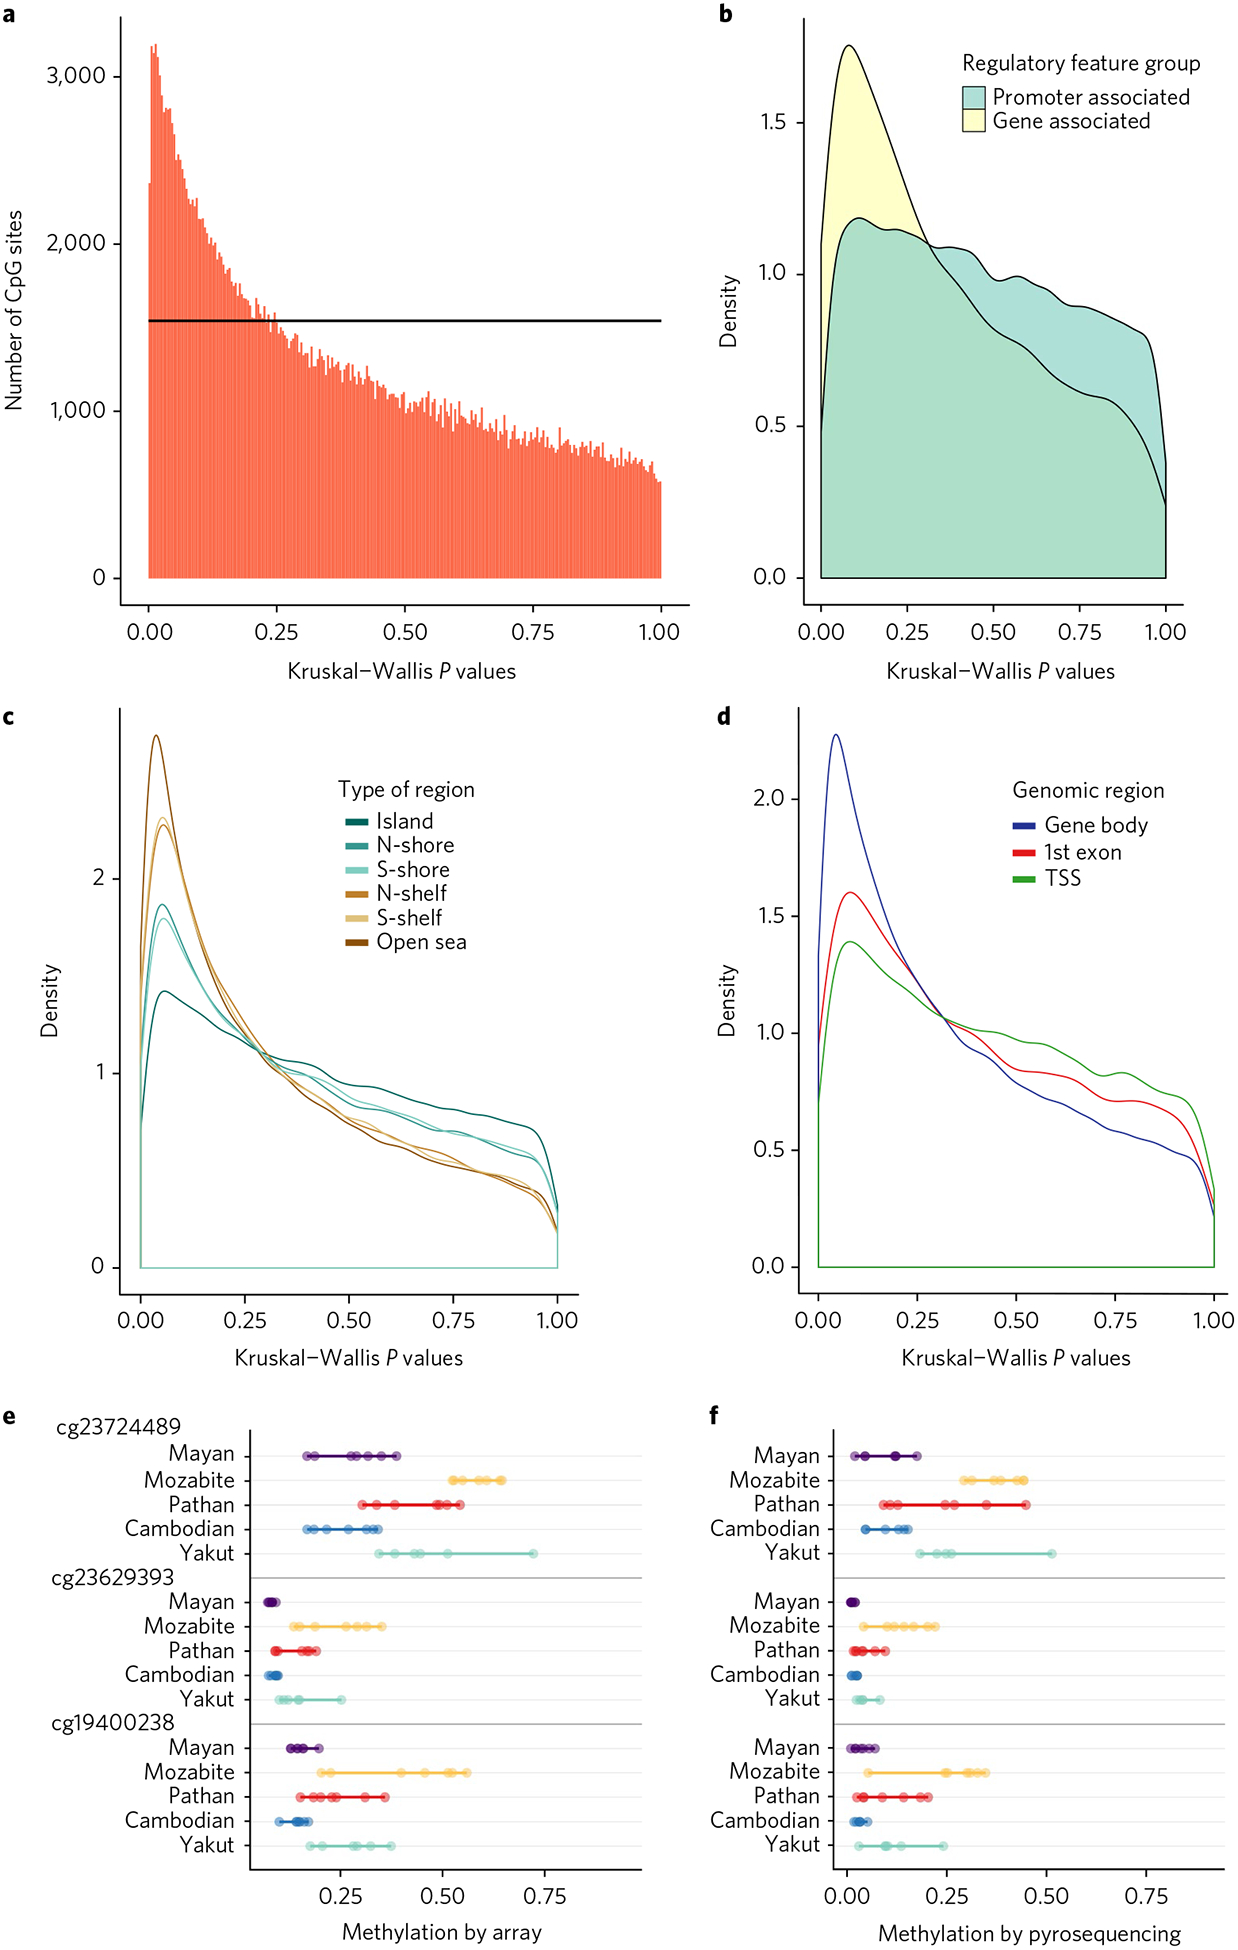
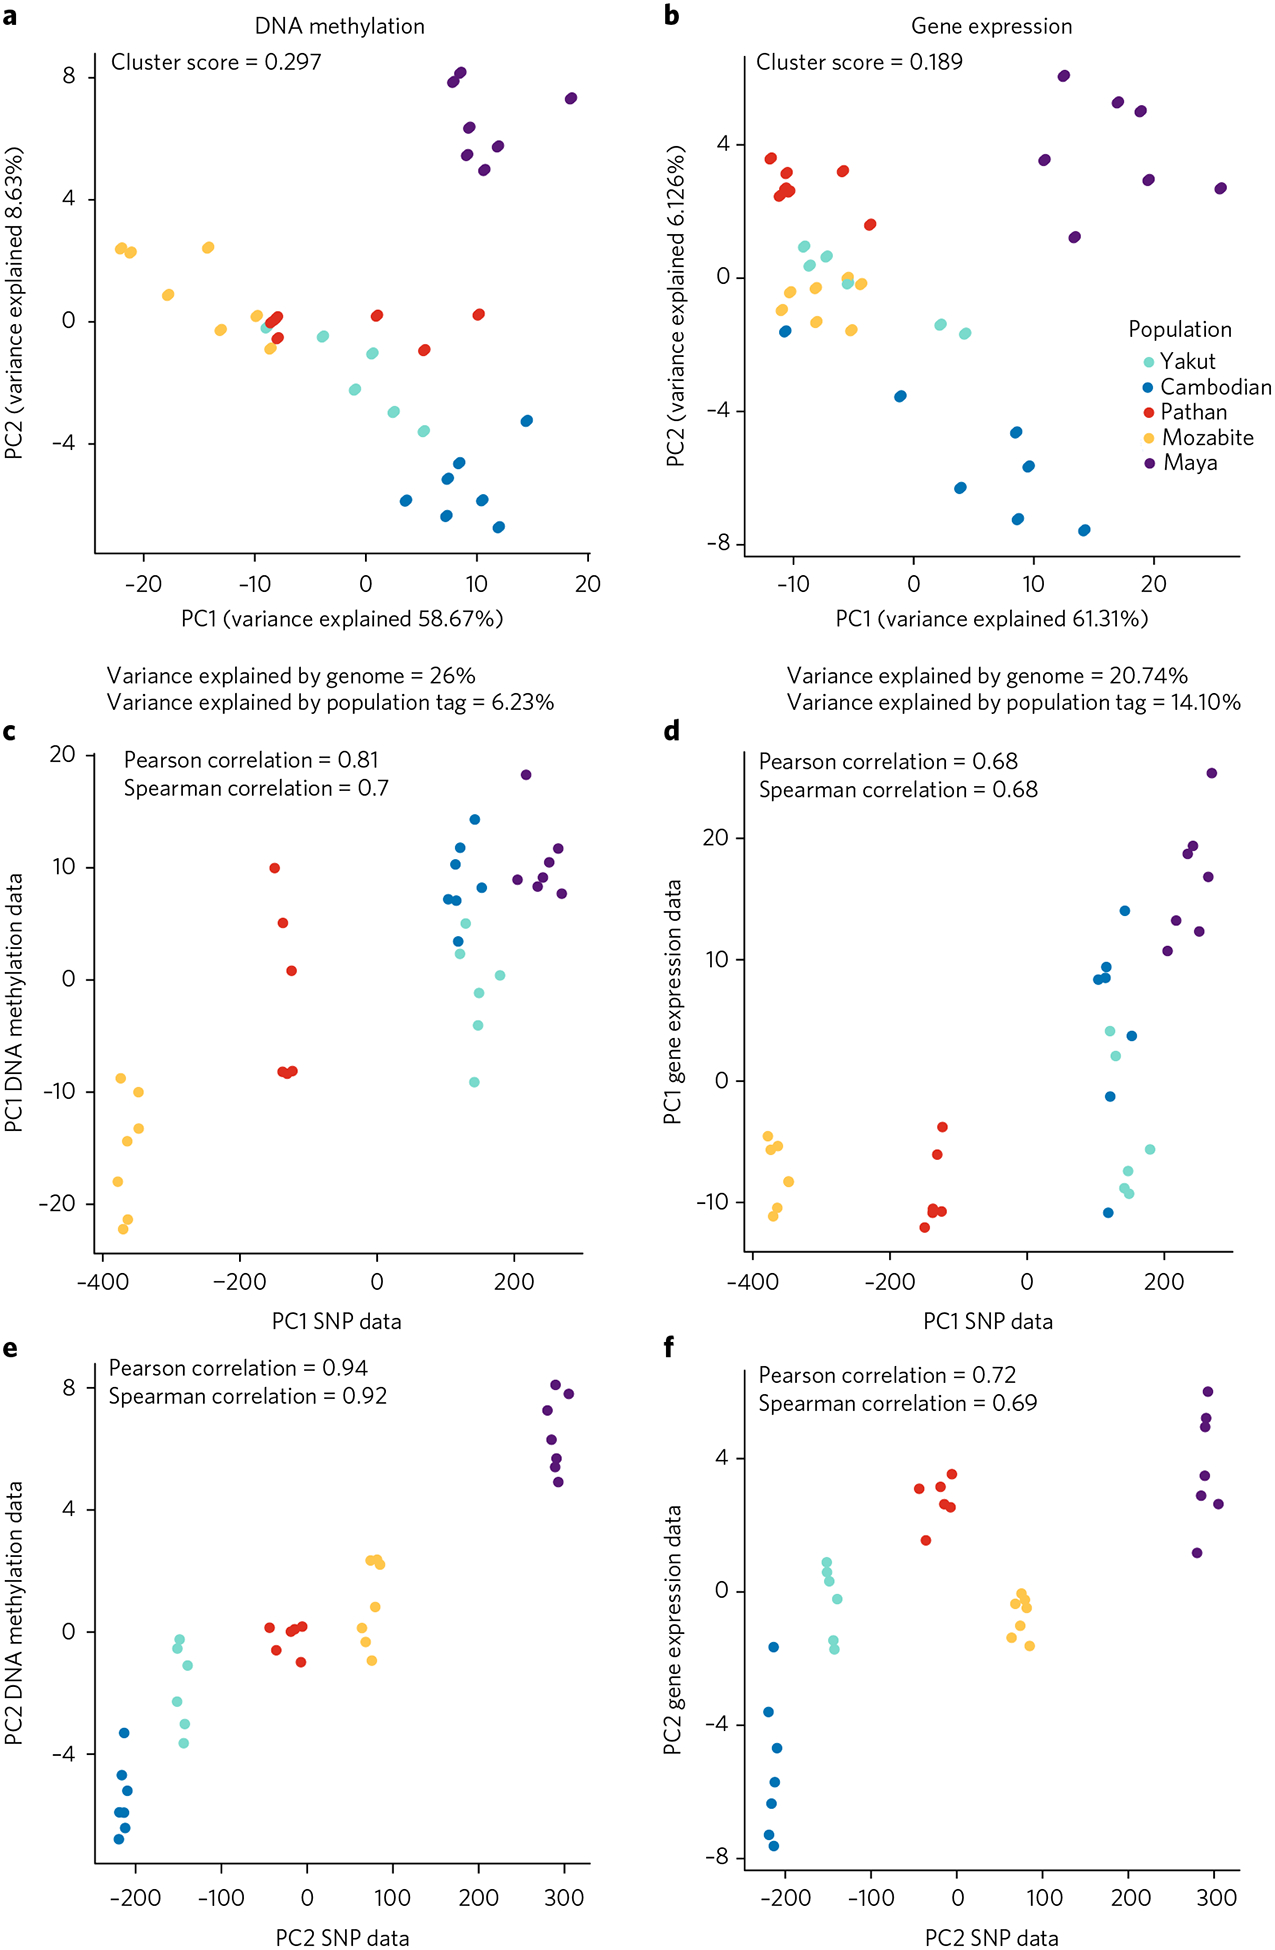
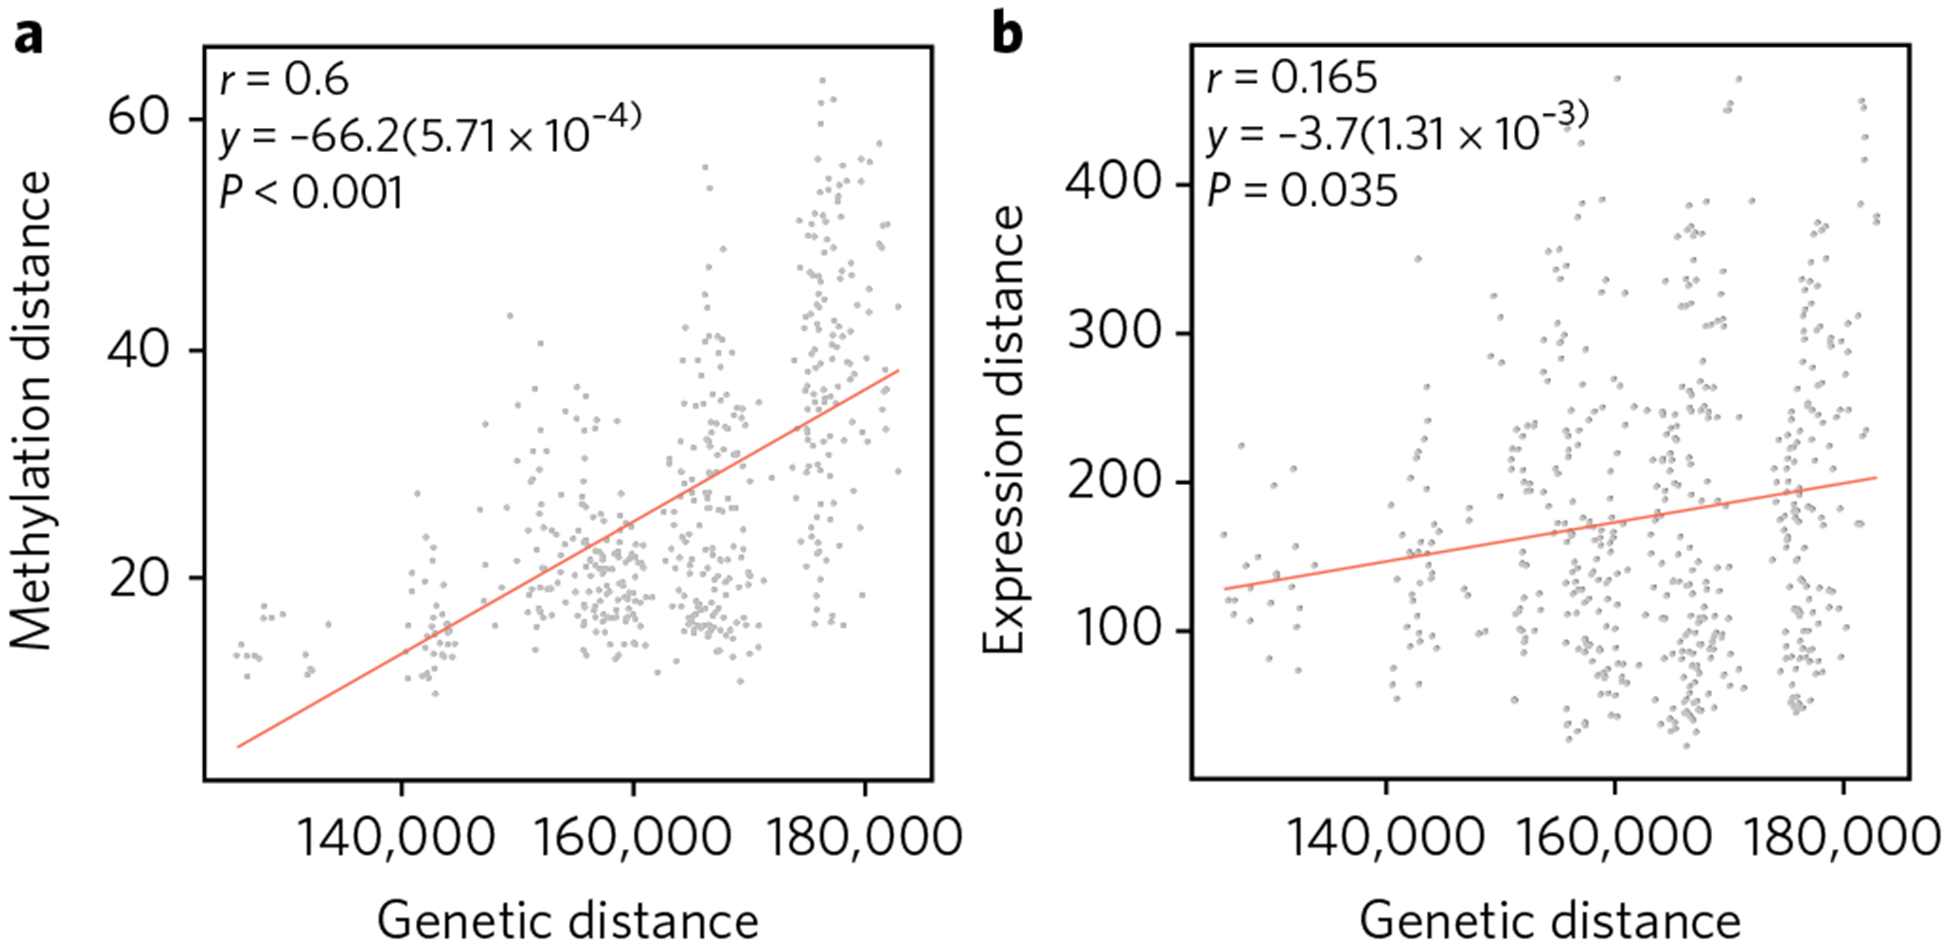
DNA methylation is an epigenetic modification, influenced by both genetic and environmental variation, that plays a key role in transcriptional regulation and many organismal phenotypes. Although patterns of DNA methylation have been shown to differ between human populations, it remains to be determined how epigenetic diversity relates to the patterns of genetic and gene expression variation at a global scale. Here we measured DNA methylation at 485,000 CpG sites in five diverse human populations, and analysed these data together with genome-wide genotype and gene expression data. We found that population-specific DNA methylation mirrors genetic variation, and has greater local genetic control than mRNA levels. We estimated the rate of epigenetic divergence between populations, which indicates far greater evolutionary stability of DNA methylation in humans than has been observed in plants. This study provides a deeper understanding of worldwide patterns of human epigenetic diversity, as well as initial estimates of the rate of epigenetic divergence in recent human evolution.


Conflict of interest statement

Competing interests

The authors declare no competing financial interests.

Figures

Fig. 1 |
Fig. 1 |. Context of genome-wide population structure.
a, The geographic locations of populations in the data set, shown on a Gall–Peters projection map. b, PCA on the SNP genotype matrix. The first and second PCs explain 9% and 6% of the variation, respectively, and clearly differentiate the individuals into five well-separated clusters that correspond to the five populations sampled. c, A hierarchical clustering tree also captures the genetic relationships between the individuals and their populations.
Fig. 2 |
Fig. 2 |. Population specificity of Cpg methylation.
a, A graph of Kruskal–Wallis P values for all CpG sites across all individuals in the five different populations. The black horizontal line corresponds to the uniform P value distribution expected by chance. bd, Differences based on different types of CpG regions. The CpG sites that exhibit population differentiation are enriched in regions that are gene-associated, outside of CpG islands, and inside gene bodies (TSS, transcription start sites). e,f, Comparison of percentage methylation by array (e) and by pyrosequencing (f) for the top three CpG sites with highest population specificity.
Fig. 3 |
Fig. 3 |. Structure of epigenome-wide population differences.
a, PCA using top 200 CpG sites with highest Pst values. b, PCA using top 200 gene expression levels with highest Pst values. Silhouette cluster scores (SCS) and percentage of variance explained by genetic variation versus the population label are as presented. cf, Scatter plots of PC1 and PC2 SNP genotype data versus DNA methylation data (c,e) and gene expression data (d,f).
Fig. 4 |
Fig. 4 |. epigenetic divergence as a linear function of genetic distance.
a,b, The x axis represents sequence divergence, measured as number of allele differences. The y axes are the genome-wide CpG methylation Manhattan distance (a; using the CpG sites with top 200 Pst values, between every pair of individuals across the five populations) and the genome-wide mRNA Manhattan distance (b; using the expression levels with top 200 Pst values, between every pair of individuals across the five populations). The linear regression lines are shown, together with the correlation coefficients and permutation P values using 1,000 randomizations of the data.

References

    1. Cavalli-Sforza LL, Menozzi P & Piazza A The History and Geography of Human Genes (Princeton Univ. Press, Princeton, NJ, 1994).
    1. Li JZ et al. Worldwide human relationships inferred from genome-wide patterns of variation. Science 319, 1100–1104 (2008). - PubMed
    1. Novembre J et al. Genes mirror geography within Europe. Nature 456, 98–101 (2008). - PMC - PubMed
    1. Jakobsson M et al. Genotype, haplotype and copy-number variation in worldwide human populations. Nature 451, 998–1003 (2008). - PubMed
    1. Ramachandran S et al. Support from the relationship of genetic and geographic distance in human populations for a serial founder effect originating in Africa. Proc. Natl Acad. Sci. USA 102, 15942–15947 (2005). - PMC - PubMed