. 2017 Dec 7;552(7683):96-100.
doi: 10.1038/nature24995. Epub 2017 Nov 29.

Genetic diversity of the African malaria vector Anopheles gambiae

Collaborators

Genetic diversity of the African malaria vector Anopheles gambiae

Anopheles gambiae 1000 Genomes Consortium et al. Nature. .

Abstract

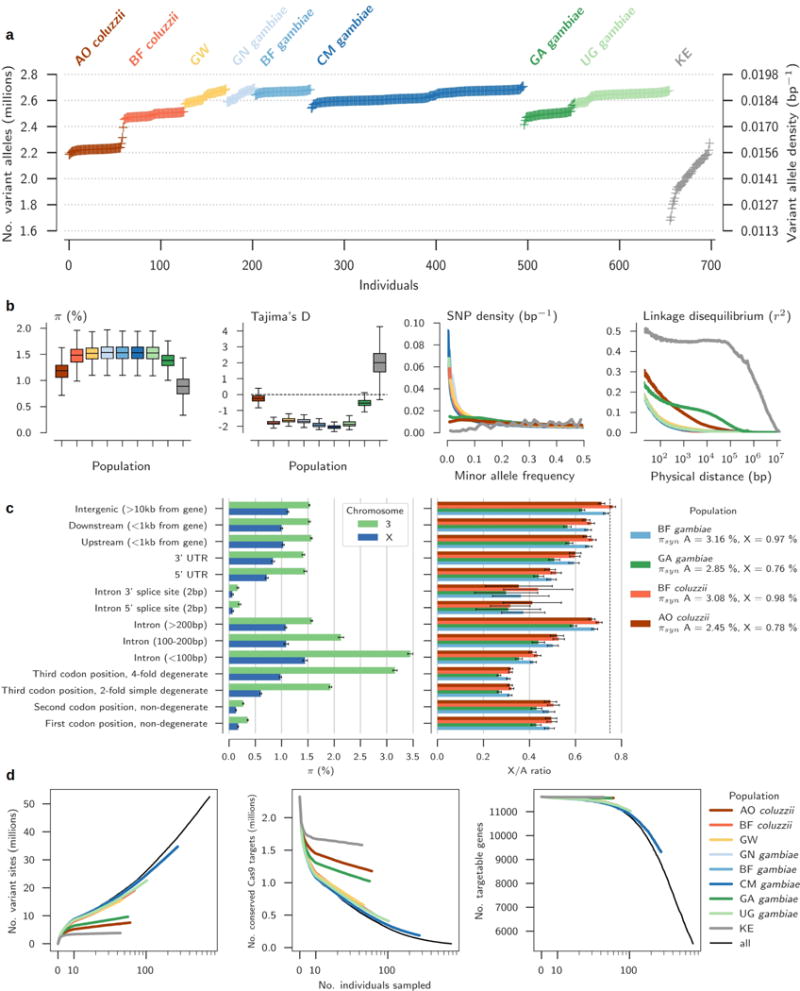
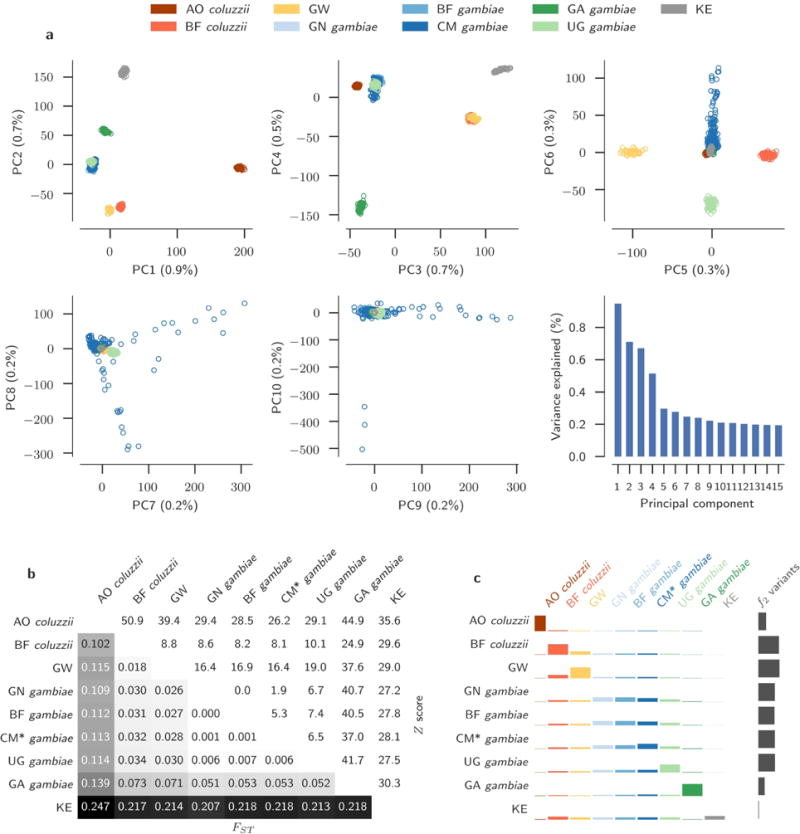
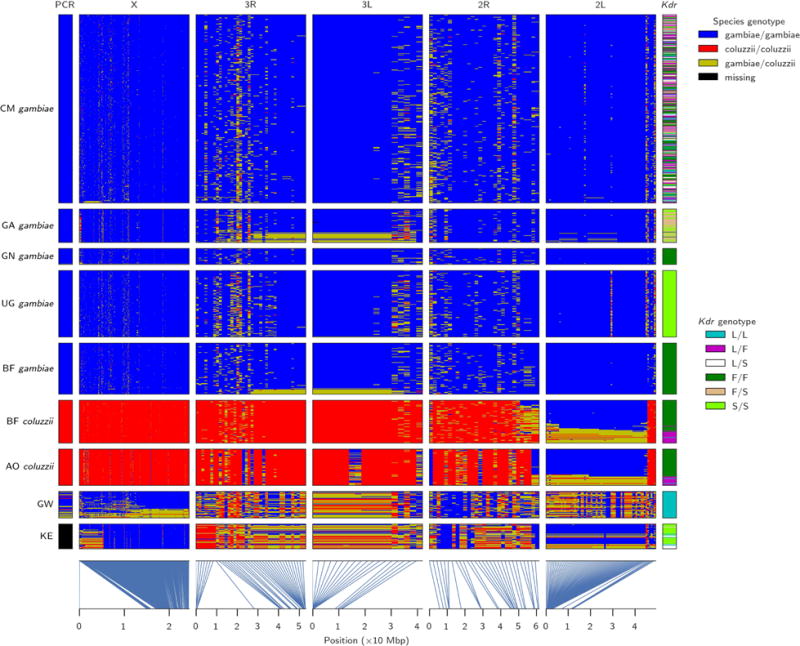
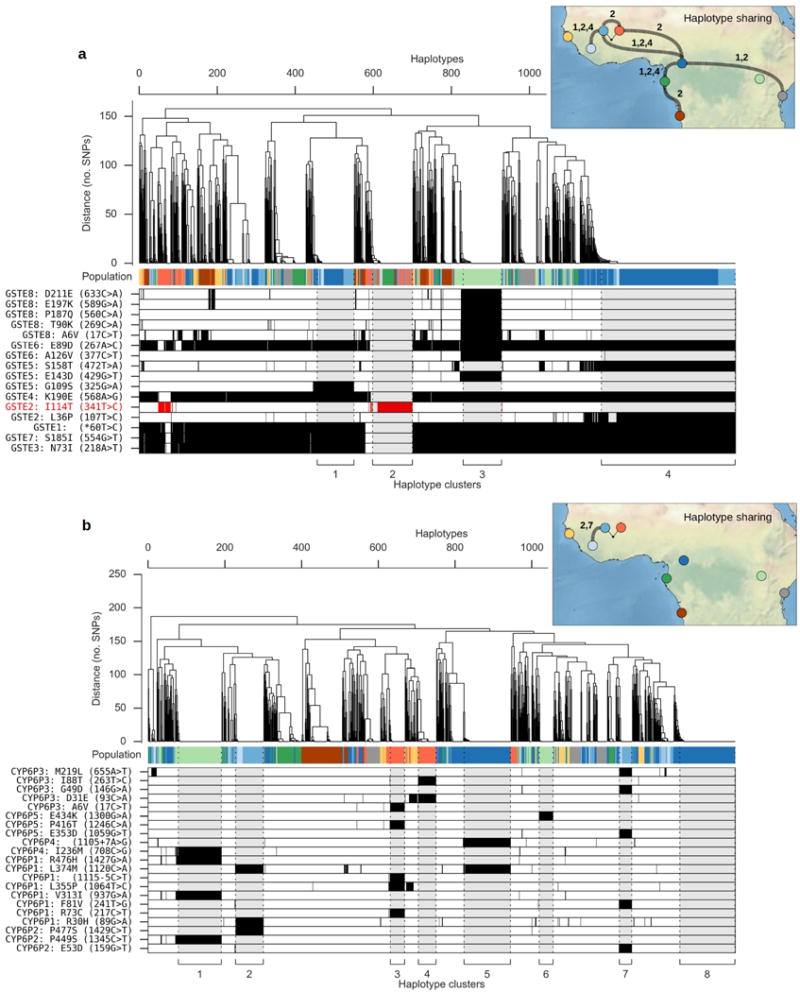
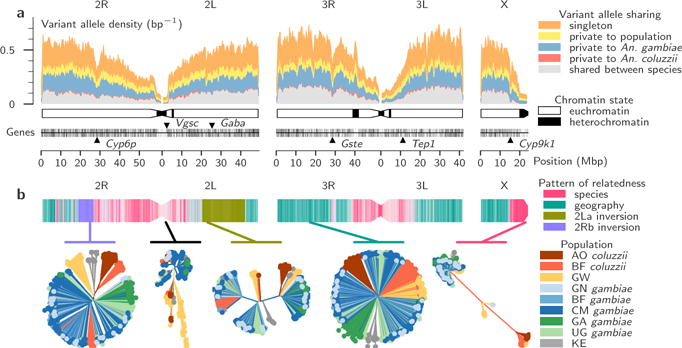
The sustainability of malaria control in Africa is threatened by the rise of insecticide resistance in Anopheles mosquitoes, which transmit the disease. To gain a deeper understanding of how mosquito populations are evolving, here we sequenced the genomes of 765 specimens of Anopheles gambiae and Anopheles coluzzii sampled from 15 locations across Africa, and identified over 50 million single nucleotide polymorphisms within the accessible genome. These data revealed complex population structure and patterns of gene flow, with evidence of ancient expansions, recent bottlenecks, and local variation in effective population size. Strong signals of recent selection were observed in insecticide-resistance genes, with several sweeps spreading over large geographical distances and between species. The design of new tools for mosquito control using gene-drive systems will need to take account of high levels of genetic diversity in natural mosquito populations.


Conflict of interest statement

The authors declare no competing financial interests.

Figures

Extended Data Figure 1
Extended Data Figure 1. Overview of population sampling
Red circles show sampling locations for wild-caught mosquitoes. Colours in the map represent ecosystem classes; dark green represents forest ecosystems, see (49) Fig. 9 for a complete colour legend. The Congo Basin tropical rainforest is the large region of dark green in Central Africa. Sampling details for each site are shown in light grey boxes, including country (two-letter country code), location and year of collection, predominant ecosystem classification for the local region, and number and sex of individuals sequenced. For colony crosses, the direction of cross (colony of origin of mother and father) and number of offspring is shown. The inset map depicts geological fault lines in the East African rift system. Species assignment for Guinea-Bissau and Kenya specimens is uncertain, see main text. Sequencing depth per individual is shown as median (5th – 95th percentile) for each population.
Extended Data Figure 2
Extended Data Figure 2. Genome accessibility and haplotype validation
a, Percentage of accessible bases in non-overlapping 400 kbp windows. The schematic of chromosomes below shows chromatin state predictions from (50). b, Haplotypes inferred in the crosses. Each panel shows either maternal or paternal haplotypes from a single cross. Each row within a panel represents a single progeny haplotype. Haplotypes are coloured by parental inheritance (blue=allele from parent’s first chromosome, red=allele from parent’s second chromosome). Switches between colours along a haplotype indicate recombination events. Regions that were within a run of homozygosity in the parent and thus not informative for haplotype validation are masked in grey. c, Error rate estimates for haplotypes inferred in wild-caught individuals. Upper plots show estimates for the mean switch distance (red line), compared to the mean switch distance if heterozygotes were phased randomly (black line). Lower plots show the switch error rate (probability of a switch error occurring between two adjacent heterozygous genotype calls).
Extended Data Figure 3
Extended Data Figure 3. Variant discovery and nucleotide diversity
a, Number of variant alleles discovered per individual mosquito. Only females are plotted. b, Genetic diversity within populations. Nucleotide diversity (π) and Tajima’s D were calculated in non-overlapping 20 kbp genomic windows. SNP density depicts the distribution of allele frequencies (site frequency spectrum) for each population, scaled such that a population with constant size over time is expected to have a constant SNP density over all allele frequencies. c, Average nucleotide diversity (π) and ratio of diversity between sex-linked (X) and autosomal (A) chromosomes in relation to gene architecture. d, Relationship between number of individuals sampled and the cumulative number of variant sites discovered (left panel), availability of conserved Cas9 target sites within genes (center panel), and number of genes containing at least 1 conserved Cas9 target site which could thus be “targetable” for gene drive (right panel).
Extended Data Figure 4
Extended Data Figure 4. ADMIXTURE analysis
a, Ancestry proportions within individual mosquitoes for ADMIXTURE models from K=2 to K=10 ancestral populations. Each vertical bar represents the proportion of ancestry within a single individual, with colours corresponding to ancestral populations. These data are the average of the major q-matrix clusters derived by CLUMPAK analysis. b, Violin plot of cross-validation error for each of 100 replicates for each K.
Extended Data Figure 5
Extended Data Figure 5. Population structure and differentiation
a, Principal components analysis of the 765 wild-caught mosquitoes. b, Average allele frequency differentiation (FST) between pairs of populations. The lower left triangle shows average FST between each population pair. The upper right triangle shows the Z score for each FST value estimated via a block-jackknife procedure. CM*=Cameroon savanna sampling site only. c, Allele sharing in doubleton (f2) variants. The height of the coloured bars represent the probability of sharing a doubleton allele between two populations. Heights are normalized row-wise for each population.
Extended Data Figure 6
Extended Data Figure 6. Ancestry informative markers (AIMs)
Rows represent individual mosquitoes (grouped by population) and columns represent SNPs (grouped by chromosome arm). Colours represent species genotype. The column at the far left shows the species assignment according to the conventional molecular test based on a single marker on the X chromosome, which was performed for all individuals except Kenya (KE). The column at the far right shows the genotype for kdr variants in Vgsc codon 995. Lines at the lower edge show the physical locations of the AIM SNPs.
Extended Data Figure 7
Extended Data Figure 7. Population size history
a, Stairway Plot of inferred histories for each population. The shaded area shows the 95% confidence interval from 199 bootstrap replicates. b, Inferred histories from ∂a∂i three epoch models. The thick line shows the history with the highest likelihood found by optimization; thin lines show 100 histories with the highest likelihoods from even sampling of the model parameter space. c, Inferred histories from ∂a∂i 2-population models allowing for migration. For each population pair, solutions from 5 optimization runs with the highest likelihoods are shown, with the thick line showing the history with the highest likelihood. In all panels, time and Ne are scaled assuming 11 generations per year and a mutation rate of μ=3.5×10⁻⁹. Scaling of time and Ne is proportional to 1/μ, e.g., if the true mutation rate is twice as high then estimates of time and Ne would be halved.
Extended Data Figure 8
Extended Data Figure 8. Identity by descent (IBD) and recent effective population size history
a, Patterns of IBD sharing within populations. Each marker represents a pair of individuals. b, The distribution of IBD tract lengths within populations. c, Recent population size history for the Kenyan population inferred by IBDNe. d, Comparison of the IBD tract length distribution between Kenya and four simulated demographic scenarios. e, Population size histories inferred by IBDNe (red dashed lines) from data generated by simulations (black line shows the simulated population size history). f, Comparison of patterns of IBD sharing generated by simulations (black contour lines) with Kenyan data (filled blue contours). See Supplementary Text 8.4 for details of simulations.
Extended Data Figure 9
Extended Data Figure 9. Genome scans for signatures of recent selection
a, Haplotype diversity. Each track plots the H12 statistic in non-overlapping windows over the genome. A value of 1 indicates low haplotype diversity within a window, expected if one or two haplotypes have risen to high frequency due to recent selection. A value of 0 indicates high haplotype diversity, expected in neutral regions. b, XP-EHH scans. For each population comparison (e.g., BF gambiae versus BF coluzzii), positive scores indicate longer haplotypes and therefore recent selection in the first population (e.g., BF gambiae), and negative scores indicate selection in the second population (e.g., BF coluzzii).
Extended Data Figure 10
Extended Data Figure 10. Haplotype structure at metabolic insecticide resistance loci
Plot components are as described for Fig. 4. For both loci, SNPs shown in the lower panel are all either non-synonymous or splice site variants, and are associated with one or more haplotypes under selection. a, Haplotype clustering using 1,375 SNPs within the region 3R:28,591,663-28,602,280 spanning 8 genes (Gste1-Gste8). b, Haplotype clustering using 1,844 SNPs within the region 2R:28,491,415-28,502,910 spanning 5 genes (Cyp6p1-Cyp6p5).
Figure 1
Figure 1. Patterns of genomic variation
a, Density of nucleotide variation in 200 kbp windows over the genome. b, Variation in the pattern of relatedness between individual mosquitoes over the genome. The three chromosomes are painted using colours to represent the major pattern of relatedness found within each 100 kbp window. Below, neighbour-joining trees are shown from a selection of genomic windows that are representative of the four major patterns of relatedness found, as well as for the window spanning the Vgsc gene. AO=Angola; BF=Burkina Faso; GW=Guinea-Bissau; GN=Guinea; CM=Cameroon; GA=Gabon; UG=Uganda; KE=Kenya.
Figure 2
Figure 2. Geographical population structure and migration
In the upper panel, each mosquito is depicted as a vertical bar painted by the proportion of the genome inherited from each of K=8 inferred ancestral populations. Pie charts on the map depict the same ancestry proportions summed over all individuals for each population. Text in white shows average FST followed in parentheses by estimates of the population migration rate (2Nm).
Figure 3
Figure 3. Population size history
a, Stairway Plot of changes in population size over time. Absolute values of time and Ne are shown on alternative axes as a range of values, assuming lower and upper limits for the mutation rate μ as 2.8×10⁻⁹ and 5.5×10⁻⁹ respectively and T=11 generations per year. b, Runs of homozygosity (RoH) in individual mosquitoes, highlighting recent inbreeding in Kenyan (grey) and colony mosquitoes (black; P=Pimperena, M=Mali, K=Kisumu, G=Ghana).
Figure 4
Figure 4. Evolution and spread of insecticide resistance in the Vgsc gene
The upper panel shows a dendrogram obtained by hierarchical clustering of haplotypes from wild-caught individuals. The colour bar below shows the population of origin for each haplotype. The lower panel shows alleles carried by each haplotype at 17 non-synonymous SNPs with alternate allele frequency > 1% (white=reference allele, black=alternate allele, red=previously known resistance allele). At the lower margin, we label 10 haplotype clusters carrying a kdr allele (either L995F or L995S). The inset map depicts haplotypes shared between populations, demonstrating the spread of insecticide resistance.

References

    1. Hemingway J, et al. Averting a malaria disaster: will insecticide resistance derail malaria control? Lancet. 2016 doi: 10.1016/S0140-6736(15)00417-1. - DOI - PMC - PubMed
    1. Bhatt S, et al. The effect of malaria control on Plasmodium falciparum in Africa between 2000 and 2015. Nature. 2015;526:207–211. - PMC - PubMed
    1. Torre A della, et al. Molecular evidence of incipient speciation within Anopheles gambiae s.s. in West Africa. Insect Mol Biol. 2001;10:9–18. - PubMed
    1. Lawniczak MKN, et al. Widespread divergence between incipient Anopheles gambiae species revealed by whole genome sequences. Science. 2010;330:512–4. - PMC - PubMed
    1. Tene Fossog B, et al. Habitat segregation and ecological character displacement in cryptic African malaria mosquitoes. Evol Appl. 2015 doi: 10.1111/eva.12242. n/a-n/a. - DOI - PMC - PubMed

Publication types