. 2017 Dec 7;552(7683):126-131.
doi: 10.1038/nature24678. Epub 2017 Nov 27.

Promoter-bound METTL3 maintains myeloid leukaemia by m6A-dependent translation control

Affiliations

Promoter-bound METTL3 maintains myeloid leukaemia by m6A-dependent translation control

Isaia Barbieri et al. Nature. .

Abstract

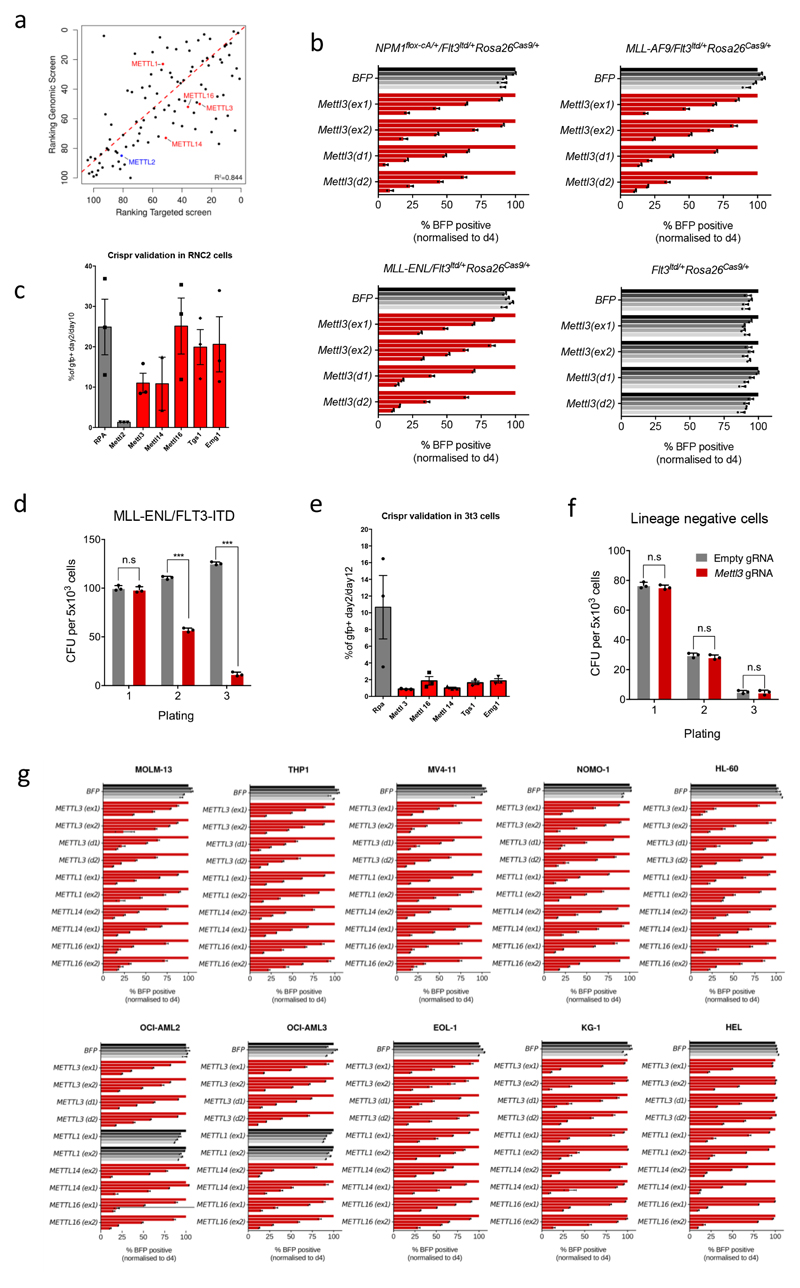
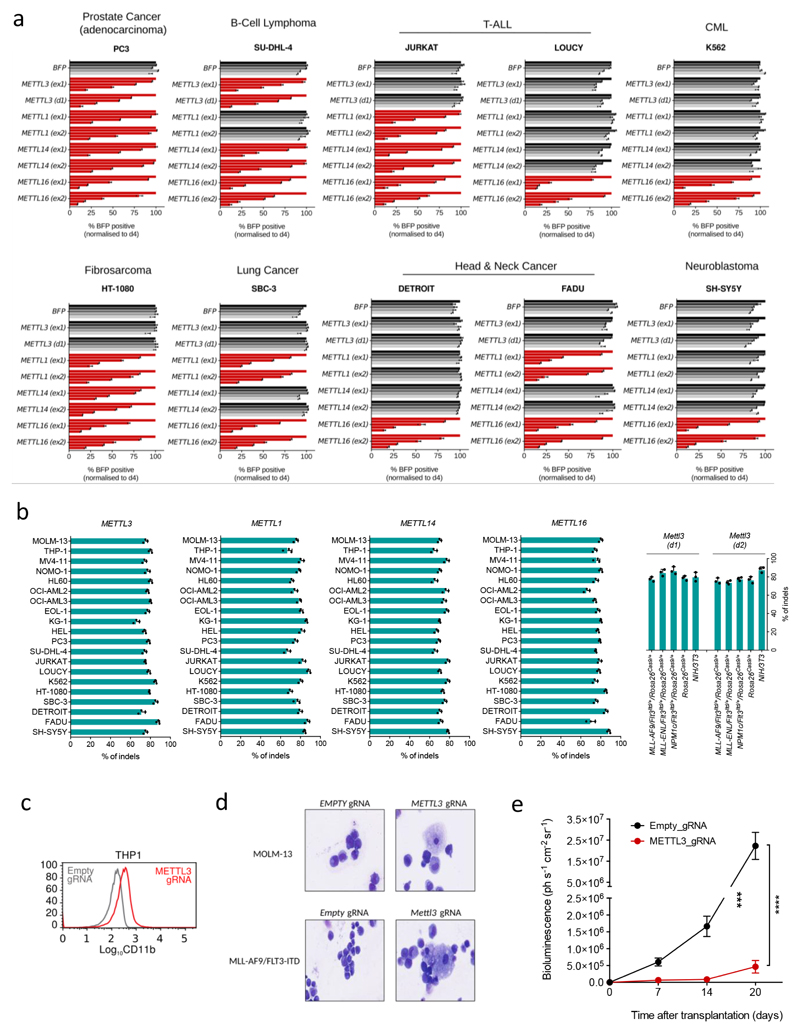
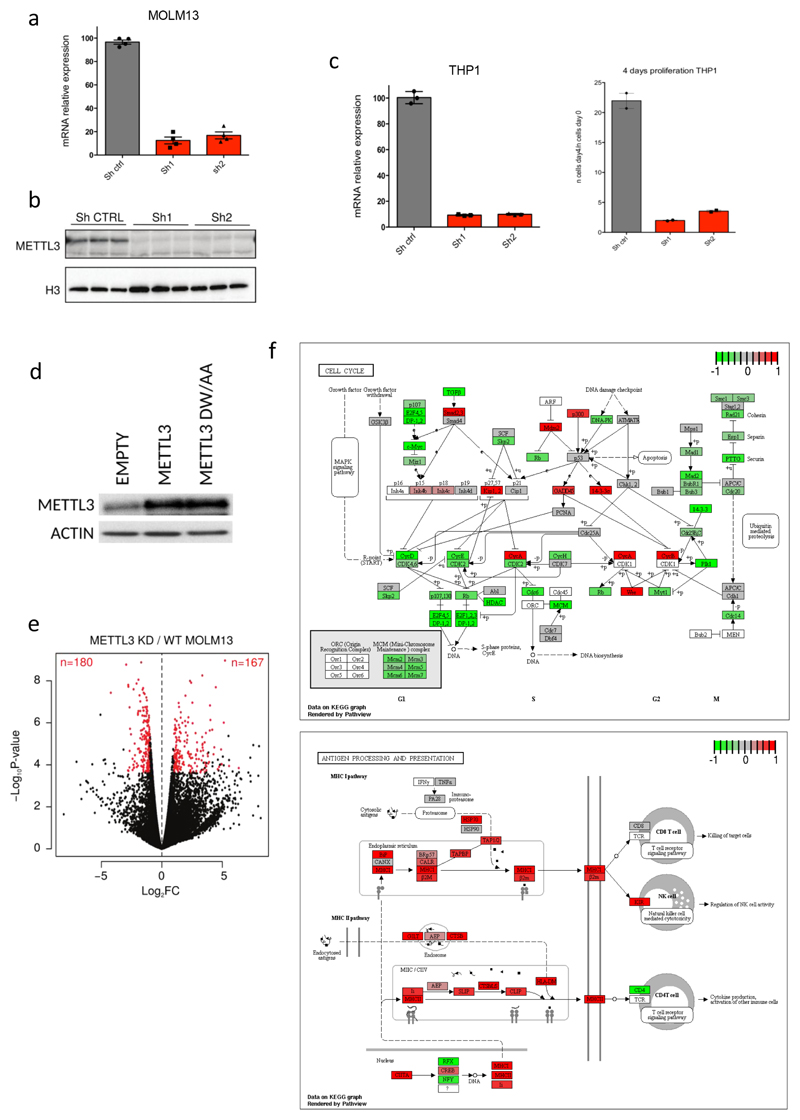
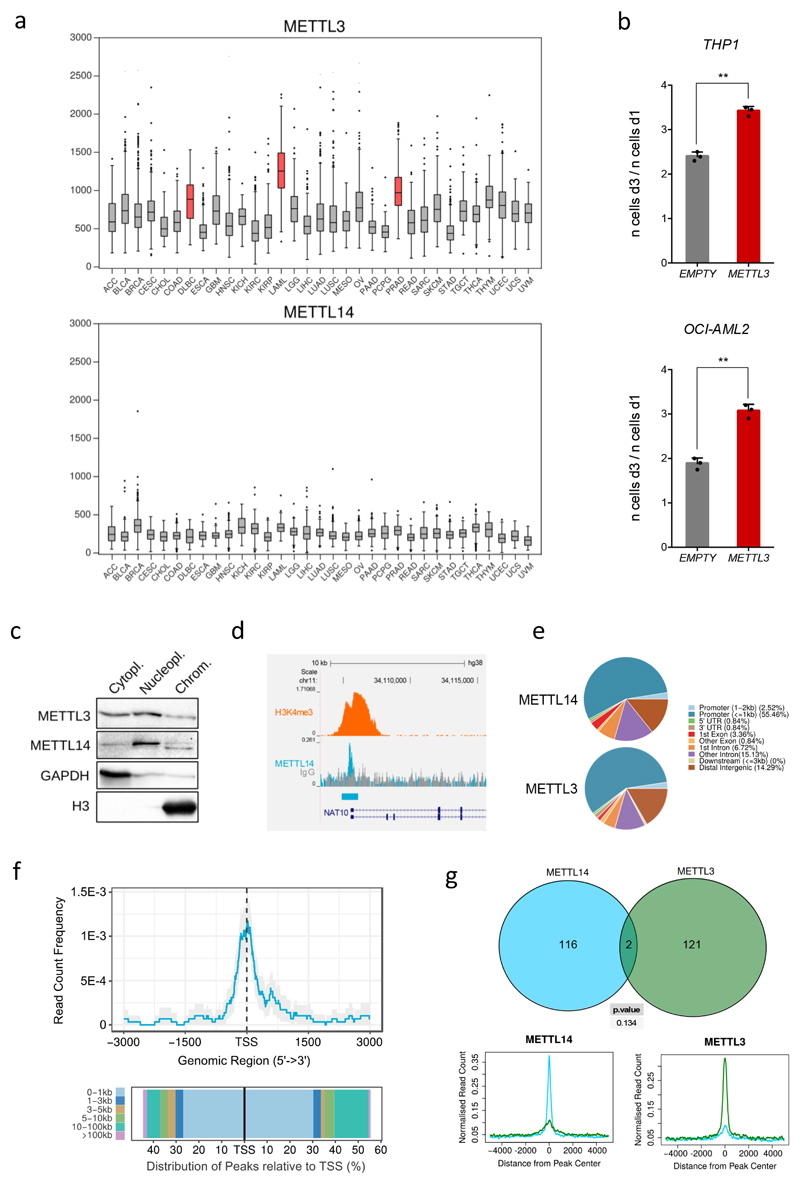
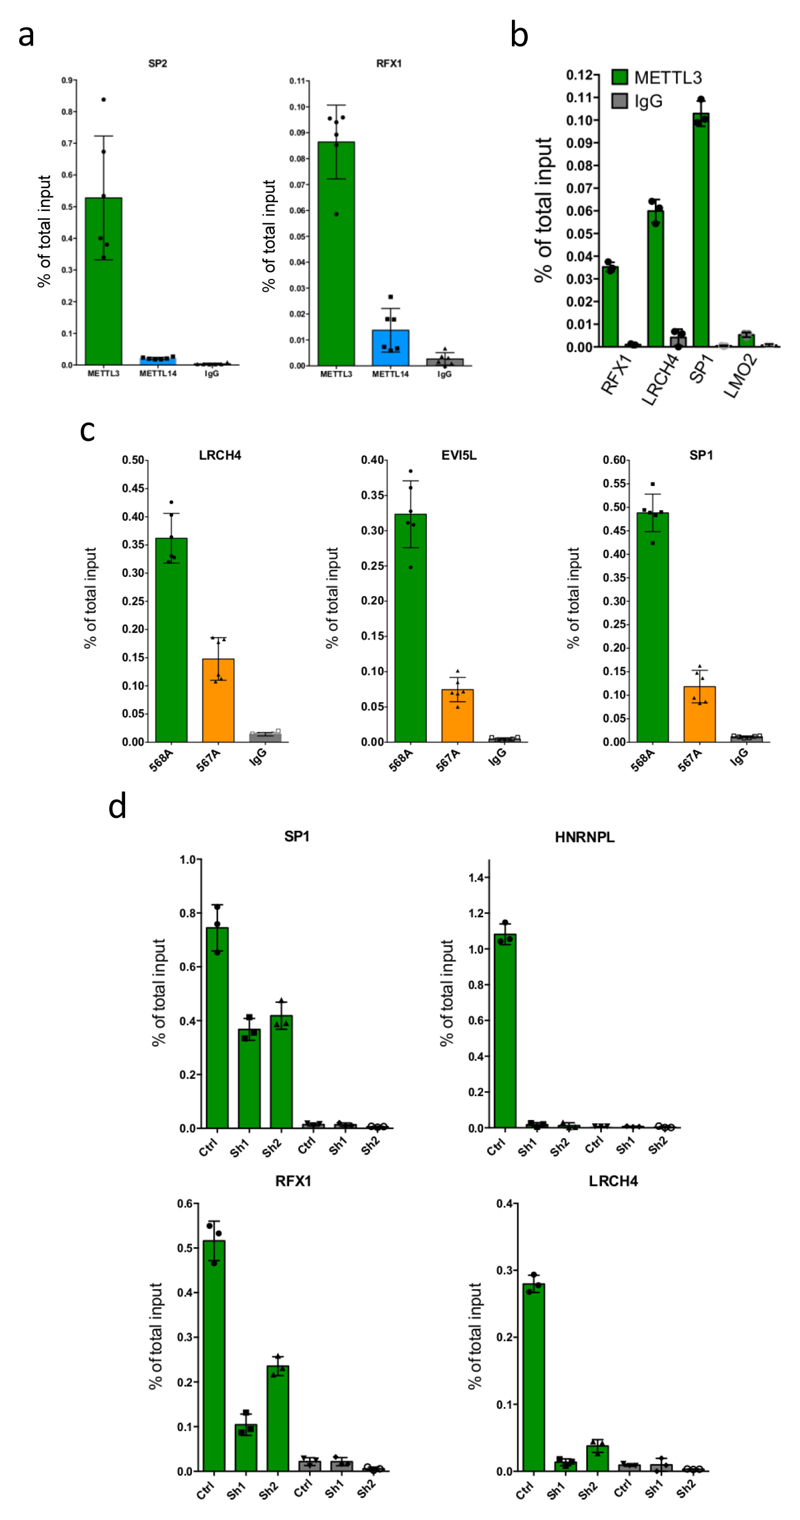
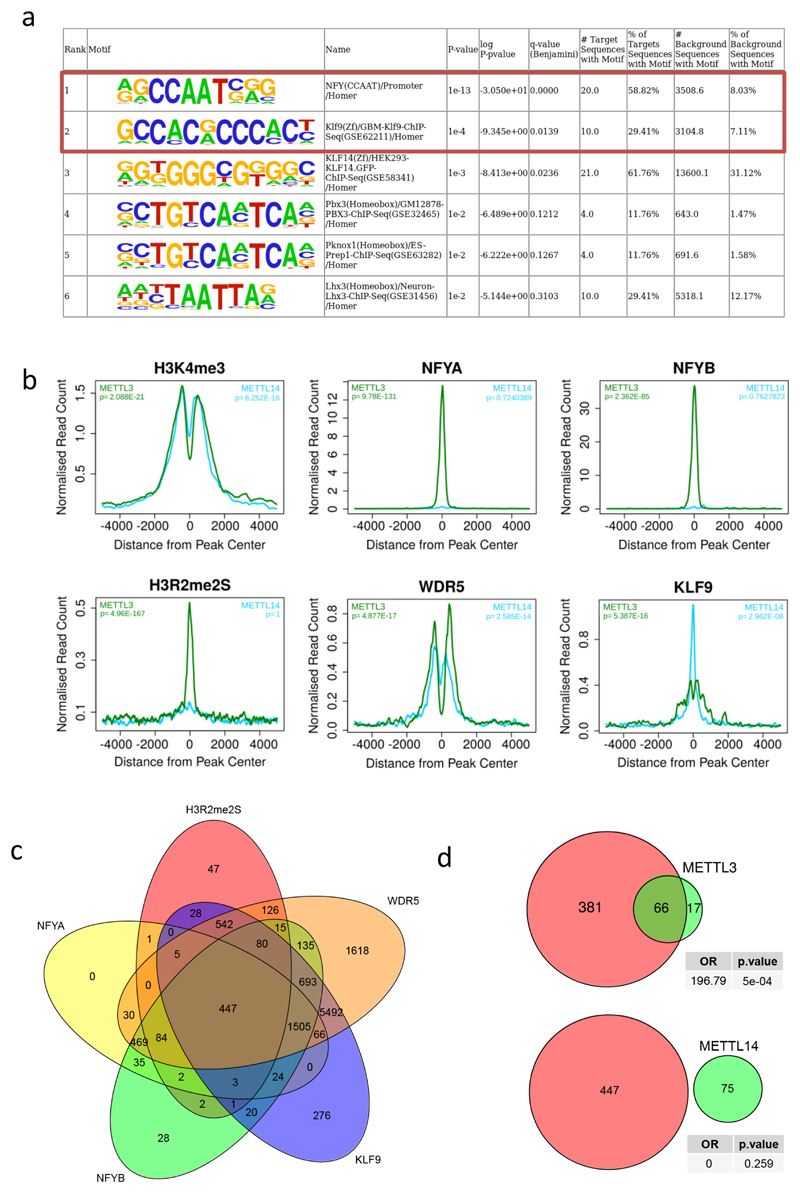
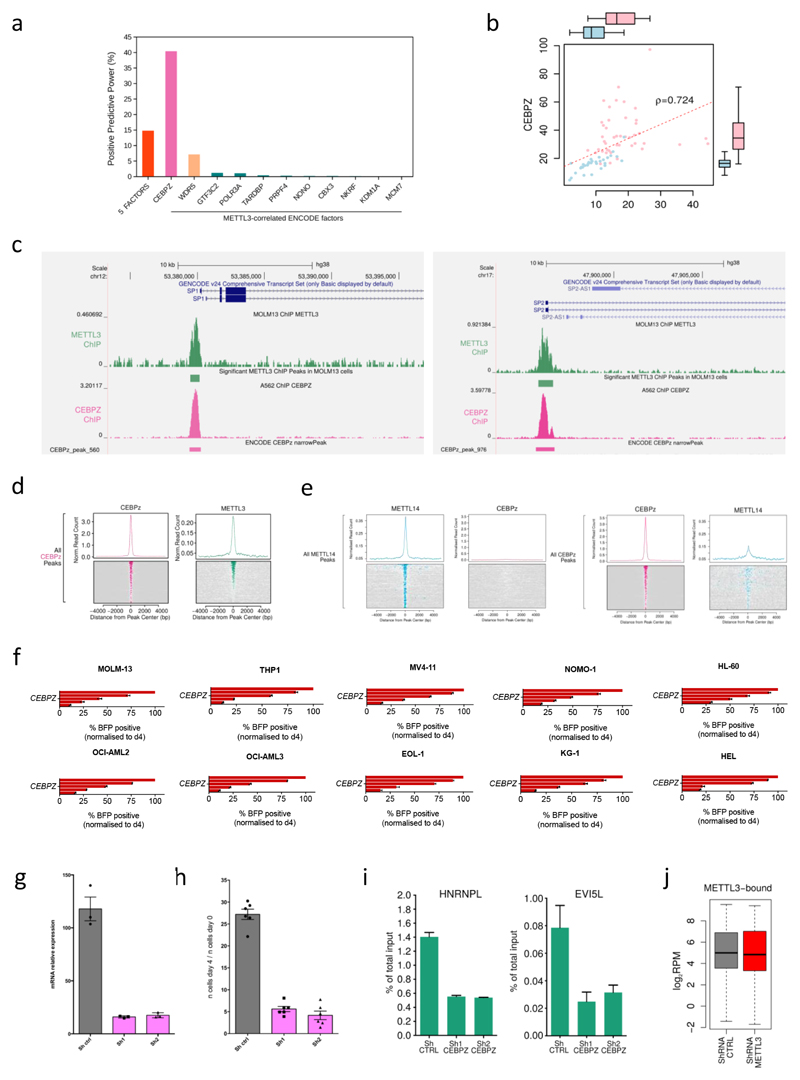
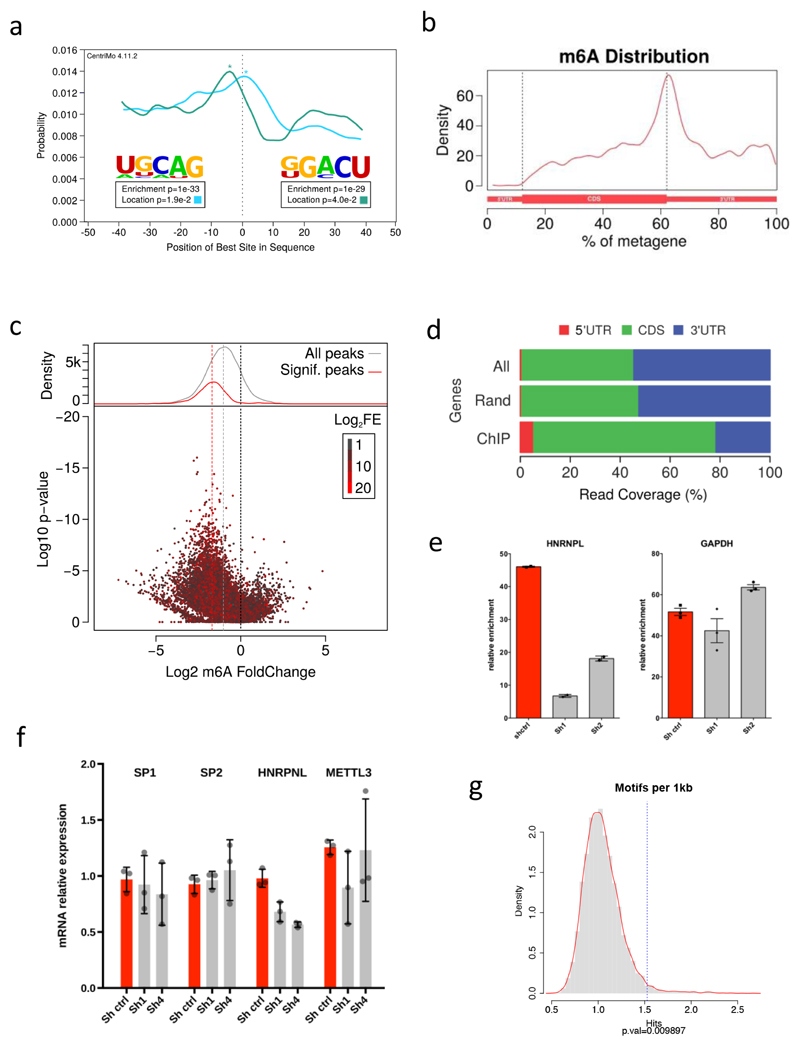
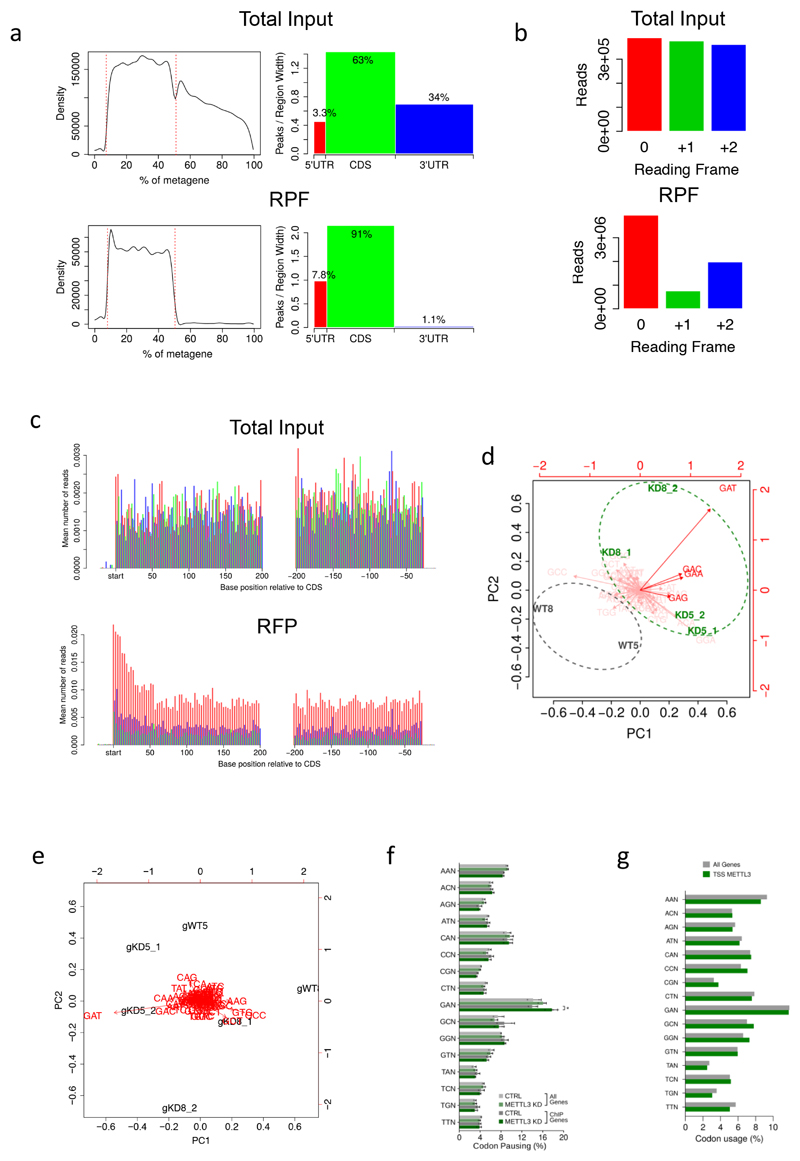
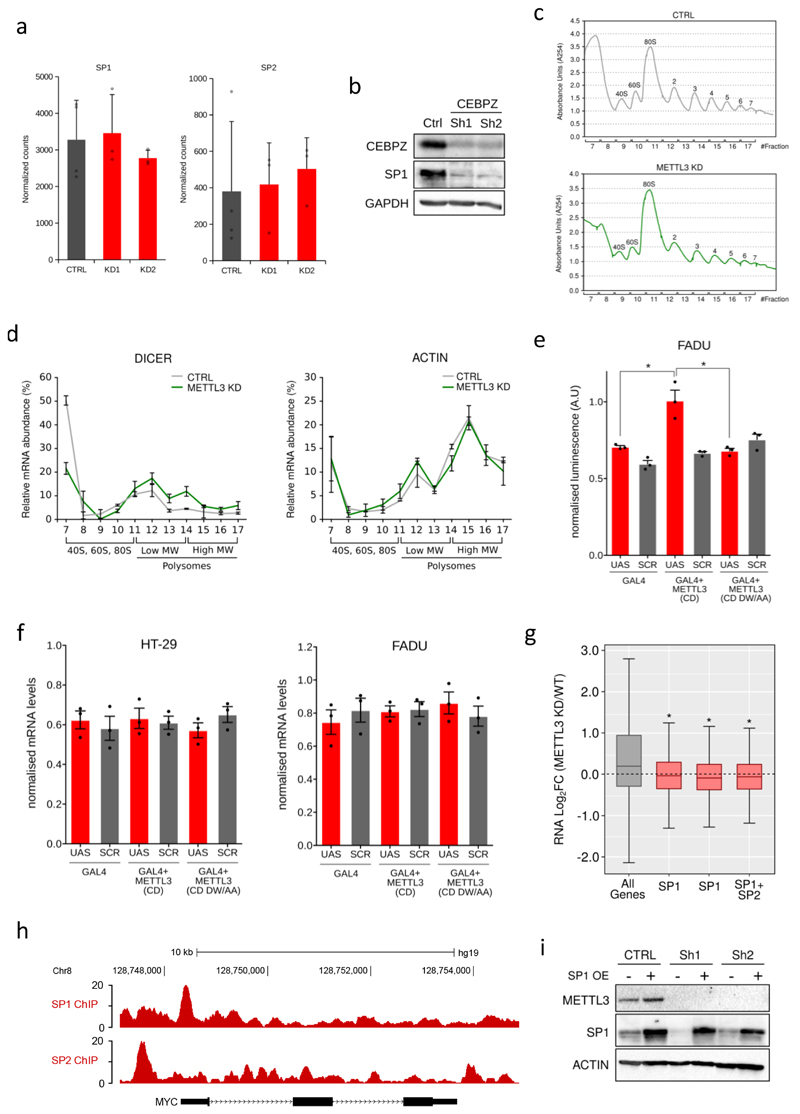
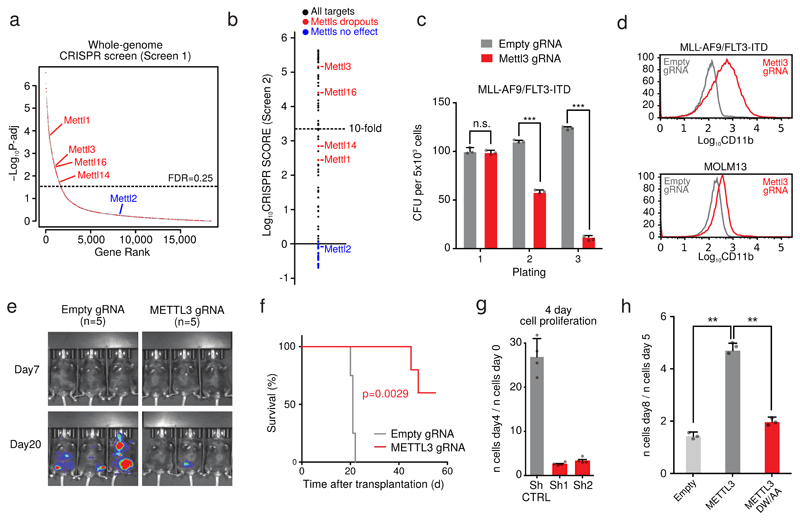
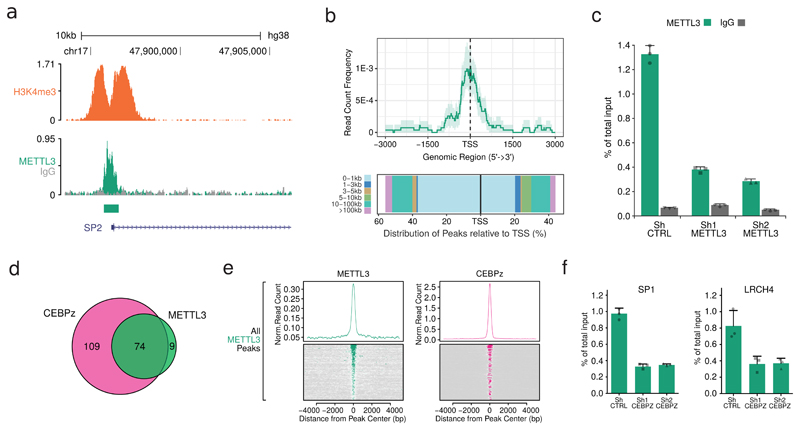
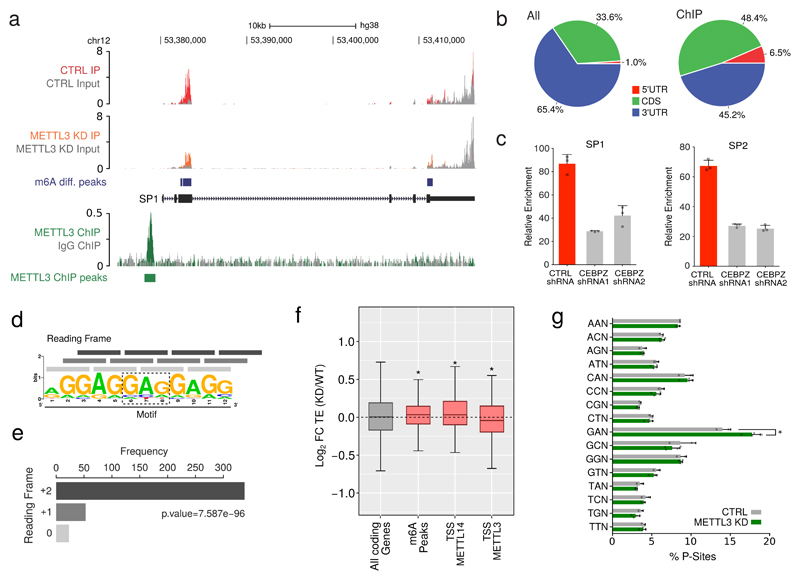
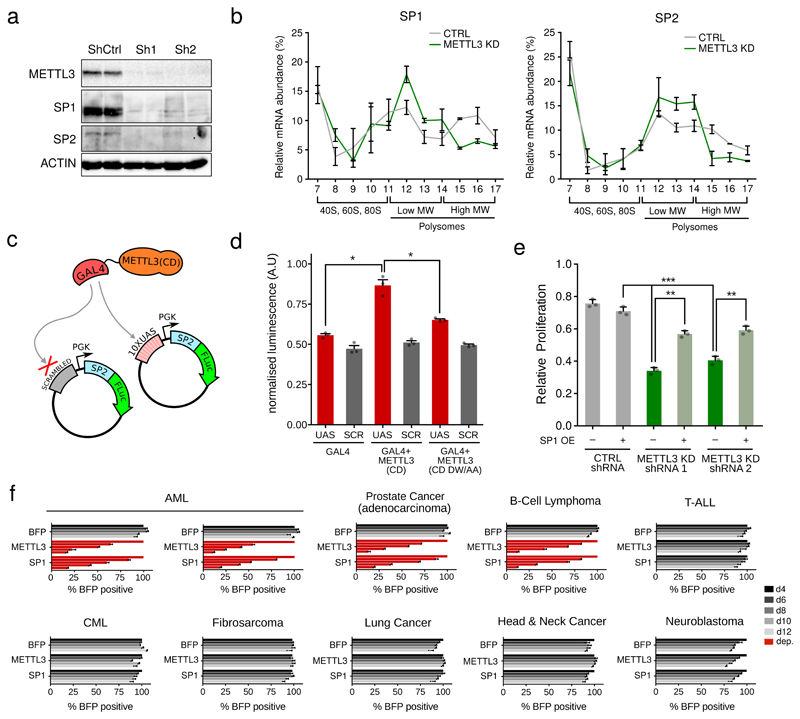
N6-methyladenosine (m6A) is an abundant internal RNA modification in both coding and non-coding RNAs that is catalysed by the METTL3-METTL14 methyltransferase complex. However, the specific role of these enzymes in cancer is still largely unknown. Here we define a pathway that is specific for METTL3 and is implicated in the maintenance of a leukaemic state. We identify METTL3 as an essential gene for growth of acute myeloid leukaemia cells in two distinct genetic screens. Downregulation of METTL3 results in cell cycle arrest, differentiation of leukaemic cells and failure to establish leukaemia in immunodeficient mice. We show that METTL3, independently of METTL14, associates with chromatin and localizes to the transcriptional start sites of active genes. The vast majority of these genes have the CAATT-box binding protein CEBPZ present at the transcriptional start site, and this is required for recruitment of METTL3 to chromatin. Promoter-bound METTL3 induces m6A modification within the coding region of the associated mRNA transcript, and enhances its translation by relieving ribosome stalling. We show that genes regulated by METTL3 in this way are necessary for acute myeloid leukaemia. Together, these data define METTL3 as a regulator of a chromatin-based pathway that is necessary for maintenance of the leukaemic state and identify this enzyme as a potential therapeutic target for acute myeloid leukaemia.


Conflict of interest statement

Competing financial interests

T.K. is a co-founder of Abcam Plc and Storm Therapeutics Ltd, Cambridge, UK.

A.H. is an employee of Storm Therapeutics Ltd, Cambridge, UK.

Figures

Extended Data Figure 1
Extended Data Figure 1. Validation of CRISPR screens.
(Related to Figure 1) a) Correlation between gene rankings from the two independent CRISPR-Cas9 screens. Goodness of fit is calculated as Pearson Correlation Coefficient. b) Average ratio of the percentage of GFP positive RN2C cells between day 2 and day 10 after infection with lentiviral vectors expressing GFP and individual gRNAs against the indicated targets. The mean +S.E.M. depletion of 3 different gRNAs against the catalytic domain of the targets is shown. gRNA targeting the Rosa26 locus was a negative control. Rpa (replication protein A) is a positive control. c) Competitive co-culture assay showing negative selection of BFP+ MOLM13 or MLL-AF9 primary mouse cells upon targeting of METTL3 by CRISPR-Cas9. Cells were transduced with lentiviruses expressing four different gRNAs targeting the 5’ exons or the catalytic domain of METTL3 and the BFP-positive fraction was compared with the non-transduced population. Results were normalized to those at day 4 for each gRNA. The mean ±S.D. of two independent infections is shown. d) Colony forming assay of MLL-ENL/FLT3-ITD Cas9-expressing cells targeting METTL3 (catalytic domain-specific) or CTRL showing decreased replating ability. CFU: colony forming units (***p< 0.001; t-test). The mean +S.D. of three independent experiments is shown. e) Average ratio of the percentage of GFP positive NIH-3T3 mouse fibroblasts between day 2 and day 12 after infection with lentiviral vectors expressing GFP and individual gRNAs against the indicated targets. The mean ±S.E.M. depletion of 3 different gRNAs against the catalytic domain of the targets is shown. Rpa (replication protein A) is a positive control. f) Colony forming assay of lineage negative haematopoietic Cas9-expressing cells targeting METTL3 (catalytic domain-specific; right panel) or CTRL. CFU: colony forming units (***p< 0.001; t-test). The mean +S.D. of three independent experiments is shown. g) Competitive co-culture assay showing negative selection of BFP+ AML cell lines upon targeting of METTL3, METTL1, METTL14 and METTL16 by CRISPR-Cas9 using two independent gRNAs for each target. Cells were transduced with lentiviruses expressing BFP and four different gRNAs targeting the 5’ exons or the catalytic domain of each target and the BFP-positive fraction was compared with the non-transduced population. Results were normalized to those at day 4 for each gRNA. The mean +S.D. of two independent infections is shown.
Extended Data Figure 2
Extended Data Figure 2. Effects of targeting METTL factors In human cancer cell lines.
(Related to Figure 1) a) Competitive co-culture assay showing negative selection of BFP+ human cancer cell lines upon targeting of METTL3, METTL1, METTL14 and METTL16 by CRISPR-Cas9 using two independent gRNAs for each target. The experiment was performed as described above. b) Efficiency of genome editing for gRNAs targeting METTL3, METTL1, METTL14 and METTL14 was measured across the indicated 20 human cell lines through TIDE analysis. Efficiency of targeting was also measured in mouse primary cell lines for gRNAs targeting Mettl3. c) CD11b expression in METTL3 (catalytic domain-specific) targeted cells (THP1 human cell line) was measured by flow cytometry 6 days after infection. d) Haematoxylin eosin staining of human and mouse AML cell lines infected with a control gRNA or gRNAs targeting the catalytic domain of METTL3. e) Time course quantification of luminescence from mice transplanted with luciferase-labelled MOLM13 cells targeting METTL3 using gRNAs specific for the catalytic domain or CTRL (***p < 0.001).
Extended Data Figure 3
Extended Data Figure 3. METTL3 depletion in AML human cell lines leads to cell cycle arrest.
(Related to Figure 1) a) METTL3 mRNA levels detected by RT-qPCR 4 days after shRNAs induction with doxycycline in MOLM13 cells. The mean ±S.E.M. of four independent cultures is shown. b) Western blot showing METTL3 and H3 levels in MOLM13 cells infected with specific or CTRL TET-inducible shRNAs 5 days after doxycycline treatment. For gel source data see Supplementary Information. c) METTL3 mRNA levels detected by RT-qPCR 4 days after shRNA induction with doxycyxline in THP1 cells (left panel). The mean ±S.E.M. of three independent cultures is shown. A proliferation assay of the cells was then performed with cell numbers measured between day 0 (4d post doxycycline) and day 4 (8d post doxycycline) (right panel). The mean ±S.D. of two independent replicates is shown. d) Western blot for METTL3 and actin in mouse AML cells. MPN1c/Flt3ltd/+/Rosa26Cas9/+ mouse AML cells were transduced with gRNAs targeting the catalytic domain of Mettl3 and plasmids expressing either wild type METTL3 or a catalytically inactive mutant (DW/AA). For gel source data see Supplementary Information. e) Volcano plots for CTRL vs METTL3 KD samples, showing the significance p-value (log10) versus. Fold Change (log2) of gene expression. Significantly upregulated and downregulated transcripts are shown in red (|logFC|>1, p<0.001, FDR<0.01). f) Graphical representation of KEGG pathways regulation showing cell cycle down-regulation (upper panel) and haematopoietic differentiation up-regulation (lower panel) as obtained by comparing RNA-seq derived from METTL3 KD and CTRL MOLM13 cells (up-regulated genes: red; down-regulated genes: green).
Extended Data Figure 4
Extended Data Figure 4. METTL3 is overesxpressed in human AML and it is recruited on chromatin.
(Related to Figure 1 and 2) a) METTL3 (top panel) and METTL14 (lower panel) mRNA expression levels across cancer types from the TCGA database. b) Proliferation assay of human AML cell lines upon transduction with a vector expressing METTL3. Cell numbers were measured between day 1 and day 3 after electroporation. The mean +S.D. of three independent replicates is shown. c) Western blot for METTL3 and METTL14, GAPDH and histone H3 on cytoplasmic, nucleoplasmic and chromatin fractions from MOLM13 cells. For gel source data see Supplementary Information. d) Genomic browser screenshot of METTL14 and H3K4me3 normalised ChIP-seq datasets on the human SP2 gene locus from MOLM13 cells. e) Pie charts of genomic regions associated with METTL14 (top) and METTL3 (bottom) ChIP-seq peaks. f) Distribution of METTL14 ChIP-seq reads centred on TSSs (upper panel) and histogram of ChIP-seq reads distribution relative to TSSs (lower panel). g) Top: Venn diagram showing the overlap between METTL3 and METTL14 peak datasets (statistical significance was evaluated by a χ2-test). Bottom: Distribution of METTL3 and METTL14 ChIP-seq reads centred on METTL14 (left panel) or METTL3 (right panel) peaks.
Extended Data Figure 5
Extended Data Figure 5. Validation of METTL3 ChIP-seq.
(Related to Figure 2) a) ChIP-seq validation by ChIP-qPCR of METTL3 and METTL14 binding on the SP2 and RFX1 loci. The mean of six technical replicates ±S.D. is shown. The experiment was performed independently three times. b) METTL3 ChIP-seq validation by ChIP-qPCR on the indicated loci. The LMO2 promoter was used as a negative control. The mean of three technical replicates ±S.D. is shown. The experiment was performed independently three times. c) METTL3 ChIP-seq validation by ChIP-qPCR on the indicated TSSs using two independent METTL3 antibodies in MOLM13 cells. The mean of six technical replicates ±S.D. is shown. The experiment was performed independently three times. d) METTL3 ChIP-seq validation by ChIP-qPCR on the indicated TSS in CTRL or METTL3 KD MOLM13 cells, showing a specific reduction of METTL3 binding in KD cells. The mean of three technical replicates ±S.D. is shown. The experiment was performed independently three times.
Extended Data Figure 6
Extended Data Figure 6. METTL3 colocalise with a defined set of chromatin factors.
(Related to Figure 2) a) Motif discovery analysis of the genomic sequences under METTL3 ChIP-seq peaks using HOMER. Significance was obtained using a hypergeometric test. b) Distribution of ChIP-seq reads for the indicated factors or histone modifications, centred on METTL3 (green) and METTL14 (blue) ChIP peaks. Statistical significance of the binary overlap was evaluated by a χ2-test. c) Venn diagram showing the overlap of H3R2me2s, WDR5, KLF9, NFYA and NFYB ChIP-seq peaks after filtering for H3K4me3 promoters. d) Venn diagram showing significant overlap between METTL3 but not METTL14 peaks with the 447 loci carrying all five factors as in panel above. Statistical significance of the binary overlap was evaluated by a χ2-test.
Extended Data Figure 7
Extended Data Figure 7. CEBPZ recruits METTL3 on chromatin.
(Related to Figure 2) a) Histogram representing the positive predictive power of the combined 5 factors compared with the predictive power of the ENCODE factors whose expression levels are tightly correlated with METTL3 expression. b) Correlation between CEBPZ and METTL3 mRNA expression levels in the Human Protein Atlas RNA-seq datasets, including non-transformed (blue) and cancer (pink) cell lines. (ρ= Spearmann correlation coefficient). c) Genomic plot of METTL3 and CEBPZ normalised ChIP-seq datasets on the human SP1 and SP2 gene loci in MOLM13 and K562 cells, respectively. d) Distribution and heatmaps of normalised ChIP-seq reads for METTL3 centred on CEBPZ peaks. e) Distribution and heatmaps of normalised ChIP-seq reads of METTL14 and CEBPZ centred on METTL14 (left panel) and CEBPZ (right panel) peaks. f) Competitive co-culture assay showing negative selection of BFP+ AML cell lines upon targeting of CEBPZ by CRISPR-Cas9 gRNAs. Cells were transduced with lentiviruses expressing a gRNA targeting the first exon of CEBPZ and the BFP-positive fraction was compared with the non-transduced population. Results were normalized to those at day 4. The mean +S.D. of two independent infections is shown. g) CEBPZ mRNA levels detected by RT-qPCR 4 days after shRNA induction with doxycycline in MOLM13 cells. The mean ±S.D. of three independent cultures is shown. h) A proliferation assay of the CEBPZ CTRL and KD cells was performed with cell numbers measured between day 0 (4d post doxycycline) and day 4 (8d post doxycycline). The mean ±S.D. of six independent replicates is shown. i) ChIP-qPCR of METTL3 binding on target TSSs in and MOLM13 cells, expressing a control shRNA or two independent shRNAs against CEBPZ, showing a specific reduction of METTL3 binding in CEBPZ KD cells. The mean of three technical replicates +S.D. is shown. The experiment was performed independently three times. j) Box plot representing the expression levels of METTL3 targets upon METTL3 KD from the dataset shown in Extended Data Figure 3e.
Extended Data Figure 8
Extended Data Figure 8. Validation of the m6A RNA-IP upon METTL3 depletion.
(Related to Figure 3) a) Motif analysis under the identified m6A-IP peaks showing enrichment of the expected UGCAG and GGACU sequences and their central distribution throughout the m6A-IP peaks, as obtained by MEME and CentriMo. b) Distribution of m6A-IP reads throughout the mRNA metatranscript, showing the expected enrichment around the STOP codon in MOML13 cells. c) Scatter plots and density plot showing the general down-regulation of m6A-IP signal upon METTL3 knock-down in MOLM13 cells. d) Histogram showing METTL3–dependent m6A-IP read coverage in mRNAs from METTL3-bound TSSs (ChIP), whole transcriptome (All) or the permutation of random sets of genes (Rand). e) m6A-IP followed by qPCR for m6A peaks of HNRNPL or GAPDH as a control. The plot show the m6A-IP signal over total input in MOLM 13 cells expressing a control shRNA or shRNAs targeting CEBPZ. Mean ±S.D. of three technical replicates are shown; the experiment has been performed independently twice. f) SP1, SP2, HNRNPL and METTL3 mRNA levels detected by RT-qPCR 8 days after doxycycline induction in MOLM13 CTRL or CEBPZ KD cells. The mean ±S.D. of three independent cultures is shown. g) Histogram showing the enrichment of the [GAG]n motif within the transcript sequences of METTL3 ChIP-targets compared with random permutations of genes.
Extended Data Figure 9
Extended Data Figure 9. Ribosome profiling analysis.
(Related to Figure 3) a) Distribution of ribosome profiling reads throughout the mRNA metatranscript from RNA inputs or ribosome-protected fragments (RPF) showing absence of 3’UTR specifically in the RPF dataset. b) Reading frame analysis of ribosome profiling reads from RNA inputs and RPF in MOLM13 cells showing enrichment of the 0 reading frame specifically in the RPF reads. c) Average read alignments to 5' and 3' ends of coding sequences in RNA inputs (upper panel) or RPF (lower panel) showing triplet periodicity and accumulation of reads on the start site typical of cycloheximide pre-treatment. d) Principal component analysis of P-site codon distribution on mRNAs from METTL3-bound TSSs as obtained by ribosome footprinting, 5 or 8 days after doxycycline administration, of METTL3 KD (KD5, KD8) or CTRL (WT5, WT8) MOLM 13 cells. e) Principal component analysis of P-site codon distribution on all mRNAs, as above. f) Frequency of P-site occupancy of codons in METTL3 KD or CTRL MOLM13 cells for either all coding genes or genes harbouring a METTL3 ChIP peak on their promoter (*p<0.05; t-test). g) Frequency of codons within the coding sequence of METTL3 chromatin targets compared with the general frequency throughout the coding transcripts. The plot shows no significant overrepresentation of GAN codons in the METTL3 chromatin targets.
Extended Data Figure 10
Extended Data Figure 10. METTL3 controls the translation of SP1 and SP2.
(Related to Figure 4) a) RNA-seq normalised counts of SP1 and SP2 mRNAs from CTRL or METTL3 KD MOLM13 cells at day 8 after doxycycline induction. Mean +S.D. of at least three biological replicates are shown; b) Western blot showing CEBPZ, SP1 and GAPDH levels in CTRL and CEBPZ KD cells. For gel source data see Supplementary Information. c) Polysome fractionation analysis. Cell extracts from CTRL or METTL3 KD cells were prepared and resolved in 5 to 50 % sucrose gradient. The absorbance at 254 was continuously measured. The peaks corresponding to free 40S and 60S subunits, 80S and polysomes are indicated. d) DICER1 and ACTIN mRNAs in each ribosome fraction were quantified through qPCR and plotted as a percentage of the total. Data are from two independent polysome-profiling experiments. Mean ±S.E.M. are shown. e) Firefly luciferase activity in FADU cell line from UAS or scrambled (SCR) sequence carrying plasmid in presence of GAL4 either alone or fused with METTL3 wild type (CD) or inactive (CD DW/AA) catalytic domain (*p<0.05; t-test). The mean +S.D. of three independent transfections is shown. f) Firefly luciferase mRNA from plasmids carrying UAS or scrambled sequence in presence of GAL4 either alone or fused with METTL3 wild type (CD) or inactive (CD DW/AA) catalytic domain, as evaluated by qPCR. The mean ±S.D. of three replicates is shown. g) Box plot showing transcriptional modulation of genes bound by SP1, SP2 or both between METTL3 KD and CTRL MOLM13 cells (*p<0.05; Wilcoxon test). h) Genomic browser screenshot of SP1 and SP2 normalised ChIP-seq dataset on the human c-MYC gene locus in K562 cells (from ENCODE). i) Western blot showing METTL3, SP1 and ACTIN protein levels in MOLM13 cells infected with METTL3-specific or CTRL TET-inducible shRNAs and with an SP1 expression vector 5 days after doxycycline treatment. For gel source data see Supplementary Information.
Figure 1
Figure 1. METTL3 is essential for AML cells both in vivo and in vitro.
a) Dropout p-values of the genome-wide screen in MLL-AF9/FLT-ITD cells are displayed. Discontinuous blue line shows the 25%FDR threshold. RNA enzymes are shown as red dots. b) CRISPR score for the 75 RNA enzymes (black circles) or the METTL family members (red/blue) as controls in AML-AF9 RN2C cells. c) Colony forming assay of MLL-AF9/FLT3-ITD-Cas9 cells targeted for Mettl3 (catalytic domain-specific) or CTRL showing decreased replating ability. Mean+S.D. of three independent replicates is shown; CFU: colony forming units. (***p< 0.001; t-test). d) CD11b expression in METTL3 (catalytic domain-specific) targeted cells (MLL-AF9/FLT-ITD mouse cells and MOLM13 human cells) was measured by flow cytometry 8 days (mouse) and 6 days (human) after infection. e) Bioluminescence imaging of mice transplanted with luciferase-expressing MOLM13 cells transduced with the indicated gRNAs. f) Kaplan-Meier plot showing the survival time of mice from Fig. 1e. A log rank test was performed. g) Proliferation assay of METTL3 KD or CTRL cells measured between day 4 and day 8 after tetracycline induction. Mean+S.D. of three independent replicates is shown. h) Proliferation assay of MPN1c/Flt3ltd/+/Rosa26Cas9/+ mouse Leukaemia cells transduced with gRNA targeting the catalytic domain of METTL3 and plasmids expressing wild type METTL3 or a catalytically inactive mutant. Mean+S.D. of three independent replicates is shown. (**p< 0.01; t-test).
Figure 2
Figure 2. METTL3 localises on specific TSSs on chromatin.
a) Genomic visualisation of METTL3 and H3K4me3 ChIP-seq dataset at the SP2 locus. b) Distribution of METTL3 ChIP-seq reads centred on TSSs (upper panel) and histogram of ChIP-seq reads distribution relative to TSSs (lower panel). c) METTL3 ChIP-seq validation by ChIP-qPCR on the SP2 TSS in CTRL or METTL3 KD MOLM13 cells, showing a specific reduction of METTL3 binding in KD cells. Mean+S.D. of three technical replicates is shown. The experiment was performed independently three times. d) Venn diagram showing the overlap between CEBPZ and METTL3 ChIP-seq peaks. e) Distribution and heatmaps of normalised ChIP-seq reads for CEBPZ centred on METTL3 peaks. f) ChIP-qPCR of METTL3 binding on target TSSs in and MOLM13 cells, expressing a control shRNA or two independent shRNAs against CEBPZ, showing a specific reduction of METTL3 binding in CEBPZ KD cells. Mean+S.D. of three technical replicates is shown. The experiment was performed independently three times.
Figure 3
Figure 3. Transcripts derived from METTL3-bound promoters harbour m6A whithin their CDS.
a) Genomic visualisation of the m6A-IP normalised signal in METTL3 KD or CTRL MOLM13 cells on the SP1 transcript (upper tracks), along with the genomic visualisation of the METTL3 ChIP-seq. b) Pie charts of the distribution of METTL3-dependent m6A peaks within the whole transcriptome or METTL3 chromatin targets mRNAs. c) m6A-IP followed by qPCR for M6A peaks of SP1, SP2 and HNRNPL or GAPDH as a control. The plot show the m6A-IP signal over total input in MOLM 13 cells expressing a control shRNA or shRNAs targeting CEBPZ. Mean+S.D. of three technical replicates are shown; the experiment has been performed independently twice. d) Motif enriched in mRNAs from METTL3-bound TSSs. e) Reading frame distribution of the [GAG]n motif on the transcripts produced at METTL3-bound TSSs. Significance was obtained by multinomial test. f) Box plot showing the difference in translational efficiency (TE) between METTL3 KD and CTRL cells. The distributions of log2FC(TE) for all coding genes, mRNAs harbouring METTL3-dependent m6A and mRNAs originated from METTL3-bound or METTL14-bound TSSs are shown (*p<0.05; Wilcoxon test). g) Frequency of P-site occupancy of GAN codons in METTL3 KD or CTRL MOLM13 cells (*p<0.05; t-test).
Figure 4
Figure 4. Negative effect of METTL3 depletion on the translation efficiency of genes necessary for AML growth.
a) Western blot showing METTL3, SP1, SP2 and ACTIN protein levels in MOLM13 cells infected with METTL3-specific or CTRL TET-inducible shRNAs 8 days after doxycycline treatment. Two independent biological replicates are shown. For gel source data see Supplementary Information. b) SP1 and SP2 mRNAs in each ribosome fraction were quantified through qPCR and plotted as a percentage of the total. Data are from two independent polysome-profiling experiments. Mean ±SEM are shown..c) Schematic representation of the engineered reporter system. d) Firefly luciferase activity from UAS or scrambled (SCR) sequence carrying plasmid in presence of GAL4 either alone or fused with METTL3 wild type (CD) or inactive (CD DW/AA) catalytic domain (*p<0.05; t-test). The mean +S.D. of three independent transfections is shown, for two different cell lines (HT-29 and FADU) e) Proliferation assay of MOLM13 cells infected with METTL3-specific or CTRL TET-inducible shRNAs and with an SP1 expression vector between day 3 and day 6 after doxycycline treatment. Mean+S.D. of three independent replicates is shown. f) Competitive co-culture assay showing negative selection of BFP+ human tumour cell lines upon targeting of METTL3 or SP1 by CRISPR-Cas9. Results were normalized to day 4 for each gRNA. Mean+S.D. of two independent infections is shown.

Comment in

References

    1. Dominissini D, et al. Topology of the human and mouse m6A RNA methylomes revealed by m6A-seq. Nature. 2012;485:201–206. - PubMed
    1. Alarcón CR, Lee H, Goodarzi H, Halberg N, Tavazoie SF. N6-methyladenosine marks primary microRNAs for processing. Nature. 2015;519:482–485. - PMC - PubMed
    1. Patil DP, et al. m6A RNA methylation promotes XIST-mediated transcriptional repression. Nature. 2016;537:369–373. - PMC - PubMed
    1. Liu J, et al. A METTL3-METTL14 complex mediates mammalian nuclear RNA N6-adenosine methylation. Nat Chem Biol. 2014;10:93–5. - PMC - PubMed
    1. Dunham I, et al. An integrated encyclopedia of DNA elements in the human genome. Nature. 2012;489:57–74. - PMC - PubMed

Publication types

MeSH terms