. 2018 Apr 1;25(2):183-194.
doi: 10.1093/dnares/dsx048.

Construction of PRDM9 allele-specific recombination maps in cattle using large-scale pedigree analysis and genome-wide single sperm genomics

Affiliations

Construction of PRDM9 allele-specific recombination maps in cattle using large-scale pedigree analysis and genome-wide single sperm genomics

Yang Zhou et al. DNA Res. .

Abstract

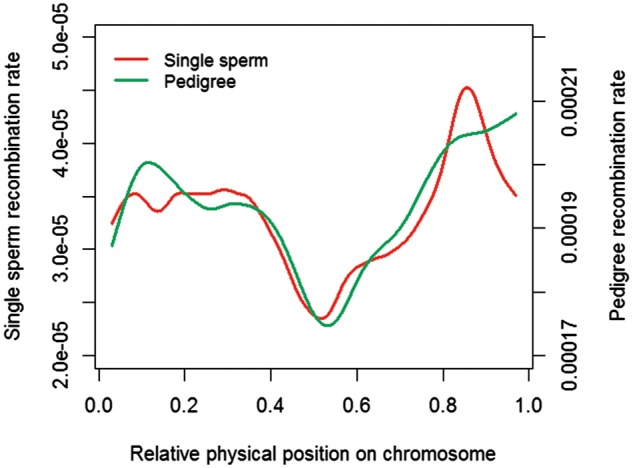
PRDM9 contributes to hybrid sterility and species evolution. However, its role is to be confirmed in cattle, a major domesticated livestock species. We previously found an association near PRDM9 with cattle recombination features, but the causative variants are still unknown. Using millions of genotyped cattle with pedigree information, we characterized five PRDM9 alleles and generated allele-specific recombination maps. By examining allele-specific recombination patterns, we observed the impact of PRDM9 on global distribution of recombination, especially in the two ends of chromosomes. We also showed strong associations between recombination hotspot regions and functional mutations within PRDM9 zinc finger domain. More importantly, we found one allele of PRDM9 to be very different from others in both protein composition and recombination landscape, indicating the causative role of this allele on the association between PRDM9 and cattle recombination. When comparing recombination maps from sperm and pedigree data, we observed similar genome-wide recombination patterns, validating the quality of pedigree-based results. Collectively, these evidence supported PRDM9 alleles as causal variants for the reported association with cattle recombination. Our study comprehensively surveyed the bovine PRDM9 alleles, generated allele-specific recombination maps, and expanded our understanding of the role of PRDM9 on genome distribution of recombination.


Figures

Figure 1.
Figure 1.
PRDM9 alleles and ZnF arrays in Holstein and Jersey cattle. (a) Allele and ZnF array information in Holstein and Jersey cattle. ZnF arrays were coded from A to J according to the full length amino acid composition, and the three important sites were shown (–1, 3 and 6) that may be same for different ZnF arrays. Alleles were coded from allele 1 to allele 5 based on their ZnF array composition. (b) PRDM9 gene structure and comparison between non-allele 5 and allele 5. Four domains (KRAB, SET, single ZnF, 6 to 7 ZnF repeats) were present in bovine PRDM9. Allele 5 was perfectly linked with the minor allele of the SNP at Chr1: 45112924 (R2 = 1). Comparing between non-allele 5 and allele 5, amino acid frequencies at each positions were shown as proportional to the size of the letters (one ZnF includes 28 amino acids). Positions with different amino acid components between allele 5 and other alleles were highlighted by “*”.
Figure 2.
Figure 2.
PRDM9 allele-specific distribution of recombination rate along a chromosome in males and females in Holstein. (a) Recombination patterns of five alleles in males. (b) Recombination patterns of five alleles in females. (c) Recombination patterns of three genotypes of allele 5 in males. (d) Recombination patterns of three genotypes of allele 5 in females. The relative physical position on a chromosome is used, where zero corresponding to the beginning of a chromosome and one the end. The smooth spline model was fitted across all of the 29 autosomes.
Figure 3.
Figure 3.
PRDM9 allele 5 dependent recombination hotspots in two sexes. (a) Non-allele 5 v.s. allele 5 homozygote in males. (b) Non-allele 5 v.s. allele 5 homozygote in females. (c) Non-allele 5 v.s. allele 5 heterozygote in males. (d) Non-allele 5 v.s. allele 5 heterozygote in females. (e) Allele 5 heterozygote v.s. allele 5 homozygote in males. (f) Allele 5 heterozygote v.s. allele 5 homozygote in females. For each panel, recombination rates in each SNP intervals of two groups were shown in the top half and corresponding P-values were shown in the bottom half. Different colors were used to distinguish the 29 chromosomes.
Figure 4.
Figure 4.
Spline-smoother plot of recombination rate along the chromosome from single sperm data and pedigree data. The relative physical position on a chromosome is used, where zero corresponding to the beginning of a chromosome and one the end. The smooth spline model was fitted across all of the 29 chromosomes. Due to the differences in SNP density, the single sperm and pedigree recombination rates were plotted in different scales.

References

    1. Barton N.H., Charlesworth B.. 1998, Why sex and recombination?, Science, 281, 1986–90. - PubMed
    1. Stumpf M.P., McVean G.A.. 2003, Estimating recombination rates from population-genetic data, Nat. Rev. Genet., 4, 959–68. - PubMed
    1. Kauppi L., Jeffreys A.J., Keeney S.. 2004, Where the crossovers are: recombination distributions in mammals, Nat. Rev. Genet., 5, 413–24. - PubMed
    1. Coop G., Przeworski M.. 2007, An evolutionary view of human recombination, Nat. Rev. Genet., 8, 23–34. - PubMed
    1. Paigen K., Petkov P.. 2010, Mammalian recombination hot spots: properties, control and evolution, Nat. Rev. Genet., 11, 221–33. - PMC - PubMed

Substances