. 2018 Apr;68(4):265-287.
doi: 10.1080/10962247.2017.1401017.

Changes in extreme events and the potential impacts on human health

Affiliations

Changes in extreme events and the potential impacts on human health

Jesse E Bell et al. J Air Waste Manag Assoc. 2018 Apr.

Abstract

Extreme weather and climate-related events affect human health by causing death, injury, and illness, as well as having large socioeconomic impacts. Climate change has caused changes in extreme event frequency, intensity, and geographic distribution, and will continue to be a driver for change in the future. Some of these events include heat waves, droughts, wildfires, dust storms, flooding rains, coastal flooding, storm surges, and hurricanes. The pathways connecting extreme events to health outcomes and economic losses can be diverse and complex. The difficulty in predicting these relationships comes from the local societal and environmental factors that affect disease burden. More information is needed about the impacts of climate change on public health and economies to effectively plan for and adapt to climate change. This paper describes some of the ways extreme events are changing and provides examples of the potential impacts on human health and infrastructure. It also identifies key research gaps to be addressed to improve the resilience of public health to extreme events in the future.

Implications: Extreme weather and climate events affect human health by causing death, injury, and illness, as well as having large socioeconomic impacts. Climate change has caused changes in extreme event frequency, intensity, and geographic distribution, and will continue to be a driver for change in the future. Some of these events include heat waves, droughts, wildfires, flooding rains, coastal flooding, surges, and hurricanes. The pathways connecting extreme events to health outcomes and economic losses can be diverse and complex. The difficulty in predicting these relationships comes from the local societal and environmental factors that affect disease burden.


Figures

Figure 1.
Figure 1.
The location and type of the 15 weather and climate disasters in 2016 with losses exceeding $1 billion (NCEI 2017).
Figure 2.
Figure 2.
Time series showing the number (bar height) and type (bar color) of billion-dollar weather and climate disasters in the United States since 1980. The gray line shows total annual costs. The black line shows the running 5-year average. All cost lines CPI-adjusted to 2016 dollars (NCEI 2017).
Figure 3.
Figure 3.
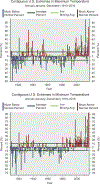
Annual percentage of the United States with maximum temperatures (upper graph) and minimum temperatures (lower graph) much above normal (upper 10th percentile; red) and much below normal (lower 10th percentile; blue). Updated from Gleason et al. (2008).
Figure 4.
Figure 4.
Annual time series (1895–2016) of heat-wave index averaged over United States. Heat-wave events are defined as 4-day periods with the average temperature exceeding the threshold for a 1-in-5-years recurrence interval. The heat-wave time series is dominated by the events of the 1930s. The heat during this period was exacerbated by severe drought and poor land management practices, which denuded large areas of vegetation in the Great Plains. Thus, the normal cooling afforded by transpiration from vegetation was largely absent. The period from the mid 1950s through the 1970s was characterized by a very low number of events. Since then, there has been a gradual increase in the number of events. Over the past 10 years, values have been near to above normal. Bold horizontal line at 0.20 indicates the long-term average. Figure inset shows the trend in heat-wave index over the United States during 1950–2016. (Data source: NOAA’s NCEI.)
Figure 5.
Figure 5.
Annual time series (1895–2016) of cold-wave index averaged over United States. Cold-wave events are defined as 4-day periods with the average temperature being less than the threshold for a 1-in-5-years recurrence interval. The cold-wave time series exhibits high year-to-year variability. This reflects the occasional occurrence of intensely cold air masses usually originating in Siberia that affect large swaths of the United States. The large area covered by these infrequent events dominates the time series. The intense cold causes a wide range of severe impacts. A key feature of this time series is the rather low values since the mid 1990s. Since then, there have been no cold waves with the intensity and areal coverage that are characteristic of the historic cold waves in the earlier record. Bold horizontal line at 0.20 indicates the long-term average. Figure inset shows the trend in cold wave index over the United States during 1895–2016. (Data source: NOAA’s NCEI.)
Figure 6.
Figure 6.
Annual time series (1895–2016) of extreme precipitation index averaged over United States. Extreme precipitation events are defined as rainfall accumulations over 4-day periods exceeding the threshold for a 1-in-5-years recurrence interval. Bold horizontal line at 0.20 indicates the long-term average. Figure inset shows the trend in extreme precipitation over the United States during 1895–2016. (Data source: NOAA’s NCEI.)

Similar articles

Cited by

References

    1. Abatzoglou JT, and Park Williams A 2016. Impact of anthropogenic climate change on wildfire across western US forests. Proceedings of the National Academy of Sciences 113 (42):11770–75. - PMC - PubMed
    1. Albertine JM, Manning WJ, DaCosta M, Stinson KA, Muilenberg ML, and Rogers CA 2014. Projected carbon dioxide to increase grass pollen and allergen exposure despite higher ozone levels. PLoS One 9 (11):e111712. - PMC - PubMed
    1. Alderman K, Turner LR, and Tong S 2012. Floods and human health: A systematic review. Environment International 47:37–47. - PubMed
    1. Anderson BG, and Bell ML 2009. Weather-related mortality: How heat, cold, and heat waves affect mortality in the United States. Epidemiology 20 (2):205–13. doi:10.1097/EDE.0b013e318190ee08. - DOI - PMC - PubMed
    1. Anderson GB, and Bell ML 2012. Lights out: Impact of the August 2003 power outage on mortality in New York, NY. Epidemiology (Cambridge, Mass.) 23 (2):189. - PMC - PubMed

Publication types

LinkOut - more resources