. 2017 Nov 28;21(9):2348-2356.
doi: 10.1016/j.celrep.2017.11.008.

Cellular and Molecular Anatomy of the Human Neuromuscular Junction

Affiliations

Cellular and Molecular Anatomy of the Human Neuromuscular Junction

Ross A Jones et al. Cell Rep. .

Abstract

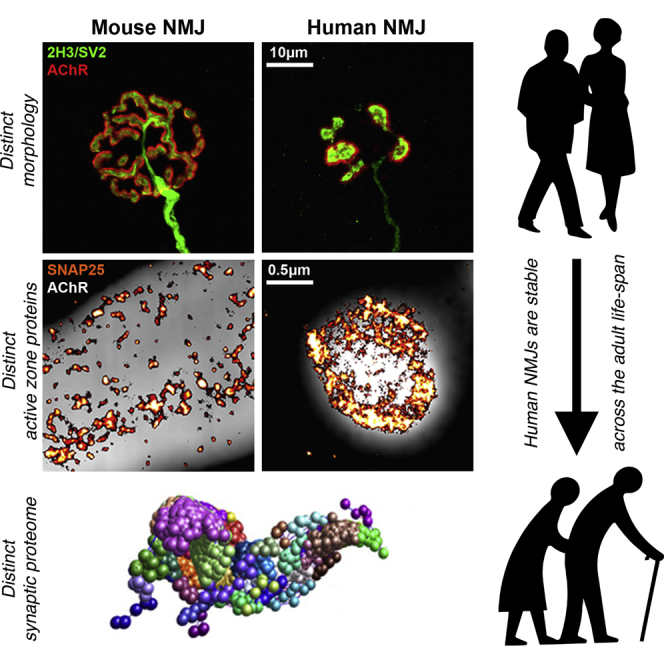
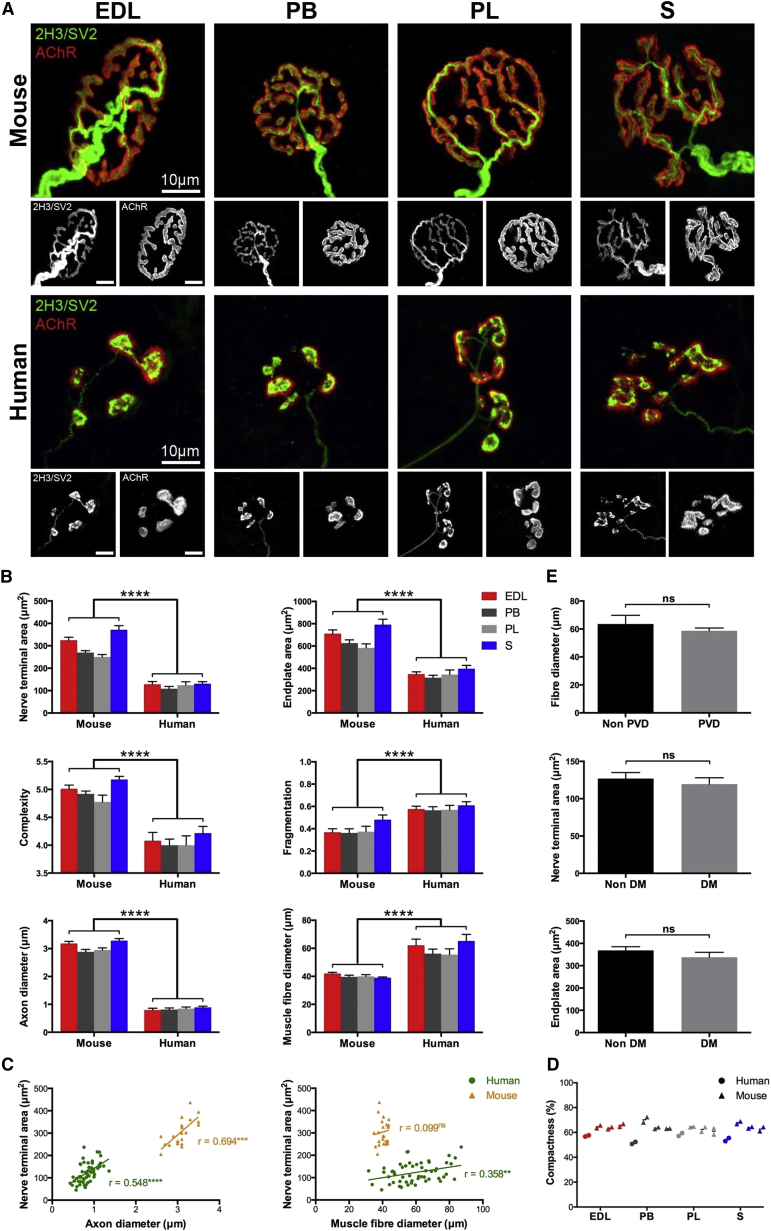
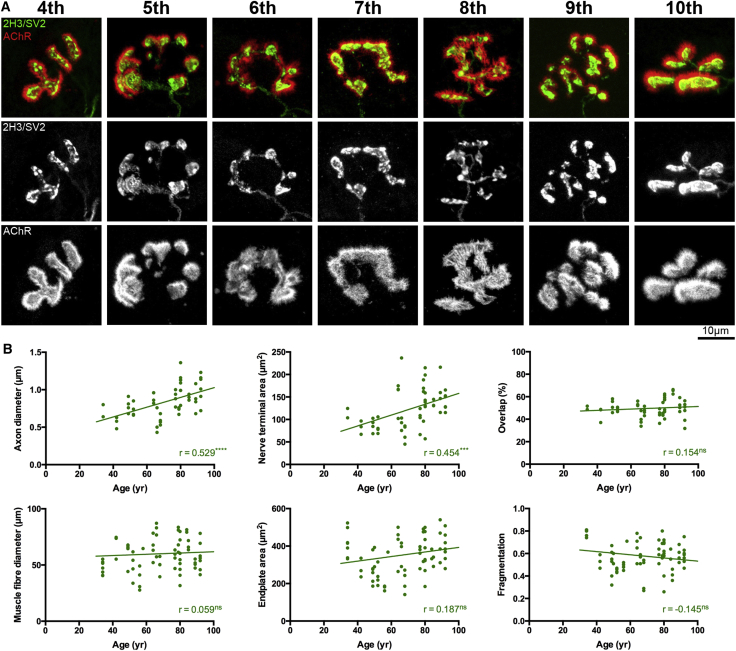
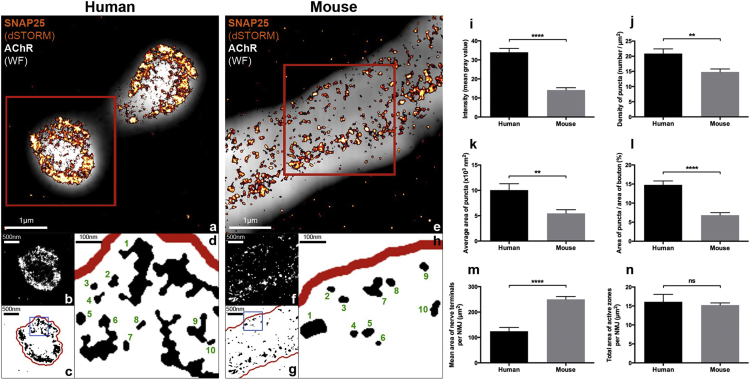
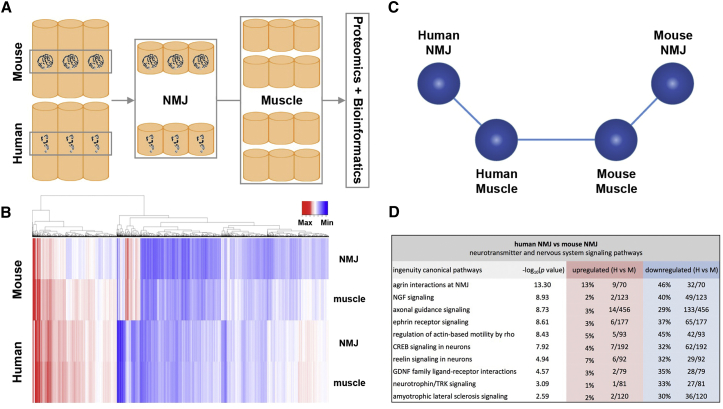
The neuromuscular junction (NMJ) plays a fundamental role in transferring information from lower motor neuron to skeletal muscle to generate movement. It is also an experimentally accessible model synapse routinely studied in animal models to explore fundamental aspects of synaptic form and function. Here, we combined morphological techniques, super-resolution imaging, and proteomic profiling to reveal the detailed cellular and molecular architecture of the human NMJ. Human NMJs were significantly smaller, less complex, and more fragmented than mouse NMJs. In contrast to mice, human NMJs were also remarkably stable across the entire adult lifespan, showing no signs of age-related degeneration or remodeling. Super-resolution imaging and proteomic profiling revealed distinctive distribution of active zone proteins and differential expression of core synaptic proteins and molecular pathways at the human NMJ. Taken together, these findings reveal human-specific cellular and molecular features of the NMJ that distinguish them from comparable synapses in other mammalian species.

Keywords: active zone; aging; comparative anatomy; human; mouse; nervous system; neuromuscular junction; proteomics; super-resolution imaging; synapse.


Figures

None
Graphical abstract
Figure 1
Figure 1
Unique Morphology of the Human NMJ (A) Representative confocal micrographs from 4 lower limb muscles. Human NMJs are smaller, with a thinner axon, less complex nerve terminals and a distinctive “nummular” endplate. Scale bar, 10 μm. (B) Bar charts demonstrating significant species-specific differences across a range of pre- and post-synaptic variables. Each bar represents the mean (±SEM) of >600 human NMJs (and 240 mouse NMJs). Unpaired t test and Mann-Whitney test. (C) Scatterplots showing correlation between nerve terminal area and axon/muscle fiber diameter. Each data point is an individual muscle (mean of 40 NMJs) (72 human and 24 mouse muscles). NMJ morphology was more closely correlated with structural features of the pre-synaptic cell (motor axon) in both species. Pearson correlation. (D) Left/right muscles pairs from the same human case were compared with 3 mouse controls. Each data point (in the pair) is an individual muscle (left or right); the intervening line is the mean of the 2 sides. Laterality did not influence NMJ morphology in either species. (E). Effect of co-morbidities on human NMJ morphology. No significant morphological differences could be attributed to either diabetes mellitus (DM) or peripheral vascular disease (PVD). Unpaired t tests. ∗∗∗∗p < 0.0001, ∗∗∗p < 0.001, ∗∗p < 0.01, p < 0.05.
Figure 2
Figure 2
The Human NMJ Is Stable across the Lifespan (A) Representative confocal micrographs of human NMJs from the 4th to the 10th decades of life (all from peroneus longus muscle). Despite the heterogeneity of individual NMJs, the overall appearance is conserved across the 70+ year age range. Scale bar, 10 μm. (B) Scatterplots showing correlations between age and a range of individual pre- and post-synaptic NMJ variables. Data are pooled across the 4 muscle groups (72 individual muscles). Each data point is an individual muscle (mean of 40 NMJs). Although 2 of the pre-synaptic variables shown correlated with age (a modest increase in the size of the pre-synaptic axon and motor nerve terminal), overall synaptic morphology remained remarkably stable. Pearson and Spearman correlation. ∗∗∗∗p < 0.0001, ∗∗∗p < 0.001.
Figure 3
Figure 3
Comparative Super-Resolution (dSTORM) Imaging of the Active Zone Protein SNAP25 at Human and Mouse NMJs (A and E) Composite images of SNAP25-labeled nerve terminals (dSTORM, orange/red) overlaid on BTX-labeled AChRs of the motor endplate (wide-field, gray). Note that (A) only shows two single synaptic boutons from the human NMJ (not the whole NMJ), and (B) only shows a sub-region of one single synaptic bouton from the mouse NMJ (again not the whole NMJ). Scale bars, 1 μm. (B and F) 8-bit greyscale images of single boutons (representing the areas contained within the red boxes in A and E) used to quantify intensity of labeling (I). Note the increased intensity and density of SNAP25 in the human NMJ. Scale bars, 500 nm. (C and G) Despeckled, binary versions of (B) and (F) used to quantify the remaining variables (J–L). The boxed areas have been enlarged (D and H) to depict individual SNAP25 puncta; 10 discrete puncta have been labeled in each image. Scale bars, 100 nm. (I–L) Bar charts showing dSTORM image quantification of SNAP25 intensity (I), density of SNAP25 puncta (J), average area of SNAP25 puncta (K), and the area of SNAP25 puncta as a percentage of total bouton area (L), at human and mouse NMJs. All 4 measures of SNAP25 labeling were significantly greater in the human NMJs. For both human and mouse datasets, n = 50 boutons; bar charts depict mean (±SEM). Unpaired t test and Mann-Whitney test. (M and N) Bar charts comparing the average size of human and mouse NMJs (nerve terminal area, M) with the total size of their active zone material (SNAP25 area per NMJ, N). Although the human NMJ is significantly smaller than the mouse NMJ (M), the total amount of SNAP25 labeling at the NMJ is the same when adjusted to reflect the total overall size of the synapse (N). Unpaired t test. ∗∗∗∗p < 0.0001, ∗∗p < 0.01.
Figure 4
Figure 4
Unique Molecular Profile of the Human NMJ (A) Schematic representation of sample micro-dissection used to produce NMJ-enriched and NMJ-devoid (muscle) samples for proteomics and subsequent bioinformatics analysis. NMJ presence/absence was confirmed by α-bungarotoxin labeling (Experimental Procedures). (B) Heatmap representation of proteomic data. Abundance is indicated by color intensity, from lowest (darkest blue) to highest (darkest red). Clear differences exist between the 4 samples, particularly when comparing human and mouse NMJs. (C) Schematic representation of proteomic data based on Biolayout output (Experimental Procedures). Each sphere represents the entire expression data for an individual tissue sample, and the proximity and orientation relative to one another indicates the similarity of the datasets; human and mouse muscle samples are more similar than human and mouse NMJ samples. (D) In silico analysis identifies canonical cascades relating to neurotransmitter function and nervous system signaling. Ten example pathways are listed. Values are the percentage (and number) of proteins in each cascade that are upregulated (red) or downregulated (blue) in human cf. mouse. Significance levels are listed as –log10(p value), i.e., –log10(p < 0.05) ≈1.3, –log10(p < 0.0001) = 4, etc. Of the 36 pathways identified, only 1 showed no significant species difference (GABA receptor signaling cascade; not shown).

References

    1. Ackermann F., Waites C.L., Garner C.C. Presynaptic active zones in invertebrates and vertebrates. EMBO Rep. 2015;16:923–938. - PMC - PubMed
    1. Anis N.A., Robbins N. General and strain-specific age changes at mouse limb neuromuscular junctions. Neurobiol. Aging. 1987;8:309–318. - PubMed
    1. Balice-Gordon R.J., Lichtman J.W. In vivo visualization of the growth of pre- and postsynaptic elements of neuromuscular junctions in the mouse. J. Neurosci. 1990;10:894–908. - PMC - PubMed
    1. Coërs C., Woolf A.L. Blackwell Scientific Publications; Oxford: 1959. The Innervation of Muscle.
    1. Couteaux R., Pécot-Dechavassine M. Synaptic vesicles and pouches at the level of “active zones” of the neuromuscular junction. C. R. Acad. Sci. Hebd. Seances Acad. Sci. D. 1970;271:2346–2349. - PubMed