. 2017 Nov 27;9(12):383.
doi: 10.3390/toxins9120383.

Effects of Adding Clostridium sp. WJ06 on Intestinal Morphology and Microbial Diversity of Growing Pigs Fed with Natural Deoxynivalenol Contaminated Wheat

Affiliations

Effects of Adding Clostridium sp. WJ06 on Intestinal Morphology and Microbial Diversity of Growing Pigs Fed with Natural Deoxynivalenol Contaminated Wheat

FuChang Li et al. Toxins (Basel). .

Abstract

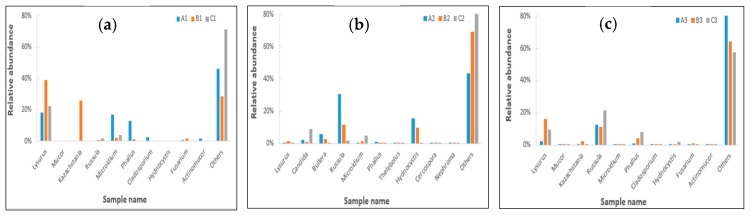
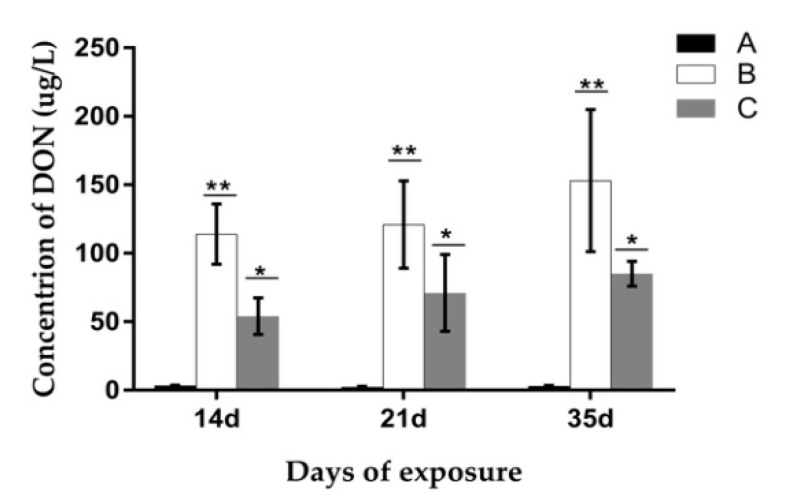
Deoxynivalenol (DON) is commonly detected in cereals, and is a threat to human and animal health. The effects of microbiological detoxification are now being widely studied. A total of 24 pigs (over four months) were randomly divided into three treatments. Treatment A was fed with a basal diet as the control group. Treatment B was fed with naturally DON-contaminated wheat as a negative control group. Treatment C was fed with a contaminated diet that also had Clostridium sp. WJ06, which was used as a detoxicant. Growth performance, relative organ weight, intestinal morphology, and the intestinal flora of bacteria and fungi were examined. The results showed that after consuming a DON-contaminated diet, the growth performance of the pigs decreased significantly (p < 0.05), the relative organ weight of the liver and kidney increased significantly (p < 0.05), and the integrity of the intestinal barrier was also impaired, though the toxic effects of the contaminated diets on growing pigs were relieved after adding Clostridium sp. WJ06. The data from MiSeq sequencing of the 16S ribosomal ribonucleic acid (rRNA) gene and internal transcribed spacer 1 (ITS1) gene suggested that the abundance of intestinal flora was significantly different across the three treatments. In conclusion, the application of Clostridium sp. WJ06 can reduce the toxic effects of DON and adjust the intestinal microecosystem of growing pigs.

Keywords: Clostridium sp. WJ06; deoxynivalenol; intestinal morphology; microbial diversity; pig.


Conflict of interest statement

The authors declare no conflict of interest.

Figures

Figure 1
Figure 1
Effect of Clostridium sp. WJ06 on relative organ weight 1 of growing pigs. 1 Relative organ weight (kg/kg) = organ weight (kg)/live weight (kg). A, B, and C represent the samples of different treatments. Bars are presented as mean ± SD, n = 3. ** Indicates that results differ significantly between treatments (p < 0.05).
Figure 2
Figure 2
The effect of Clostridium sp. WJ06 on the morphology of different intestine regions of growing pigs via scanning electron microscopy (n = 3). (ac) refer to samples of the ileum, caecum, and colon, respectively. A, B, and C refer to the samples of different treatments. 1000×, 5000×, and 15,000× represent the magnification of electron microscopy at transverse sections. V represents the photo of a vertical section magnified 15,000×.
Figure 2
Figure 2
The effect of Clostridium sp. WJ06 on the morphology of different intestine regions of growing pigs via scanning electron microscopy (n = 3). (ac) refer to samples of the ileum, caecum, and colon, respectively. A, B, and C refer to the samples of different treatments. 1000×, 5000×, and 15,000× represent the magnification of electron microscopy at transverse sections. V represents the photo of a vertical section magnified 15,000×.
Figure 3
Figure 3
Rarefaction curve and rank abundance curve in nine libraries. (A1,A2) represented the data from 16S ribosomal ribonucleic acid (rRNA) gene sequencing. (B1,B2) represented the data from internal transcribed spacer 1 (ITS1) gene sequencing. In the rarefaction curves plot (A1 & B1), the x-axis is number sequencing reads randomly chosen from a certain sample to obtain operational taxonomic units (OTUs). The y-axis is corresponding OTUs. In the rank-abundance curves plot (A2 & B2), the x-axis is the abundance rank, and the y-axis is the relative abundance. The higher the abundance, the smaller the rank. Curves for different samples are represented by different colors.
Figure 4
Figure 4
Tag abundance of each sample at different classification levels. Sequence number indicates the number of sequences annotated to that level, which are expressed in different colors. Bars are presented as means, n = 3. (A) The sequence number of bacteria flora in different treatments. (B) The sequence number of fungi flora.
Figure 5
Figure 5
Relative abundance of the dominant bacterial phyla level in nine libraries. Each bar represents the relative abundance of each sample. Each color represents a particular bacterial family. Sequences that could not be classified into the top 10 were classified as ‘others’. A, B, and C represent the samples from three treatments, and 1, 2, and 3 represent the samples of the ileum, caecum and colon, respectively.
Figure 6
Figure 6
Relative abundance of the dominant bacteria at the same gut region at the genus level. Each bar represents the relative abundance of each sample. Each color represents a particular bacterial family. (a) A1, B1, and C1 represent the samples of the ileum in different treatments. (b) A2, B2, and C2 represent the samples of the caecum in different treatments. (c) A3, B3, and C3 represent the samples of the colon in different treatments.
Figure 7
Figure 7
Hierarchically clustered heat map of the highly represented fungal taxa (at the genus level) in nine libraries. The relative percentages (%) of the bacterial families are indicated by varying color intensities, according to the legend at the top of the figure. The darker the color of samples, the higher the relative abundance shown in the picture.
Figure 8
Figure 8
Dominant fungi composition of the different communities at the phyla level. Each bar represents the relative abundance of each sample. Each color represents a particular bacterial family. Sequences that could not be classified into top 10 were assigned as ‘others’. A, B, and C represent the samples from three treatments, and 1, 2, and 3 represent the samples of the ileum, caecum, and colon, respectively.
Figure 9
Figure 9
Relative abundance of the dominant fungi at the same gut region at the genus level. Each bar represents the relative abundance of each sample. Each color represents a particular bacterial family. (a) A1, B1, and C1 represent the samples of ileum in different treatments. (b) A2, B2, and C2 represent the samples of caecum in different treatments. (c) A3, B3, and C3 represent the samples of the colon in different treatments.
Figure 10
Figure 10
Hierarchically clustered heat map of the highly represented fungal taxa (at the genus level) in nine samples. The relative percentages (%) of the bacterial families are indicated by varying color intensities according to the legend at the top of the figure. The more brunette the samples’ color, the higher relative abundance shown in the picture.
Figure 11
Figure 11
Principal component analysis (PCA) in nine libraries. Scatterplot of PCA score depicting the variance in fingerprints derived from different bacterial communities. The more similar the composition of samples, the closer the distance shown in the PCA picture. (A) The sequence number of bacteria flora. (B) The sequence number of fungi flora.
Figure 12
Figure 12
Concentration of deoxynivalenol (DON) in porcine urine at different exposure days. A, B, and C represent the samples of different treatments. Bars are presented as mean ± SD, n = 5. The values with different asterisks (* or **) differed significantly on the same exposure day (p < 0.05).
Figure 13
Figure 13
Concentration of DON and de-epoxy-DON (DOM-1) in porcine feces at different exposure days. (a) The concentration of DON. (b) The concentration of DOM-1. A, B, and C represent the samples of different treatments. Bars are presented as mean ± SD, n = 5. The values with different asterisks (* or **) in the same exposure day differ significantly (p < 0.05).
Figure 14
Figure 14
Chemical structure of DON and DOM-1 was cited by Maresca [24]. DON and DOM-1 were drawn using Marvin software. Images on the right show an electrostatic map of the molecules, with the blue color indicating a positive region, the red color indicating a negative region, and the gray color indicating a neutral region. The purple circles on the left images and the yellow arrows on the right images indicate the position of the epoxide or de-epoxide functions in DON and DOM-1, respectively.
Figure 15
Figure 15
The effect of Clostridium sp. WJ06 culture on degrading DON in vitro via high performance liquid chromatography (HPLC). (A) The chromatogram of standard DON and DOM-1. (B) The chromatogram of the co-culture of DON (20 ppm) and L10. (C) The chromatogram of the co-culture of DON (20 ppm), L10, and Clostridium sp. WJ06.

References

    1. Rohweder D., Kersten S., Valenta H., Sondermann S., Schollenberger M., Drochner W., Dänicke S. Bioavailability of the Fusarium toxin deoxynivalenol (DON) from wheat straw and chaff in pigs. Arch. Anim. Nutr. 2013;67:37–47. doi: 10.1080/1745039X.2012.755328. - DOI - PubMed
    1. Garda-Buffon J., Kupsk L., Badiale-Furlong E. Deoxynivalenol (DON) degradation and peroxidase enzyme activity in submerged fermentation. Ciênc. Tecnol. Aliment. 2011;31:198–203. doi: 10.1590/S0101-20612011000100030. - DOI
    1. Fodor J.S. Individual and Combined Effects of Subchronic Exposure of Three Fusarium Toxins (Fumonisin B, Deoxynivalenol and Zearalenone) in Rabbit Bucks. J. Toxicol. Clin. Toxicol. 2015;5:2–11. doi: 10.4172/2161-0495.1000264. - DOI
    1. Kachlek M.J., Szabó-Fodor A., Szabó I., Bors C., Celia Z., Gerencsér Z., Matics Z., Szendrő T., Tuboly E., Balogh-Zándoki R., et al. Subchronic exposure to deoxynivalenol exerts slight effect on the immune system and liver morphology of growing rabbits. Acta Vet. Brno. 2017;86:37–44. doi: 10.2754/avb201786010037. - DOI
    1. Pestka J.J. Mechanisms of Deoxynivalenol-Induced Gene Expression and Apoptosis. Food Addit. Contam. 2008;25:1128–1140. doi: 10.1080/02652030802056626. - DOI - PMC - PubMed

Publication types

LinkOut - more resources