. 2018 Feb;208(2):763-777.
doi: 10.1534/genetics.117.300551. Epub 2017 Nov 29.

Relaxed Selection During a Recent Human Expansion

Affiliations

Relaxed Selection During a Recent Human Expansion

Stephan Peischl et al. Genetics. 2018 Feb.

Abstract

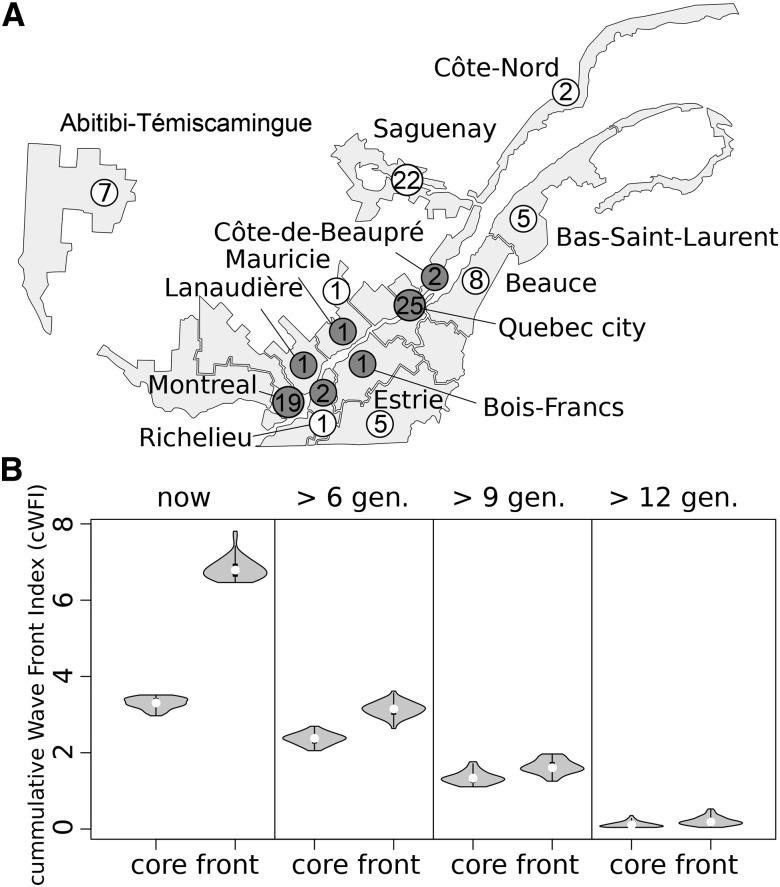
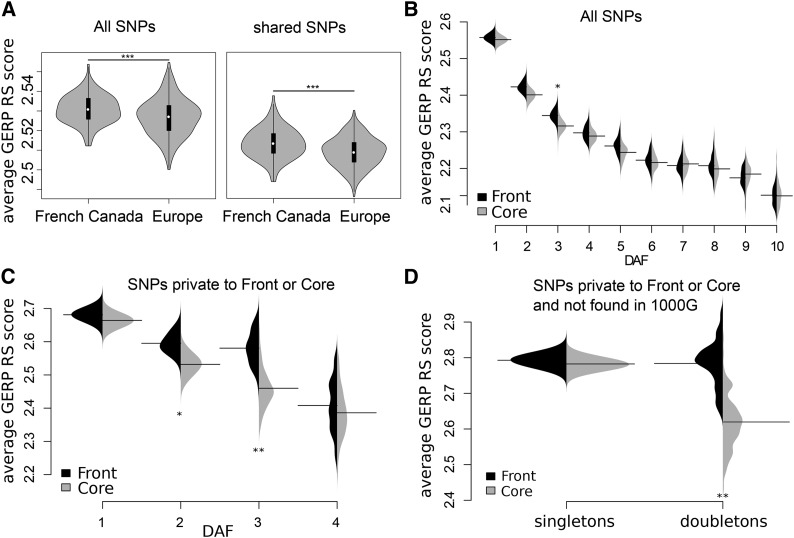
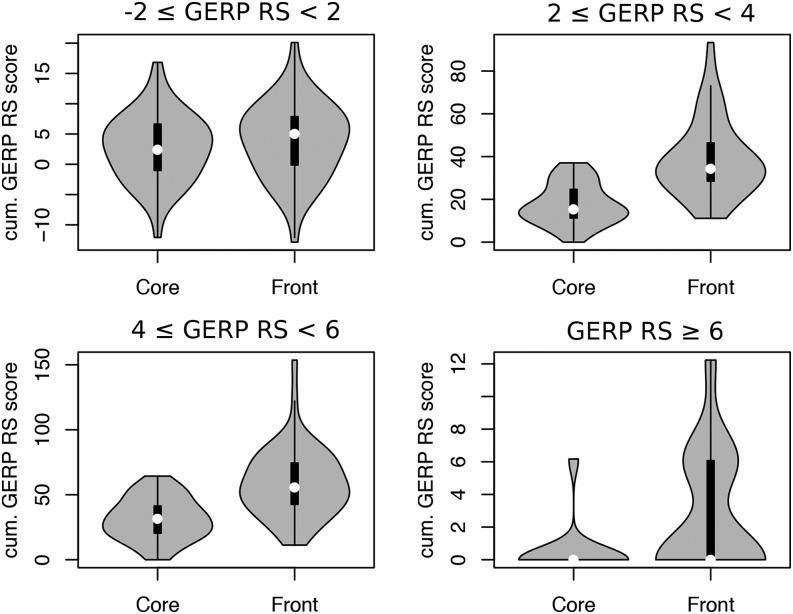
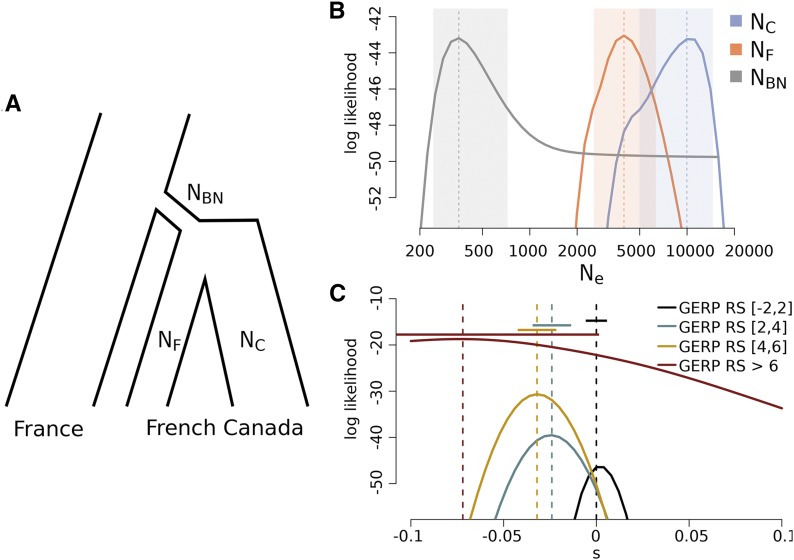
Humans have colonized the planet through a series of range expansions, which deeply impacted genetic diversity in newly settled areas and potentially increased the frequency of deleterious mutations on expanding wave fronts. To test this prediction, we studied the genomic diversity of French Canadians who colonized Quebec in the 17th century. We used historical information and records from ∼4000 ascending genealogies to select individuals whose ancestors lived mostly on the colonizing wave front and individuals whose ancestors remained in the core of the settlement. Comparison of exomic diversity reveals that: (i) both new and low-frequency variants are significantly more deleterious in front than in core individuals, (ii) equally deleterious mutations are at higher frequencies in front individuals, and (iii) front individuals are two times more likely to be homozygous for rare very deleterious mutations present in Europeans. These differences have emerged in the past six to nine generations and cannot be explained by differential inbreeding, but are consistent with relaxed selection mainly due to higher rates of genetic drift on the wave front. Demographic inference and modeling of the evolution of rare variants suggest lower effective size on the front, and lead to an estimation of selection coefficients that increase with conservation scores. Even though range expansions have had a relatively limited impact on the overall fitness of French Canadians, they could explain the higher prevalence of recessive genetic diseases in recently settled regions of Quebec.

Keywords: Quebec; genetic drift; mutation load; range expansion.


Figures

Figure 1
Figure 1
Location and number of sampled individuals and distribution of the cumulative wave front indices (cWFI). (A) Front and core sampled individuals are shown in white and gray, respectively. The numbers inside circles indicate the sample size for each location. (B) The leftmost panel shows the distribution of cWFI among sampled individuals. The other three panels display the cWFI of the ancestors of the sampled individuals that lived 6, 9, or 12 gen. (generations) ago, which shows that observed differences in cWFI between current samples have mostly emerged in the six most recent generations.
Figure 2
Figure 2
(A) Distributions of average GERP RS scores per site per individual in three European 1000 Genomes populations, as well as in core and front individuals. Left: all sites. Right: sites shared between 1000 Genomes samples and Quebec (Student’s t-test P-values = 10−7 and 10−5, respectively). (B) Average GERP RS score per site having different DAFs. The solid horizontal lines show the average GERP RS score per site. The violin plots show the average GERP RS score distribution obtained by bootstrap (1000 replicates). (C) Like (B), but for mutations private to the front or to the core. (D) Like (B), but for singletons and doubletons that are private to front or core and not found in the 1000 Genomes phase 3 panel. For the sake of clarity, higher DAF classes are not shown in (B–D). Only SNPs with GERP RS scores > 0 were used for the calculations of GERP RS scores in all panels. Asterisks indicate significance levels obtained by permutation tests: * P < 0.05, ** P < 0.01, and *** P < 0.001. 1000G, 1000 Genomes; DAF, derived allele frequency; GERP RS, GERP Rejected Substitution.
Figure 3
Figure 3
Distribution of the cumulative additive GERP RS scores of doubletons in front and core individuals for different GERP RS categories. Sites were considered if they were not seen in derived states in 1000 Genomes samples and if they were private to the core or to the front. Differences between front and core are significant for the three categories of sites potentially under selection (P = 10−11, 10−9, and 10−4 for mildly, strongly, and extremely deleterious sites, respectively), but not for the neutral sites (−2 GERP RS score < 2, P = 0.34). GERP RS, GERP Rejected Substitution.
Figure 4
Figure 4
MLE of effective population sizes and selection coefficients of rare variants. (A) Sketch of the model for the demographic history of core and front populations. Likelihoods were calculated based on the expectation of the change in allele frequency distribution of rare variants (that is, singletons in the European sample). Marginal likelihoods and MLE for effective population sizes of bottleneck, and in front and core (B), and selection coefficients for different GERP RS categories (C). Shaded areas indicate 95% C.I.s in (B), and horizonal bars indicate 95% C.I.s in (C). GERP RS, GERP Rejected Substitution; MLE, maximum likelihood estimation; NBN, effective population size of the founding population; NC, effective population size of the core; NF, effective population size of the front.
Figure 5
Figure 5
Ratio of expected homozygosity (HR) for variants that are singletons in European 1000 Genomes populations. HR=E[qf2]/E[qc2], where qf andqc are derived allele frequencies in front and core individuals, respectively. The horizontal solid lines indicate HR for different GERP Rejected Substitution (GERP RS) score categories. The dashed lines indicate the expected HR values that would be due to differences in estimated inbreeding levels between front and core, calculated as (qc2+Δfqc(1qc))/qc2, where Δf=ffrontfcore. Violin plots show the distribution of 5000 bootstrap replicates. We find significant differences between the expected values for GERP RS scores > 6 (all individuals: P = 0.021 and without Saguenay individuals: P = 0.008, obtained by bootstrap).

References

    1. 1000 Genomes Project Consortium. Auton A., Brooks L. D., Durbin R. M., Garrison E. P., et al. , 2015. A global reference for human genetic variation. Nature 526: 68–74. - PMC - PubMed
    1. Adzhubei I. A., Schmidt S., Peshkin L., Ramensky V. E., Gerasimova A., et al. , 2010. A method and server for predicting damaging missense mutations. Nat. Methods 7: 248–249. - PMC - PubMed
    1. Alexa A., Rahnenfuhrer J., Lengauer T., 2006. Improved scoring of functional groups from gene expression data by decorrelating GO graph structure. Bioinformatics 22: 1600–1607. - PubMed
    1. Austerlitz F., Heyer E., 1998. Social transmission of reproductive behavior increases frequency of inherited disorders in a young-expanding population. Proc. Natl. Acad. Sci. USA 95: 15140–15144. - PMC - PubMed
    1. Awadalla P., Boileau C., Payette Y., Idaghdour Y., Goulet J. P., et al. , 2013. Cohort profile of the CARTaGENE study: Quebec’s population-based biobank for public health and personalized genomics. Int. J. Epidemiol. 42: 1285–1299. - PubMed

Publication types