. 2018 Jan 2;217(1):163-177.
doi: 10.1083/jcb.201707160. Epub 2017 Nov 29.

Aurora A kinase phosphorylates Hec1 to regulate metaphase kinetochore-microtubule dynamics

Affiliations

Aurora A kinase phosphorylates Hec1 to regulate metaphase kinetochore-microtubule dynamics

Keith F DeLuca et al. J Cell Biol. .

Abstract

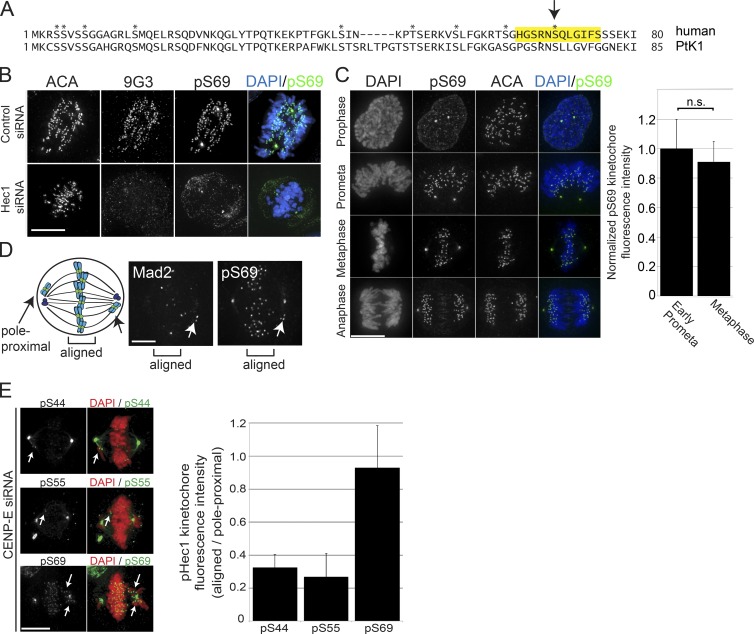
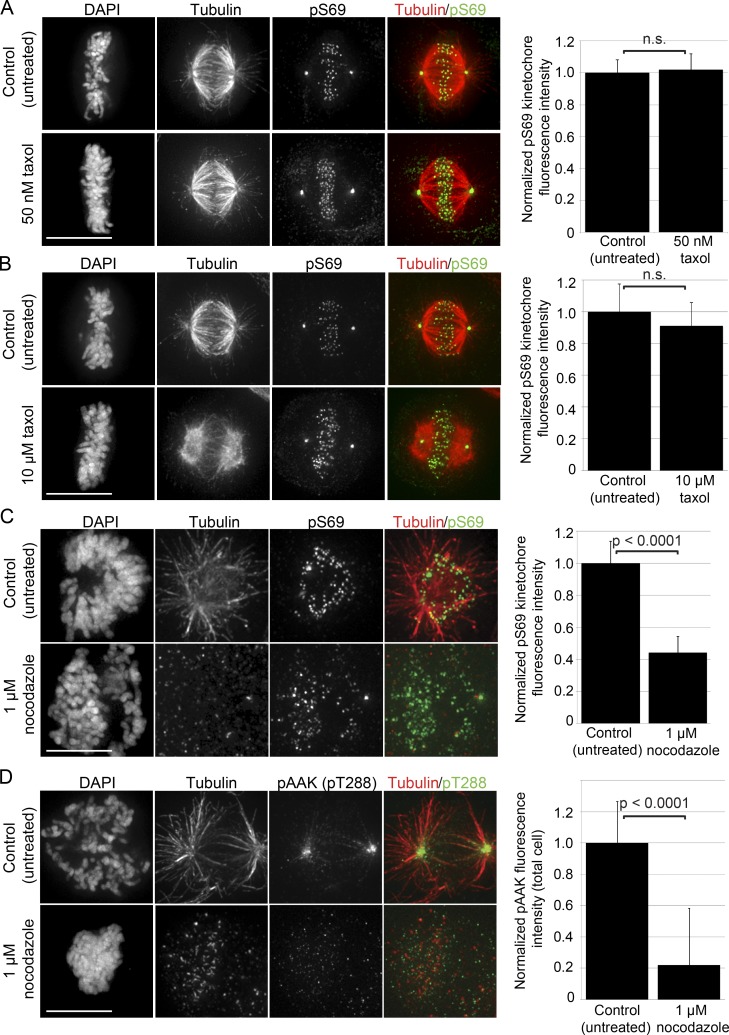
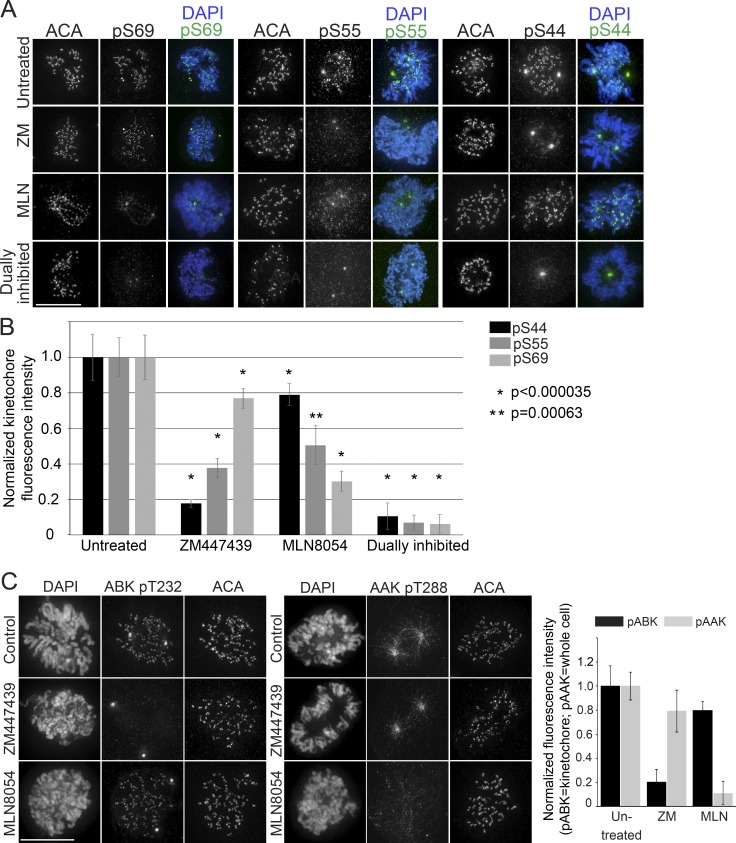
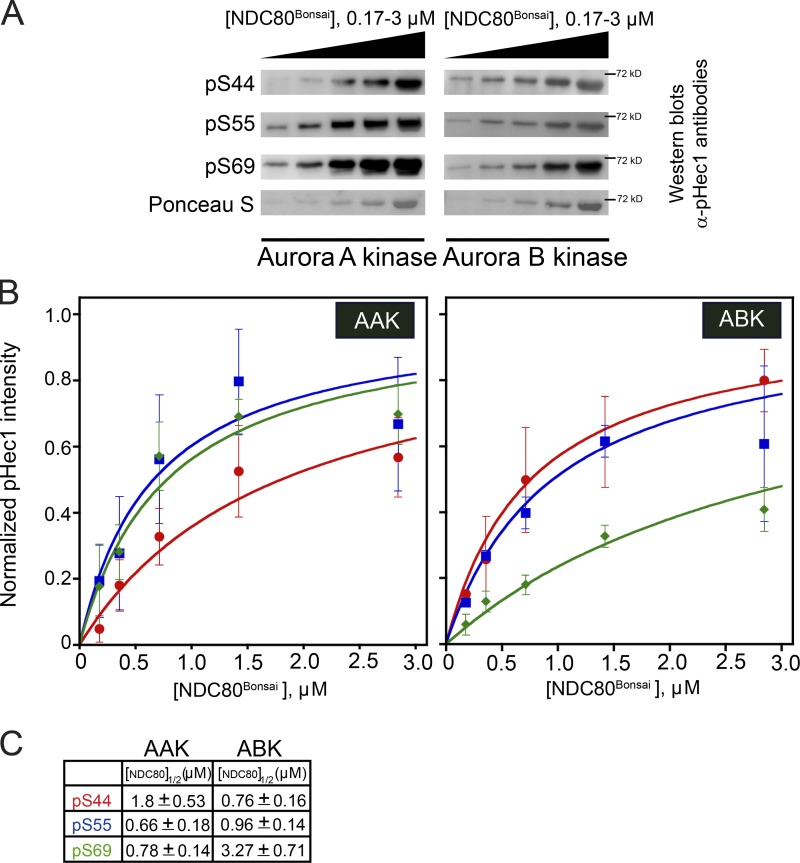
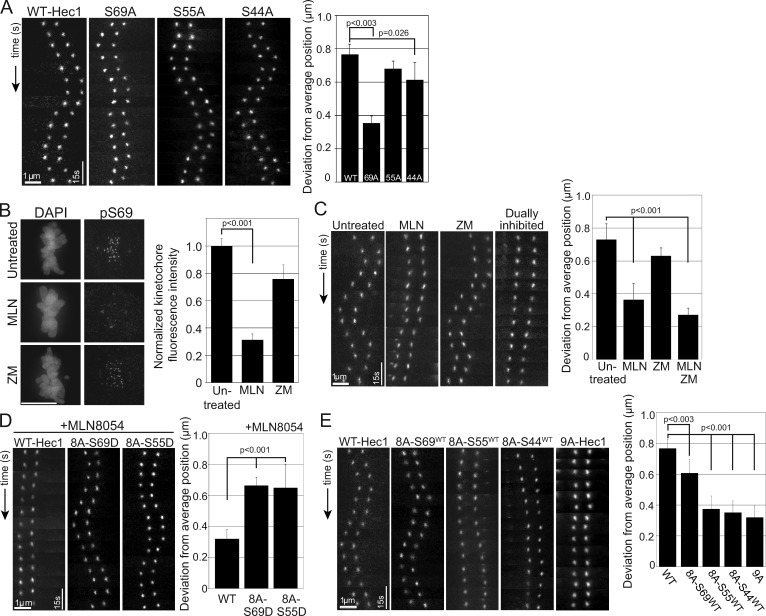
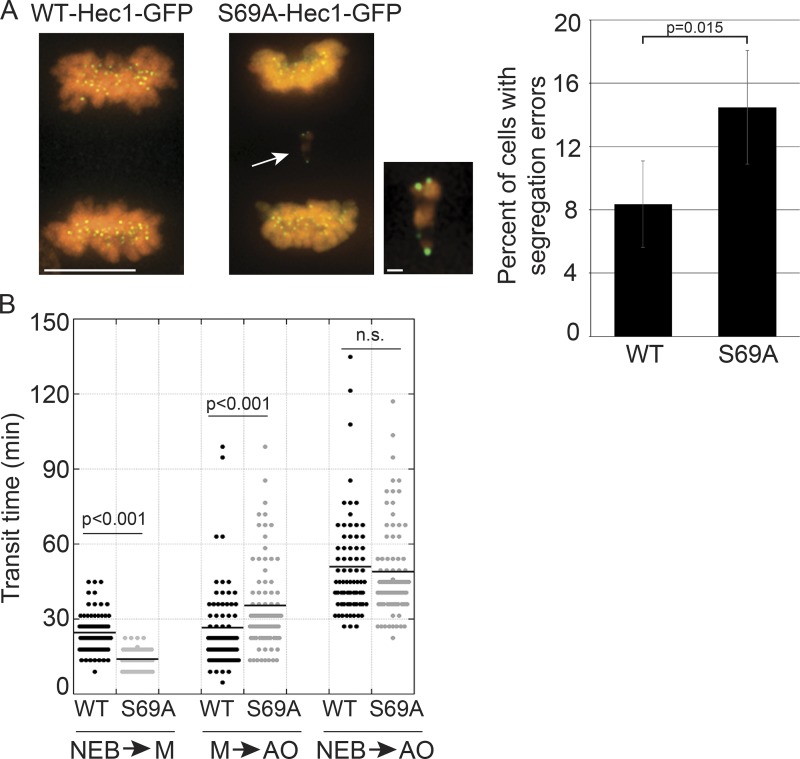
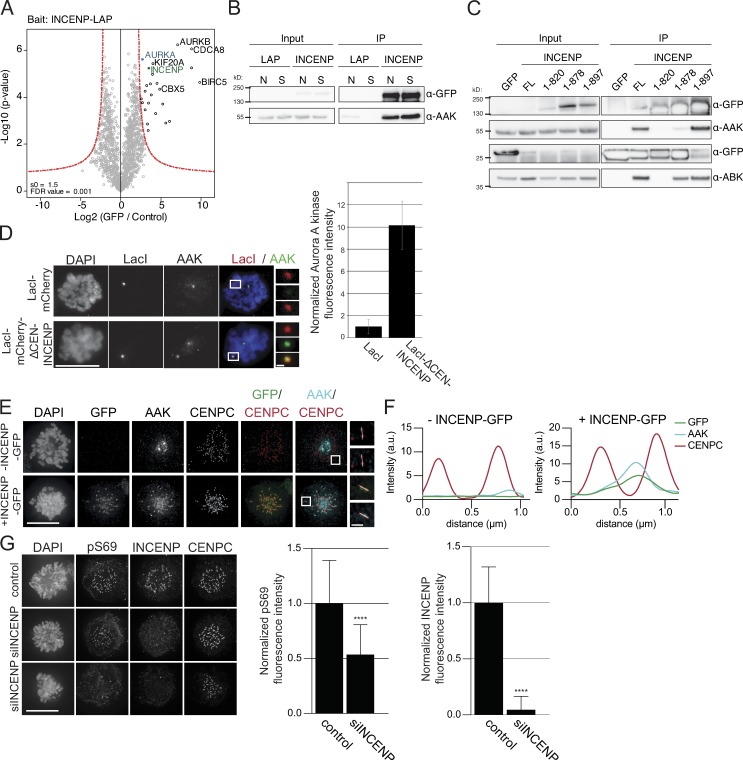
Precise regulation of kinetochore-microtubule attachments is essential for successful chromosome segregation. Central to this regulation is Aurora B kinase, which phosphorylates kinetochore substrates to promote microtubule turnover. A critical target of Aurora B is the N-terminal "tail" domain of Hec1, which is a component of the NDC80 complex, a force-transducing link between kinetochores and microtubules. Although Aurora B is regarded as the "master regulator" of kinetochore-microtubule attachment, other mitotic kinases likely contribute to Hec1 phosphorylation. In this study, we demonstrate that Aurora A kinase regulates kinetochore-microtubule dynamics of metaphase chromosomes, and we identify Hec1 S69, a previously uncharacterized phosphorylation target site in the Hec1 tail, as a critical Aurora A substrate for this regulation. Additionally, we demonstrate that Aurora A kinase associates with inner centromere protein (INCENP) during mitosis and that INCENP is competent to drive accumulation of the kinase to the centromere region of mitotic chromosomes. These findings reveal that both Aurora A and B contribute to kinetochore-microtubule attachment dynamics, and they uncover an unexpected role for Aurora A in late mitosis.


Figures

Figure 1.
Figure 1.
Hec1 S69 is phosphorylated throughout mitosis. (A) Amino acid sequences of the human and PtK1 cell (Guimaraes et al., 2008) Hec1 N-terminal tail domain. Shown in yellow is the human peptide sequence that was used to generate the S69 phosphospecific antibody. The arrow points to S69 in the human sequence and the corresponding serine residue in the PtK1 sequence. Asterisks indicate all other mapped Aurora B kinase sites in the human Hec1 tail domain (Cheeseman et al., 2006; DeLuca et al., 2006). (B) Immunofluorescence images of HeLa cells stained with phosphospecific antibodies to Hec1 pS69. Depletion of Hec1 (bottom) results in loss of pS69 staining at kinetochores. Cells are also immunostained with antibody 9G3 (pan-Hec1 antibody) and an anticentromere antibody (ACA) derived from human calcinosis, Raynaud's phenomenon, esophageal dysmotility, sclerodactyly, and telangiectasia (CREST) patient serum. (C) Immunofluorescence images of HeLa cells demonstrating kinetochore localization of pS69 during mitosis. Quantification is shown on the right. For each phase shown, ≥400 kinetochores from ≥30 cells were measured. (D) Immunofluorescence images of a HeLa cell stained with antibodies to pS69 and Mad2. For the cell shown, most chromosomes are aligned at the spindle equator, and one chromosome remains near a spindle pole (arrows). A schematic illustrating examples of pole-proximal chromosomes is shown on the left. (E) Immunofluorescence images of HeLa cells depleted of CENP-E to increase the number of pole-proximal chromosomes (arrows) and stained with Hec1 phosphospecific antibodies. Quantification is shown on the right from one representative experiment. n values are as follows: pS69, 20 polar kinetochores and 40 aligned kinetochores; pS55, 17 polar kinetochores and 57 aligned kinetochores; and pS44, 13 polar kinetochores and 29 aligned kinetochores. Error bars indicate SD. Bars: (B, C, and E) 10 µm; (D) 3 µm.
Figure 2.
Figure 2.
Hec1 S69 phosphorylation is reduced at kinetochores in response to microtubule depolymerization but not in response to microtubule stabilization. (A–C) Immunofluorescence images showing kinetochore localization of pS69 in HeLa cells after incubation with 50 nM taxol for 5 h (A), 10 µM taxol for 30 min (B), and 1 µM nocodazole for 1 h (C). (D) Immunofluorescence images of control cells and cells treated with 1 µM nocodazole for 1 h and stained with an antibody to active Aurora A kinase phosphorylated at T288 (pT288). Shown on the right of each panel is the quantification of either pS69 kinetochore fluorescence intensity (A–C) or total cellular pAAK fluorescence intensity (D). For all conditions in A–C, ≥200 kinetochores were measured from ≥20 cells. For the experiment shown in D, total fluorescence was measured from ≥20 cells per condition. Error bars indicate SD. Bars, 10 µm.
Figure 3.
Figure 3.
Hec1 S69 is phosphorylated by Aurora A kinase in cells. (A) Immunofluorescence images of HeLa cells treated with 2 µM ZM447439 (ZM) to inhibit Aurora B kinase (ABK), 0.5 µM MLN8054 (MLN) to inhibit Aurora A kinase (AAK), or both inhibitors, and stained with phosphospecific antibodies to Hec1 S69, S55, and S44. (B) Quantification of the experiment represented in A. For each condition, ≥300 kinetochores were measured from ≥30 cells. Asterisks indicate respective p-values (each condition is compared with the corresponding untreated control; unpaired t test). (C) Fluorescence images showing cells immunostained with antibodies to active Aurora B kinase phosphorylated at T232 (pT232) and active Aurora A kinase phosphorylated at T288 (pT288) in HeLa cells treated with either 0.5 µM MLN8054, 2 µM ZM447439, or no inhibitor. Quantification is shown on the right. For each condition shown, ≥300 kinetochores from ≥30 cells were measured. Error bars indicate SD. Bars, 10 µm. ACA, anticentromere antibody.
Figure 4.
Figure 4.
Aurora A and Aurora B kinases phosphorylate Hec1 target residues with similar efficiencies in vitro. (A) Purified NDC80Bonsai complexes (Ciferri et al., 2008) were subjected to in vitro phosphorylation by Aurora A kinase (AAK) or Aurora B kinase (ABK) under conditions of increasing substrate concentration. Reactions were subjected to SDS-PAGE and Western blot analysis. Western blots of purified NDC80Bonsai complexes were probed with phosphospecific Hec1 antibodies or Ponceau S. (B) Curve fits for the substrate titration experiment were performed; concentration of substrate (NDC80Bonsai) is plotted on the x axis, and normalized pHec1 intensity is plotted on the y axis. For each curve, three to five independent experiments were performed using five concentrations of NDC80Bonsai substrate. Error bars indicate SD. (C) Calculated values for the concentration of NDC80Bonsai required for half maximal phosphorylation at each site (S44, S55, or S69) by Aurora A and Aurora B kinases.
Figure 5.
Figure 5.
Aurora A kinase phosphorylation of Hec1 S69 is required for metaphase kinetochore function. (A) Kymographs of individual sister kinetochore pairs from live-cell time-lapse imaging sequences of PtK1 cells depleted of endogenous Hec1 and rescued with WT-Hec1-GFP (WT) or mutants of Hec1 with a single phosphorylation site mutated to alanine: S69A, S55A, and S44A. Cells were treated with 10 µM MG132 before imaging. Quantification of the deviation from average position (Stumpff et al., 2008) is shown on the right. For each condition, ≥30 kinetochore pairs from a total of nine cells were analyzed. (B) Immunofluorescence images of untreated PtK1 cells or cells treated with 1 µM MLN8054 (MLN) or 2 µM ZM447439 (ZM). All cells were additionally treated with 10 µM MG132 at the time of kinase inhibitor addition. After 1 h, cells were fixed and stained with antibodies to phosphorylated S69 (pS69). Bar, 10 µm. Shown on the right is the quantification of pS69 kinetochore fluorescence intensity. For each condition, ≥200 kinetochores were measured from ≥20 cells. (C) Kymographs of individual sister kinetochore pairs from live-cell time-lapse imaging sequences of untreated PtK1 cells or cells treated with 1 µM MLN8054, 2 µM ZM447439, or both inhibitors. All cells were treated with 10 µM MG132 at the time of inhibitor addition. Quantification of the deviation from average position is shown on the right. For each condition, ≥20 kinetochore pairs were measured from at least five cells. (D) Kymographs of individual sister kinetochore pairs from live-cell time-lapse imaging sequences of PtK1 cells depleted of endogenous Hec1 and rescued with WT-Hec1-GFP or mutants of Hec1 with either S69 or S55 mutated to aspartic acid and the eight remaining phosphorylation target sites mutated to alanine (e.g., 8A-S69D-Hec1-GFP). Cells were treated with 1 µM MLN8054 and 10 µM MG132 before imaging. Quantification of the deviation from average position is shown on the right. For each condition, ≥20 kinetochore pairs were measured from at least five cells. (E) Kymographs of individual sister kinetochore pairs from live-cell time-lapse imaging sequences of PtK1 cells depleted of endogenous Hec1 and rescued with WT-Hec1-GFP, 9A-Hec1-GFP, or mutants of Hec1 with all phosphorylation target sites except for one (S69, S55, or S44) mutated to alanine. The remaining site was left as an unperturbed serine (e.g., 8A-S69WT-Hec1-GFP). Quantification of the deviation from average position is shown on the right. For each condition, ≥20 kinetochore pairs were measured from at least five cells. For all kymographs, distance scale bars are 1 µm, and time scale bars are 15 s. Error bars indicate SD. All kymographs represent individual sister kinetochore pairs displayed over time.
Figure 6.
Figure 6.
Inhibition of Hec1 S69 phosphorylation results in chromosome segregation errors and altered mitotic timing. (A) HeLa Flp-In T-REx cells depleted of endogenous Hec1 and induced to express either WT- or S69A-Hec1-GFP were fixed and scored for segregation errors. Errors included for quantification were lagging anaphase chromosomes and anaphase bridges. Examples of WT- and S69A-Hec1-GFP–expressing cells in anaphase are shown (chromosomes stained with DAPI are in red, and Hec1-GFP is in green). The arrow points to lagging chromosomes; this region is shown magnified to the right. For the quantification, ≥400 cells from four experiments were analyzed. Error bars represent SD. Bars: (main image) 10 µm; (magnified image) 1 µm. (B) Quantification of mitotic timing of HeLa Flp-In T-REx cells depleted of endogenous Hec1 and induced to express either WT- or S69A-Hec1-GFP. Mitotic progression was scored from nuclear envelope breakdown (NEB) to metaphase (M) and from metaphase to anaphase onset (AO). Total time in mitosis was scored from nuclear envelope breakdown to anaphase onset. For each condition, ≥75 cells were analyzed.
Figure 7.
Figure 7.
Aurora A kinase binds and localizes to INCENP. (A) Volcano plot of quantitative liquid chromatography–tandem mass spectrometry experiments identifying interactors of INCENP. Plotted are the differences in label-free quantification intensity between the INCENP-GFP (right) and control group against the transformed (−log10) p-value of a Student’s t test. The red line indicates the permutation-based false discovery rate (FDR) threshold (0.001) to correct for multiple testing. (B) Western blot analysis of an anti-GFP immunoprecipitation (IP) performed in mitotic cell lysates, using either nocodazole (N) or STLC (S) from HeLa cells expressing either LAP or INCENP-LAP. After SDS-PAGE, the Western blot was probed for GFP and Aurora A kinase (AAK). 10% of input was loaded. (C) Western blot analysis of an anti-GFP immunoprecipitation performed in cell lysates from HEK-293T cells transiently expressing either GFP, full-length (FL) INCENP-GFP, or various truncation mutants of INCENP-GFP (1–820, 1–878, and 1–897). The Western blot was probed for GFP and Aurora A kinase and reprobed for Aurora B kinase (ABK). 10% of input was loaded. (D) Immunofluorescence images of U2OS cells expressing either LacI-mCherry or LacI-mCherry-ΔCEN-INCENP (a version of INCENP lacking the N-terminal 57 residues; Ainsztein et al., 1998). Cells were immunostained with an Aurora A kinase antibody. Enlarged images show recruitment of Aurora A kinase to the LacI-mCherry-ΔCEN-INCENP spot. Quantification of Aurora A kinase intensity is shown on the right. (E) Immunofluorescence images of U2OS cells expressing VSV-INCENP-GFP under a doxycycline-inducible promoter, either noninduced or induced. Cells were immunostained with GFP and Aurora A kinase antibodies. Enlarged images show colocalization of INCENP-GFP and Aurora A kinase upon overexpression of INCENP-GFP. (F) Line graphs of kinetochore pairs highlighted in E. (G) Immunofluorescence images showing kinetochore localization of pS69 in HeLa cells treated with siRNA to either luciferase (control) or INCENP (siINCENP). Quantification of pS69 and INCENP fluorescence intensity is shown on the right. For pS69 quantification, n = 3 experiments of 15–20 cells; for INCENP quantification, n = 1 experiment of 15–20 cells. Error bars indicate SD. ****, P < 0.0001; unpaired t test. Bars: (main images) 10 µm; (insets) 1 µm.

References

    1. Ainsztein A.M., Kandels-Lewis S.E., Mackay A.M., and Earnshaw W.C.. 1998. INCENP centromere and spindle targeting: identification of essential conserved motifs and involvement of heterochromatin protein HP1. J. Cell Biol. 143:1763–1774. 10.1083/jcb.143.7.1763 - DOI - PMC - PubMed
    1. Barr A.R., and Gergely F.. 2007. Aurora-A: the maker and breaker of spindle poles. J. Cell Sci. 120:2987–2996. 10.1242/jcs.013136 - DOI - PubMed
    1. Biggins S., Severin F.F., Bhalla N., Sassoon I., Hyman A.A., and Murray A.W.. 1999. The conserved protein kinase Ipl1 regulates microtubule binding to kinetochores in budding yeast. Genes Dev. 13:532–544. 10.1101/gad.13.5.532 - DOI - PMC - PubMed
    1. Caldas G.V., and DeLuca J.G.. 2014. KNL1: bringing order to the kinetochore. Chromosoma. 123:169–181. 10.1007/s00412-013-0446-5 - DOI - PMC - PubMed
    1. Caldas G.V., DeLuca K.F., and DeLuca J.G.. 2013. KNL1 facilitates phosphorylation of outer kinetochore proteins by promoting Aurora B kinase activity. J. Cell Biol. 203:957–969. 10.1083/jcb.201306054 - DOI - PMC - PubMed

Publication types