

Identifying spatio-temporal dynamics of Ebola in Sierra Leone using virus genomes
- PMID: 29187639
- PMCID: PMC5721162
- DOI: 10.1098/rsif.2017.0583
Identifying spatio-temporal dynamics of Ebola in Sierra Leone using virus genomes
Abstract
Containing the recent West African outbreak of Ebola virus (EBOV) required the deployment of substantial global resources. Despite recent progress in analysing and modelling EBOV epidemiological data, a complete characterization of the spatio-temporal spread of Ebola cases remains a challenge. In this work, we offer a novel perspective on the EBOV epidemic in Sierra Leone that uses individual virus genome sequences to inform population-level, spatial models. Calibrated to phylogenetic linkages of virus genomes, these spatial models provide unique insight into the disease mobility of EBOV in Sierra Leone without the need for human mobility data. Consistent with other investigations, our results show that the spread of EBOV during the beginning and middle portions of the epidemic strongly depended on the size of and distance between populations. Our phylodynamic analysis also revealed a change in model preference towards a spatial model with power-law characteristics in the latter portion of the epidemic, correlated with the timing of major intervention campaigns. More generally, we believe this framework, pairing molecular diagnostics with a dynamic model selection procedure, has the potential to be a powerful forecasting tool along with offering operationally relevant guidance for surveillance and sampling strategies during an epidemic.
Keywords: Ebola; disease modelling; phylodynamics; spatial epidemiology.
© 2017 The Authors.
Conflict of interest statement
We declare we have no competing interests.
Figures

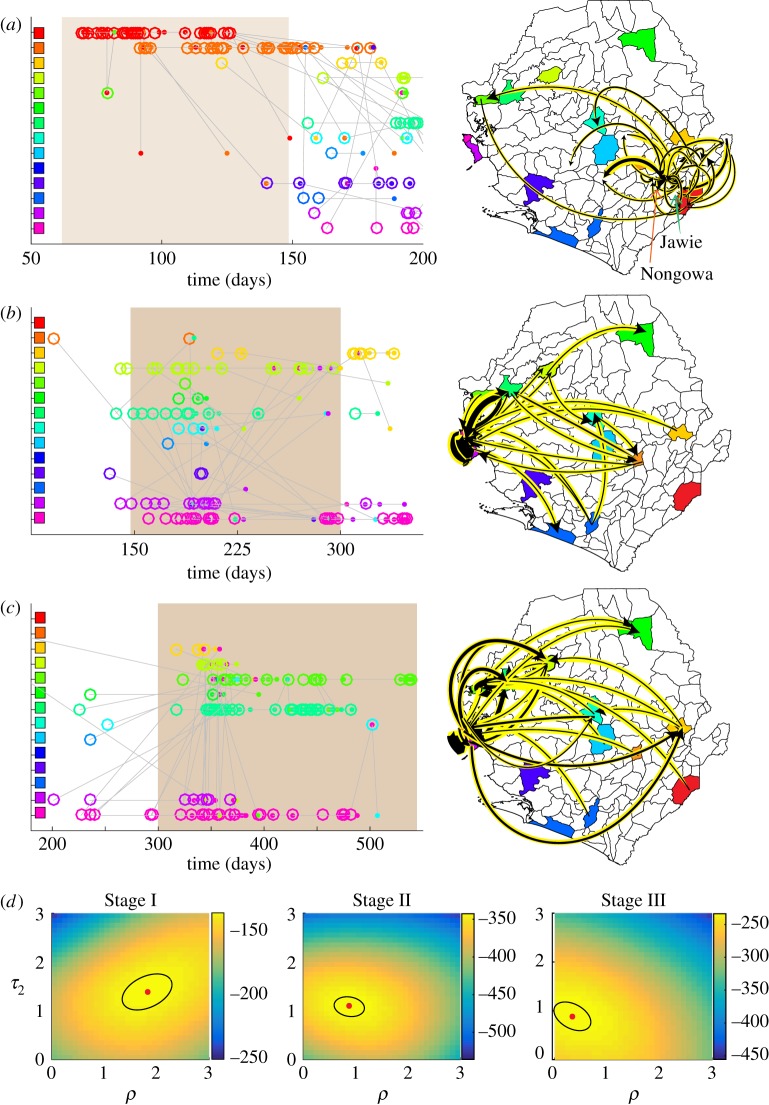
 , comparing the gravity and power-law models, is plotted for 50-day windows. The dashed black line represents (ρ = 1.66, τ2 = 1) fixed in time; the solid black line of
  uses the MLE (ρ⋆(t), τ⋆2(t)), computed for each window. The solid red trace describes the number of linkages.
Similar articles
-
Quantifying the epidemic spread of Ebola virus (EBOV) in Sierra Leone using phylodynamics.Virulence. 2014;5(8):825-7. doi: 10.4161/21505594.2014.976514. Virulence. 2014. PMID: 25495064 Free PMC article.
-
Genetic diversity and evolutionary dynamics of Ebola virus in Sierra Leone.Nature. 2015 Aug 6;524(7563):93-6. doi: 10.1038/nature14490. Epub 2015 May 13. Nature. 2015. PMID: 25970247 Free PMC article.
-
Phylodynamic Analysis of Ebola Virus Disease Transmission in Sierra Leone.Viruses. 2019 Jan 16;11(1):71. doi: 10.3390/v11010071. Viruses. 2019. PMID: 30654482 Free PMC article.
-
[Control of Ebola hemorrhagic fever: vaccine development and our Ebola project in Sierra Leone].Uirusu. 2016;66(1):53-62. doi: 10.2222/jsv.66.53. Uirusu. 2016. PMID: 28484179 Review. Japanese.
-
The West African ebola virus disease epidemic 2014-2015: A commissioned review.Niger Postgrad Med J. 2016 Apr-Jun;23(2):49-56. doi: 10.4103/1117-1936.186299. Niger Postgrad Med J. 2016. PMID: 27424613 Review.
Cited by
-
Inferring time-dependent migration and coalescence patterns from genetic sequence and predictor data in structured populations.Virus Evol. 2019 Aug 14;5(2):vez030. doi: 10.1093/ve/vez030. eCollection 2019 Jul. Virus Evol. 2019. PMID: 31428459 Free PMC article.
-
Linked surveillance and genetic data uncovers programmatically relevant geographic scale of Guinea worm transmission in Chad.PLoS Negl Trop Dis. 2021 Jul 26;15(7):e0009609. doi: 10.1371/journal.pntd.0009609. eCollection 2021 Jul. PLoS Negl Trop Dis. 2021. PMID: 34310598 Free PMC article.
References
Publication types
MeSH terms
LinkOut - more resources
Full Text Sources
Other Literature Sources
Medical
