. 2017 Nov 29;9(418):eaam6375.
doi: 10.1126/scitranslmed.aam6375.

Rescue of Pompe disease in mice by AAV-mediated liver delivery of secretable acid α-glucosidase

Affiliations

Rescue of Pompe disease in mice by AAV-mediated liver delivery of secretable acid α-glucosidase

Francesco Puzzo et al. Sci Transl Med. .

Abstract

Glycogen storage disease type II or Pompe disease is a severe neuromuscular disorder caused by mutations in the lysosomal enzyme, acid α-glucosidase (GAA), which result in pathological accumulation of glycogen throughout the body. Enzyme replacement therapy is available for Pompe disease; however, it has limited efficacy, has high immunogenicity, and fails to correct pathological glycogen accumulation in nervous tissue and skeletal muscle. Using bioinformatics analysis and protein engineering, we developed transgenes encoding GAA that could be expressed and secreted by hepatocytes. Then, we used adeno-associated virus (AAV) vectors optimized for hepatic expression to deliver the GAA transgenes to Gaa knockout (Gaa-/-) mice, a model of Pompe disease. Therapeutic gene transfer to the liver rescued glycogen accumulation in muscle and the central nervous system, and ameliorated cardiac hypertrophy as well as muscle and respiratory dysfunction in the Gaa-/- mice; mouse survival was also increased. Secretable GAA showed improved therapeutic efficacy and lower immunogenicity compared to nonengineered GAA. Scale-up to nonhuman primates, and modeling of GAA expression in primary human hepatocytes using hepatotropic AAV vectors, demonstrated the therapeutic potential of AAV vector-mediated liver expression of secretable GAA for treating pathological glycogen accumulation in multiple tissues in Pompe disease.


Conflict of interest statement

Competing interests: F.P., P.C., D.D.K., G.R., and F.M. are inventors of patents describing the treatment of Pompe disease with liver gene therapy (acid-α glucosidase variants and uses thereof, application numbers EP16306148, EP16306149, and EP16306150; Immunomodulating gene therapy, WO2009075815). F.C., G.R., M.A.K., and F.M. are inventors of patents describing AAV-mediated liver gene transfer, some of them licensed to commercial companies (AAV capsid proteins for nuclei acid transfer, US20130059732; treatment of hyperbilirubinemia, CA2942451). N.K.P. and M.A.K. are inventors of patents describing the generation of new human hepatotropic AAV capsids (novel recombinant AAV capsids resistant to preexisting human neutralizing antibodies, WO2017143100). P.L., D.D.K., and F.M. have consulted for companies on the topic of Pompe disease and on the development of AAV gene therapies. All other authors declare that they have no competing interests.

Figures

Fig. 1
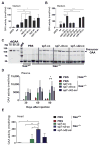
Fig. 1. Selection of engineered human GAA transgenes in vitro and in vivo
(A and B) Acid α-glucosidase (GAA) activity in conditioned media of HuH7 cells; enhanced green fluorescent protein (eGFP), negative control. Data are means ± SD of three independent experiments. wt, wild-type human GAA transgene; co, codon-optimized human GAA transgene; sp, signal peptide; Δ, deleted human GAA. (C to E) In vivo testing of adeno-associated virus (AAV) vectors expressing secretable GAA. Four-month-old mice were treated with phosphate-buffered saline (PBS) or with 2 × 10¹² vector genomes (vg)/kg of different AAV8 vectors and followed for 3 months. GAA transgenes were under the control of the hAAT promoter; Gaa+/+-PBS (n = 2), wild-type littermates; Gaa−/−-PBS (n = 3), untreated control; sp7-co (n = 4); sp7-Δ8-co (n = 4); and sp7-Δ42-co (n = 4). (C) Western blot analysis of plasma from treated mice, 3 months after treatment. The band detected at ~50 kDa in both PBS- and vector-treated Gaa−/−mice is nonspecific. Recombinant human GAA (rhGAA) was used as standard. MW, molecular weight marker. (D) GAA activity in plasma at different times after injection and (E) heart. Statistical analysis: one-way analysis of variance (ANOVA) with Tukey’s post hoc (A, B, and E) or two-way ANOVA (treatment, time) with Dunnett’s post hoc (D). Error bars represent SD of the mean. In (B), †††P < 0.001 compared to sp2-Δ8-coGAA, sp7-Δ8-coGAA, and sp8-Δ8-coGAA.
Fig. 2
Fig. 2. GAA activity and tissue glycogen in vivo
(A to C) Four-month-old mice were treated with PBS or AAV8 at the vector doses indicated and followed for 3 months (n = 4 to 5 per cohort) or 10 months (n = 8 to 9 per cohort; n = 3 Gaa−/−-PBS cohort; Gaa+/+-PBS, wild-type littermates; Gaa−/−-PBS, untreated control). (A) GAA activity in plasma. (B) GAA activity in different muscles. (C) Glycogen content in different muscle reported as percentage of PBS-treated Gaa−/− mice. (A to C) Statistical analysis: two-way ANOVA with Tukey’s post hoc (treatment, dose). Error bars represent SD of the mean. (C) Asterisks (*) indicate significant differences compared to all groups; dagger symbols (†) indicate significant differences compared to Gaa+/+-PBS. * or , P < 0.05; ** or ††, P < 0.01; *** or †††, P < 0.001; **** or ##, P < 0.0001.
Fig. 3
Fig. 3. Histology, GAA uptake, and autophagic buildup in triceps of treated Gaa−/− mice and controls
(A to E) Analysis of triceps in mice 10 months after treatment with AAV8 (2 × 10¹² vg/kg). Gaa+/+-PBS, wild-type littermates; Gaa−/−-PBS, untreated control. (A) Representative images of hematoxylin and eosin (H&E, top) and periodic acid–Schiff (PAS, bottom) staining of triceps. The scale bar is depicted. (B and D) Western blot analysis of triceps lysates using anti-GAA (B) or anti-p62 (D) monoclonal antibodies. An anti-tubulin antibody was used as loading control. (C and E) Quantification of GAA (C) or p62 (E) bands from the corresponding Western blots. Statistical analysis: (C) multiple t tests, with Sidak-Bonferroni post hoc. Gaa−/−-PBS, n = 2; Gaa−/−-co, n = 8; Gaa−/−-sp7-Δ8-co, n = 9. (E) One-way ANOVA with Tukey’s post hoc. Gaa+/+-PBS, n = 4; Gaa−/−-PBS, n = 3; Gaa−/−-co, n = 5; Gaa−/−-sp7-Δ8-co, n = 7. Error bars represent the SD of the mean.
Fig. 4
Fig. 4. Analysis of brain and spinal cord of treated Gaa−/− mice and controls
(A to I) Four-month-old mice treated with PBS or AAV8 vectors (2 × 10¹² vg/kg) and followed for 3 months (n = 4 to 5 per cohort) or 10 months (n = 8 to 9 per cohort; n = 3 Gaa−/−-PBS). Gaa+/+-PBS, wild-type littermates; Gaa−/−-PBS, untreated control. Western blot analysis of brain (A) and cervical spinal cord (B) lysates 10 months after treatment using a monoclonal anti-GAA antibody. An anti-tubulin antibody was used as loading control. (C) Quantification of glycogen content in brain 3 and 10 months after treatment. The quantification is reported as percentage of glycogen in Gaa−/− mice treated with PBS. (D to I) Analysis of spinal cord 10 months after treatment. (D) Count of choline acetyl transferase–positive (ChAT+) motor neurons (MN) in spinal cord. (E) Representative images of ChAT staining. (F) Count of ionized calcium binding adaptor molecule 1–positive (Iba1+) cells in the gray matter of spinal cord. (G) Representative images of Iba1 staining. (H) Glial fibrillary acidic protein (GFAP) fluorescence quantification in the gray matter of the spinal cord. AU, arbitrary units. (I) Representative images of GFAP staining. In all images, cells were stained with the nuclear marker 4′,6-diamidino-2-phenylindole (DAPI). Scale bars, 200 μm (I, top) and 25 μm (E, G, and I, bottom). (D to I) Gaa−/−-PBS, n = 2; n = 3 for the other cohorts. Error bars represent SD of the mean. Statistical analysis: (C) two-way ANOVA with Tukey’s post hoc (treatment, time); (D, F, and H) two-way ANOVA with Tukey’s post hoc (treatment, region of spinal cord).
Fig. 5
Fig. 5. Anti-human GAA humoral immune responses in Gaa−/− mice
(A and B) Analysis of anti-human GAA immunoglobulin G (IgG) in plasma samples from treated Gaa−/− mice. (A) Anti-human GAA IgG measured at 1 month after treatment at a vector dose of 5 × 10¹¹ vg/kg (n = 5 per cohort) or 2 × 10¹² vg/kg (n = 8 to 9 per cohort). (B) Anti-human GAA IgG over time in animals treated at a vector dose of 2 × 10¹² vg/kg (n = 8 to 9 per cohort). Error bars represent the SD of the mean. Statistical analysis: (A) one-way ANOVA with Dunnett’s post hoc; (B) two-way ANOVA with Tukey’s post hoc (treatment, time). (B) *P < 0.05 for co at 1 month compared to sp2-Δ8-co or sp7-Δ8-co at 1 month, and co at 1 month compared to co at 3 or 9 months.
Fig. 6
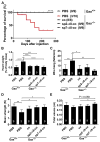
Fig. 6. Long-term outcome of gene therapy in treated Gaa−/− mice and controls
(A to E) Four-month-old mice treated with PBS or AAV8 vectors (2 × 10¹² vg/kg) and followed for 10 months (n = 8 to 9 per cohort; n = 3 Gaa−/−-PBS). Gaa+/+-PBS, wild-type littermates; Gaa−/−-PBS, untreated control. (A) Kaplan-Meier curve showing the percentage of survival from 4 to 14 months of age. The number of live animals per cohort at the end of the study is indicated in brackets. ****P < 0.0001 compared to Gaa−/−-PBS, log-rank Mantel-Cox test. (B) Cardiac hypertrophy showed as heart weight expressed as percentage of body mass. (C to E) Functional tests 9 months after treatment. (C) Wire hang test shown as falls per minute. (D) Grip test as mean of three independent measurements. (E) Tidal volume measured by whole-body plethysmography. Statistical analysis: one-way ANOVA with Tukey’s post hoc (B to D) or Dunnett’s post hoc (E). The number of animals per treatment cohort is shown in the histogram bars. Error bars represent the SD of the mean.
Fig. 7
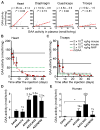
Fig. 7. Scale-up of AAV vector–mediated liver gene transfer of secretable GAA to nonhuman primates
(A to C) Male cynomolgus monkeys (n = 3) were treated with AAV8-hAAT-sp7-Δ8-coGAA (AAV-GAA) (2 × 10¹² vg/kg) and followed up for 90 days. (A) Western blot analysis of plasma using an anti-GAA antibody. rhGAA was used as loading control. NHP, nonhuman primate. (B) GAA activity in plasma. Basal, endogenous GAA activity in monkeys #1 to #3 before injection and five additional control monkeys (n = 8). Statistical analysis: one-way ANOVA with Tukey’s post hoc. Error bars represent the SD of the mean. (C) GAA activity in liver, heart, diaphragm, biceps, and triceps. Endogenous GAA activity was measured in six monkeys treated with an unrelated AAV vector [control (Ctrl)]. Statistical analysis: multiple t test.
Fig. 8
Fig. 8. Therapeutic potential of AAV vector–mediated liver gene transfer for Pompe disease
(A) Regression plots showing the correlation between GAA activity measured in plasma compared to heart, diaphragm, quadriceps, or triceps in AAV-GAA–treated Gaa−/− mice. Combined data from 3 months in vivo experiments (tables S1 and S2). The linear regression formula and the regression coefficient (r2) are depicted. (B and C) Time course of GAA activity in heart (B) and triceps (C) of Gaa−/−mice infused with rhGAA at 100 mg/kg biweekly for a total of two infusions. Each time point represents the average of four to six animals. Error bars represent SD of the mean. Red lines, activity regression curves. Horizontal black lines mark the median GAA activity measured in tissues of Gaa−/− mice 3 months after treatment with AAV8-hAAT-sp7-Δ8-coGAA vectors at 2 × 10¹² vg/kg (solid line) or 5 × 10¹¹ vg/kg (dotted line). The horizontal green line indicates the mean (after baseline subtraction) GAA activity measured in tissues of monkeys 3 months after treatment with the same AAV8-hAAT-sp7-Δ8-coGAA vector at a dose of 2 × 10¹² vg/kg. (D and E) GAA activity measured in the conditioned media of primary NHP (D) or human (E) hepatocytes 48 hours after transduction with different serotypes of AAV-hAAT-sp7-Δ8-coGAA vector at a multiplicity of infection of 1 × 10⁵. The numbers above the bars indicate the fold increase of GAA activity compared to AAV8-transduced cells. Means of two-well testing for (D) are shown. Error bars in (E) represent the SD of the mean of three independent experiments except for AAVrh74 (n = 1). Statistical analysis: one-way ANOVA with Dunnett’s post hoc.

Comment in

References

    1. van der Ploeg AT, Reuser AJJ. Pompe’s disease. Lancet. 2008;372:1342–1353. - PubMed
    1. Kishnani PS, Corzo D, Nicolino M, Byrne B, Mandel H, Hwu WL, Leslie N, Levine J, Spencer C, McDonald M, Li J, Dumontier J, Halberthal M, Chien YH, Hopkin R, Vijayaraghavan S, Gruskin D, Bartholomew D, van der Ploeg A, Clancy JP, Parini R, Morin G, Beck M, De la Gastine GS, Jokic M, Thurberg B, Richards S, Bali D, Davison M, Worden MA, Chen YT, Wraith JE. Recombinant human acid α-glucosidase: Major clinical benefits in infantile-onset Pompe disease. Neurology. 2007;68:99–109. - PubMed
    1. Schoser B, Stewart A, Kanters S, Hamed A, Jansen J, Chan K, Karamouzian M, Toscano A. Survival and long-term outcomes in late-onset Pompe disease following alglucosidase alfa treatment: A systematic review and meta-analysis. J Neurol. 2017;264:621–630. - PubMed
    1. van der Ploeg AT, Clemens PR, Corzo D, Escolar DM, Florence J, Groeneveld GJ, Herson S, Kishnani PS, Laforet P, Lake SL, Lange DJ, Leshner RT, Mayhew JE, Morgan C, Nozaki K, Park DJ, Pestronk A, Rosenbloom B, Skrinar A, van Capelle CI, van der Beek NA, Wasserstein M, Zivkovic SA. A randomized study of alglucosidase alfa in late-onset Pompe’s disease. N Engl J Med. 2010;362:1396–1406. - PubMed
    1. Kishnani PS, Beckemeyer AA. New therapeutic approaches for Pompe disease: Enzyme replacement therapy and beyond. Pediatr Endocrinol Rev. 2014;12(suppl 1):114–124. - PubMed

Substances