. 2017 Nov 15:8:1564.
doi: 10.3389/fimmu.2017.01564. eCollection 2017.

Fine-Tuning of Optimal TCR Signaling in Tumor-Redirected CD8 T Cells by Distinct TCR Affinity-Mediated Mechanisms

Affiliations

Fine-Tuning of Optimal TCR Signaling in Tumor-Redirected CD8 T Cells by Distinct TCR Affinity-Mediated Mechanisms

Danilo Presotto et al. Front Immunol. .

Abstract

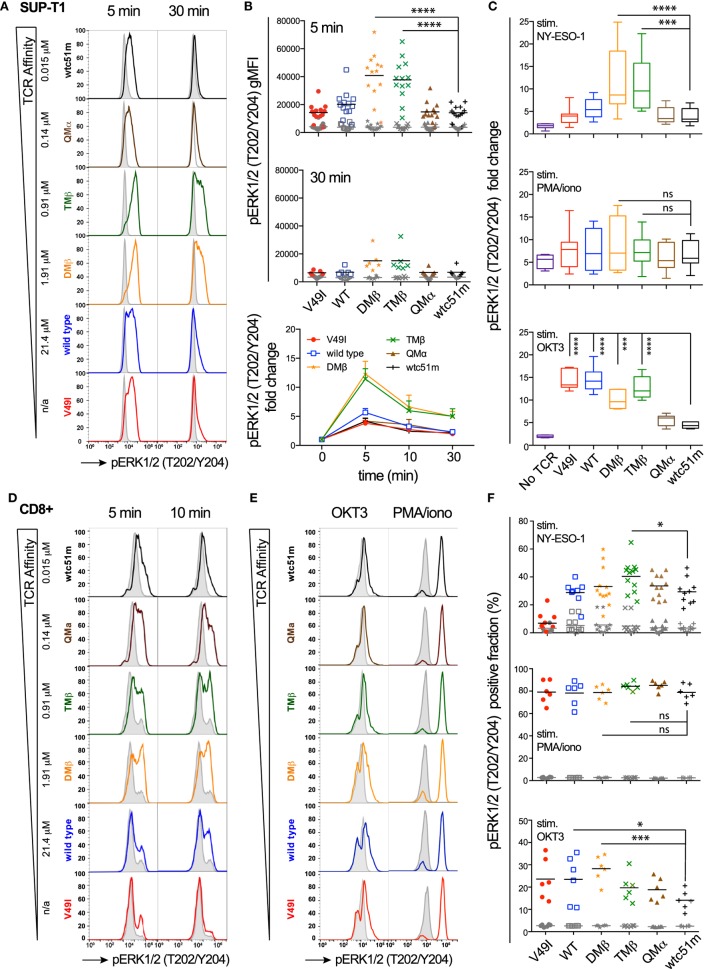
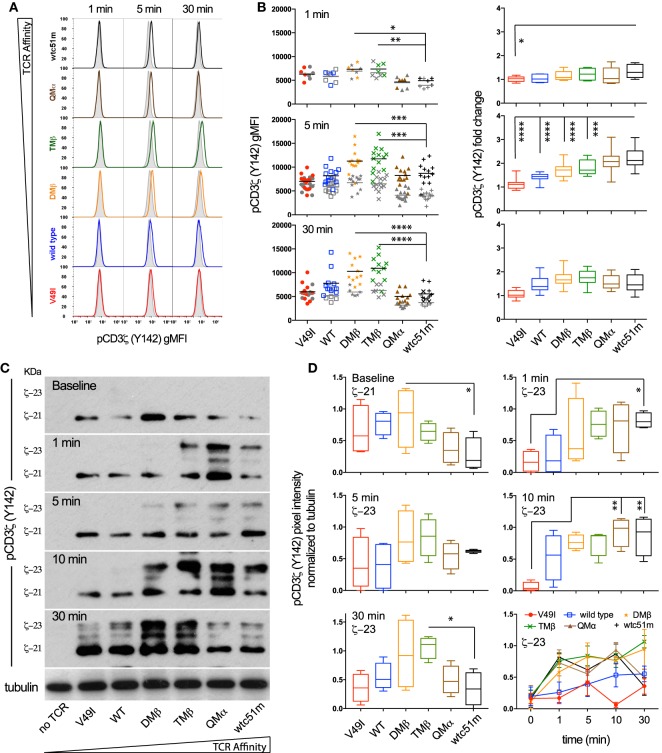
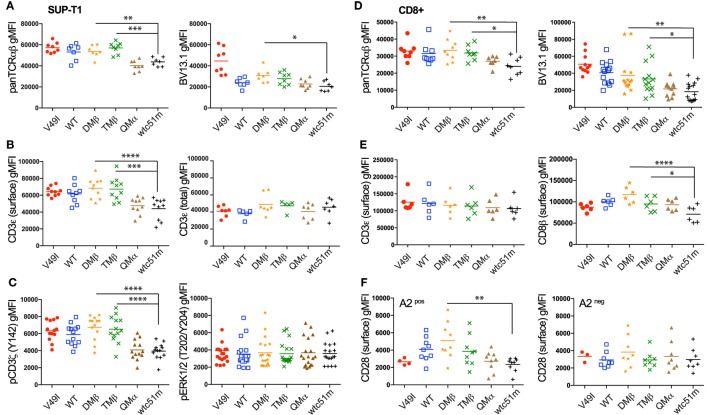
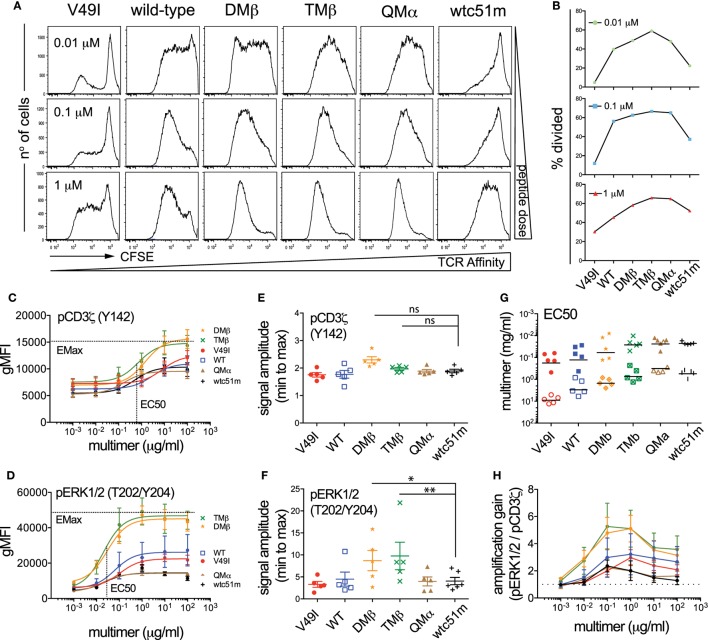
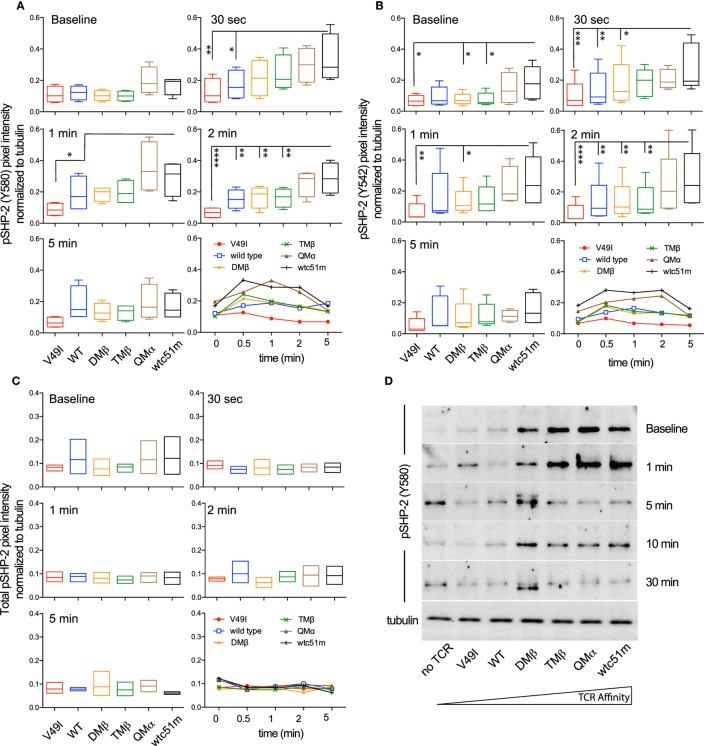
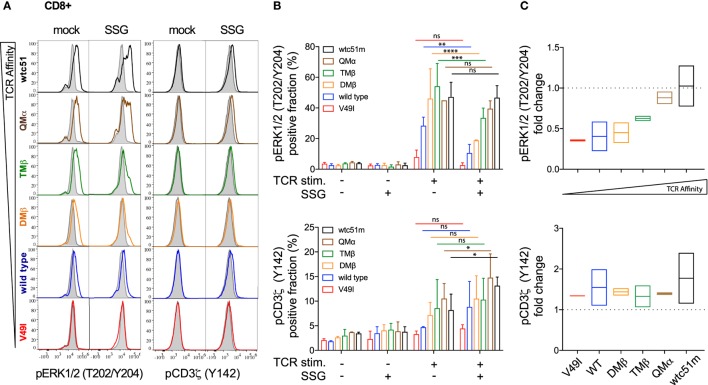
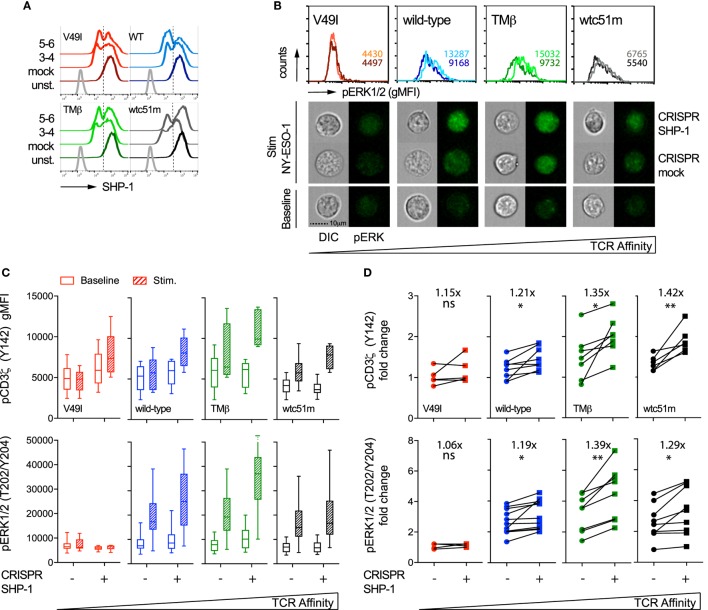
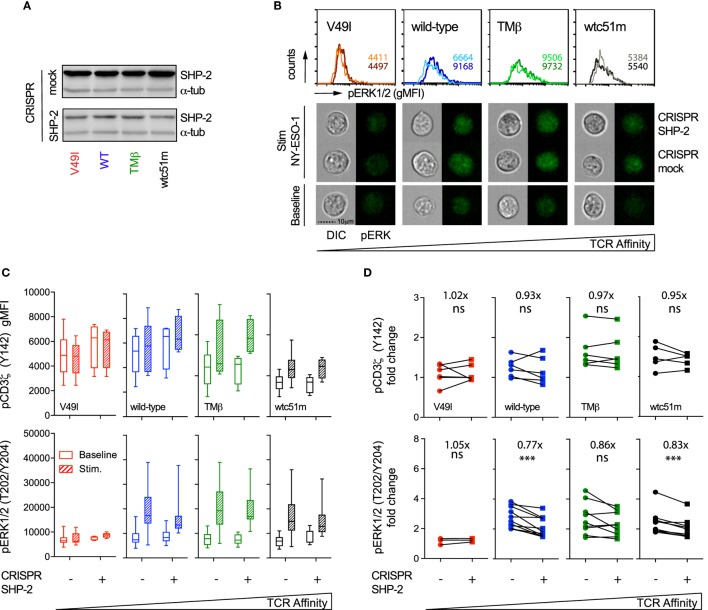
Redirecting CD8 T cell immunity with self/tumor-specific affinity-matured T cell receptors (TCRs) is a promising approach for clinical adoptive T cell therapy, with the aim to improve treatment efficacy. Despite numerous functional-based studies, little is known about the characteristics of TCR signaling (i.e., intensity, duration, and amplification) and the regulatory mechanisms underlying optimal therapeutic T cell responses. Using a panel of human SUP-T1 and primary CD8 T cells engineered with incremental affinity TCRs against the cancer-testis antigen NY-ESO-1, we found that upon activation, T cells with optimal-affinity TCRs generated intense and sustained proximal (CD3ζ, LCK) signals associated with distal (ERK1/2) amplification-gain and increased function. In contrast, in T cells with very high affinity TCRs, signal initiation was rapid and strong yet only transient, resulting in poor MAPK activation and low proliferation potential even at high antigen stimulation dose. Under resting conditions, the levels of surface TCR/CD3ε, CD8β, and CD28 expression and of CD3ζ phosphorylation were significantly reduced in those hyporesponsive cells, suggesting the presence of TCR affinity-related activation thresholds. We also show that SHP phosphatases were involved along the TCR affinity gradient, but displayed spatially distinct regulatory roles. While PTPN6/SHP-1 phosphatase activity controlled TCR signaling initiation and subsequent amplification by counteracting CD3ζ and ERK1/2 phosphorylation, PTPN11/SHP-2 augmented MAPK activation without affecting proximal TCR signaling. Together, our findings indicate that optimal TCR signaling can be finely tuned by TCR affinity-dependent SHP-1 and SHP-2 activity, and this may readily be determined at the TCR/CD3 complex level. We propose that these TCR affinity-associated regulations represent potential protective mechanisms preventing high affinity TCR-mediated autoimmune diseases.

Keywords: CD3ζ; ERK1/2; NY-ESO-1 antigen; SHP-1; SHP-2 phosphatases; T cell receptor engineering; T cell receptor-peptide-major histocompatibility complex affinity; cancer immunotherapy; hyporesponsiveness.


Figures

Figure 1
Figure 1
Temporal quantification of distal ERK1/2 phosphorylation levels in T cells engineered with T cell receptor (TCR) of incremental affinities. (A) Representative histograms of the phosphorylation levels of ERK1/2 by phospho-flow at baseline (gray) and the indicated time-points (color) of TCR-transduced SUP-T1 stimulated with NY-ESO-1-specific unlabeled multimers. KD affinity values (μM) (3) for each TCR variant are indicated. (B) Quantification of pERK1/2 levels [geometric mean fluorescence intensity (gMFI)] for the TCR-transduced SUP-T1 variants (n > 6 independent experiments) at baseline, 5, 10, and 30 min poststimulation with NY-ESO-1-specific unlabeled multimers. (C) Relative intensity of ERK1/2 phosphorylation levels for the indicated TCR affinity variants (n = 6 independent experiments) after 5 min stimulation with NY-ESO-1-specific unlabeled multimers (top panel), PMA/ionomycin (middle), or OKT3 (anti-CD3ε) antibody (bottom). Data are depicted as box (25th and 75th percentile) and whisker (min to max) with the middle line representing the median. (D) Representative histograms of the phosphorylation levels of ERK1/2 by phospho-flow at baseline (gray) and at the indicated time-points (color) of TCR-transduced primary CD8 T cells stimulated with NY-ESO-1-specific unlabeled multimers. (E) Representative histograms of the phosphorylation levels of ERK1/2 by phospho-flow at baseline (gray) and at 5 min (color) of TCR-transduced primary CD8 T cells stimulated with OKT3 (anti-CD3ε) antibody or PMA/Ionomycin. (F) Positive fraction of ERK1/2 phosphorylation in primary CD8 T cells expressing the indicated TCR affinity variants (n ≥ 6 independent experiments) at baseline (gray) and after 5 min stimulation with NY-ESO-1-specific unlabeled multimers (top panel), PMA/ionomycin (middle) or OKT3 (anti-CD3ε) antibody (bottom). Statistical analyses were performed with matched, one-way ANOVA tests followed by Dunnett’s multiple comparisons. Significance of the adjusted p value at α = 0.05 is given by the following symbols: ns (p > 0.05) and *p ≤ 0.05, **p ≤ 0.01, ***p ≤ 0.001, ****p ≤ 0.0001. (A–F) ERK1/2 phosphorylation levels obtained by phospho-flow for each TCR variant are depicted by distinct symbols and color codes.
Figure 2
Figure 2
Temporal quantification of proximal CD3ζ phosphorylation levels in T cells engineered with T cell receptor (TCR) of incremental affinities. (A) Representative histograms of the phosphorylation levels of CD3ζ (Y142) at baseline (gray) and the indicated time-points (color) of TCR-transduced SUP-T1 variants stimulated with NY-ESO-1-specific unlabeled multimers. (B) Quantification of the absolute intensity [left panels, geometric mean fluorescence intensity (gMFI)] and relative intensity (right panels, fold change) of pCD3ζ (Y142) by phospho-flow for the indicated TCR-transduced SUP-T1 variants at 1, 5, and 30 min poststimulation with NY-ESO-1-specific unlabeled multimers (n > 10 independent experiments). (C) Levels of steady-state 21 kDa and fully activated 23 kDa immune-receptor tyrosine-based activating motif (ITAM)/pCD3ζ complexes of TCR-transduced SUP-T1 variants at baseline and at the indicated time-points after stimulation with NY-ESO-1-specific unlabeled multimers. Alpha-tubulin expression levels were used as loading controls between samples. Data are representative of four independent Western blot experiments. (D) Quantification of the relative pixel intensities of the baseline 21 kDa and fully activated 23 kDa ITAM/pCD3ζ bands detected by Western blot and normalized to α-tubulin in the TCR-transduced SUP-T1 variants at the indicated time-points after stimulation with NY-ESO-1-specific unlabeled multimers (n = 4 separate experiments). (B,D) Data are depicted as box (25th and 75th percentile) and whisker (min to max) with the middle line representing the median. Statistical analyses were performed with matched, one-way ANOVA tests followed by Dunnett’s multiple comparisons. Significance of the adjusted p value at α = 0.05 is given by the following symbols: ns p > 0.05 and *p ≤ 0.05, **p ≤ 0.01, ***p ≤ 0.001, ****p ≤ 0.0001. (A,B,D) Each TCR variant is depicted by a distinct symbol and color code.
Figure 3
Figure 3
Baseline expression levels of the T cell receptor (TCR)/CD3 complex in SUP-T1 and primary CD8 T cells engineered with TCR of incremental affinities. (A–C) Quantification of the expression (A–B) and phosphorylation (C) levels [geometric mean fluorescence intensity (gMFI)] of unstimulated, baseline (A) pan TCRαβ and TRBV13.1, (B) extracellular CD3ε and total intra- and extracellular CD3ε, and (C) CD3ζ (Y142) and ERK1/2(T202/Y204) for the indicated TCR-transduced SUP-T1 variants. Data are representative of 5–20 independent experiments. (D–E) Quantification of the expression levels (gMFI) of unstimulated, baseline (D) pan TCRαβ and TRBV13.1 and (E) extracellular CD3ε and CD8β for the indicated TCR-transduced primary CD8 T cell variants. Data are representative of 6–15 independent experiments. (F) Quantification of the CD28 expression levels for the indicated TCR-transduced primary CD8 T cells isolated from an HLA-A2pos (left panel) or an HLA-A2neg (right panel) healthy donor under resting, unstimulated culture conditions. Data are representative of three to nine independent experiments (A–F) Statistical analyses were performed with matched, one-way ANOVA tests followed by Dunnett’s multiple comparisons. Significance of the adjusted p value at α = 0.05 is given by the following symbols: **p ≤ 0.01, ***p ≤ 0.001, ****p ≤ 0.0001. Each TCR variant is depicted by a distinct symbol and color code.
Figure 4
Figure 4
Effect of antigen dose on proliferation and T cell receptor (TCR)-mediated signal intensity and amplification of pCD3ζ and pERK1/2. (A) Proliferation analysis performed at day 7 for the indicated variant of CFSE-labeled, TCR-transduced primary CD8 T cells after stimulation with titrating doses of NY-ESO-1 antigen-pulsed irradiated PBMCs. (B) Quantification of the percentage of divided cells (frequency of dividing cells) from the proliferation histograms shown in (A). Data obtained from the different antigen doses (0.01, 0.1, and 1 µM) are depicted as individual graphs. (C,D) Average phosphorylation levels of (C) CD3ζ (Y142) (n = 5 independent experiments) and (D) ERK1/2 (n = 5) by phospho-flow following stimulation at 5 min of the indicated TCR-transduced SUP-T1 variants with titrating doses of NY-ESO-1-specific unlabeled multimers. (E,F) Quantification of the signal amplitude (from minimal to maximal Emax level) of (E) pCD3ζ (Y142) and (F) pERK1/2 for the indicated TCR-transduced SUP-T1 variants. Statistical analyses were performed with matched, one-way ANOVA tests followed by Dunnett’s multiple comparisons. Significance of the adjusted p value at α = 0.05 is given by the following symbols: ns p > 0.05 and *p ≤ 0.05, **p ≤ 0.01. (G) Quantification of the EC50 antigen dose producing half of the maximal signal amplitude for pCD3ζ (Y142) (open symbols) and pERK1/2 (plain symbols) for the indicated TCR-transduced SUP-T1 variants. (H) Quantification of the signal amplification gain (relative fold increase) from pCD3ζ (Y142) to pERK1/2 following 5 min stimulation of the indicated TCR-transduced SUP-T1 variants with titrating doses of NY-ESO-1-specific unlabeled multimers. (C–H) Each TCR variant is depicted by a distinct symbol and color code.
Figure 5
Figure 5
Temporal quantification of SHP-2 phosphorylation levels in T cells engineered with T cell receptor (TCR) of incremental affinities. (A–C) Relative intensity of (A) pSHP-2(Y580) (n = 4 independent experiments), (B) pSHP-2(Y542) (n = 5), and (C) total SHP-2 (n = 3) levels obtained by RPPA at baseline and at the indicated time-points after stimulation of the SUP-T1 cells with NY-ESO-1-specific unlabeled multimers. Data are depicted as box (25th and 75th percentile) and whisker (min to max) with the middle line representing the median. Each TCR variant is depicted by distinct color codes. Statistical analyses were performed with matched, one-way ANOVA tests followed by Dunnett’s multiple comparisons. Significance of the adjusted p value at α = 0.05 is given as following: *p ≤ 0.05, **p ≤ 0.01, ***p ≤ 0.001, ****p ≤ 0.0001. (D) Levels of pSHP-2(Y580) of TCR-transduced SUP-T1 variants at baseline and at the indicated time-points after stimulation with NY-ESO-1-specific unlabeled multimers by Western blotting. Alpha-tubulin expression levels were used as loading controls between samples. Data are representative of three independent experiments.
Figure 6
Figure 6
Effect of sodium stibogluconate (SSG) on proximal CD3ζ and distal ERK1/2 phosphorylation levels in T cell receptor (TCR)-engineered primary CD8 T cells. (A) Representative histograms of the phosphorylation levels [geometric mean fluorescence intensity (gMFI)] of ERK1/2 (left) and CD3ζ (Y142) (right) by phospho-flow at baseline (gray) and 5 min poststimulation with NY-ESO-1-specific unlabeled multimers (color) of TCR-transduced primary CD8 T cell variants pretreated (SSG) or not (mock) with SSG. (B) Quantification of the positive fraction of pERK1/2 (upper panel) and pCD3ζ (Y142) (lower panel) in the indicated TCR-transduced CD8 T cell variants, pretreated (SSG, +) or not (SSG, −) with SSG, at baseline (TCR stim., −) or after 5 min of stimulation (TCR stim., +) with NY-ESO-1-specific unlabeled multimer (n = 2 independent experiments). Statistical analyses were performed with matched, two-way ANOVA tests followed by Tukey’s multiple comparisons. Significance of the adjusted p value at α = 0.05 is given by the following symbols: ns p > 0.05 and *p ≤ 0.05, **p ≤ 0.01, ***p ≤ 0.001, ****p ≤ 0.0001. (C) SSG-mediated fold change in the fraction of ERK1/2 (upper panel) and CD3ζ (Y142) (lower panel) phosphorylation levels for the indicated TCR-transduced CD8 T cell variants after 5 min stimulation. Data are depicted as box (min to max) with the middle line representing the mean. (A–C) Each TCR variant is depicted by distinct color codes.
Figure 7
Figure 7
Effect of partial SHP-1 knock-out by CRISPR/Cas9 on proximal pCD3ζ and distal pERK1/2 signal intensity. (A) Representative histograms of the expression levels [geometric mean fluorescence intensity (gMFI)] of total SHP-1 in T cell receptor (TCR)-transduced SUP-T1 variants following CRISPR/Cas9-mediated GFP (mock) or SHP-1 [single guide RNA (sgRNA) no 3–4 and no 5–6] targeting. Unstained (unst.) controls are shown alongside. (B) Representative quantitative (histograms in gMFI) and qualitative (cells) data acquired with the ImageStream flow cytometer depicting the expression levels of pERK1/2 in TCR-transduced SUP-T1 variants following CRISPR/Cas9-mediated GFP mock or SHP-1 targeting. Values within the histograms indicate the average expression levels (in gMFI) of pERK1/2 following CRISPR/Cas 9-mediated GFP mock (dark) and SHP-1 (dark) targeting after stimulation with NY-ESO-1-specific unlabeled multimers. (C) Quantification of the total phosphorylation levels (gMFI) of CD3ζ (Y142) (upper panels, n > 4 independent experiments) and ERK1/2 (lower panels, n > 4 independent experiments) by phospho-flow for the indicated TCR-transduced SUP-T1 variants following CRISPR/Cas9-mediated GFP (mock; −) or SHP-1 (no 5–6; +) targeting, at baseline or after 5 min of stimulation with NY-ESO-1-specific unlabeled multimers. Data are depicted as box (25th and 75th percentile) and whisker (min to max) with the middle line representing the median. (D) Comparison of the relative differences (fold change phosphorylation levels between baseline and 5 min of stimulation) of pCD3ζ (Y142) (upper panels) and pERK1/2 (lower panels) for the indicated TCR-transduced SUP-T1 variants following CRISPR/Cas9-mediated mock (−) and SHP-1 (+) targeting. Fold change (average) in phosphorylation intensity due to SHP-1 targeting is indicated for all conditions. Statistical analyses were performed with two-tailed, paired t tests. Significance of the p value at α = 0.05 is given by the following symbols: ns p > 0.05 and *p ≤ 0.05, and **p ≤ 0.01. (A–D) Each TCR variant is depicted by a distinct color code.
Figure 8
Figure 8
Effect of partial SHP-2 knock-out by CRISPR/Cas9 on proximal pCD3ζ and distal pERK1/2 signal intensity. (A) Representative Western blots of the expression level of total SHP-2 in T cell receptor (TCR)-transduced SUP-T1 variants following CRISPR/Cas9-mediated GFP (mock) or SHP-2 (sgRNA no 9–10) targeting. Alpha-tubulin expression control is shown alongside. (B) Representative quantitative (histograms in gMFI) and qualitative (cells) data acquired with the ImageStream flow cytometer depicting the expression levels of pERK1/2 in TCR-transduced SUP-T1 variants following CRISPR/Cas9-mediated GFP mock or SHP-2 targeting. Values within the histograms indicate the average expression levels (in gMFI) of pERK1/2 following CRISPR/Cas 9-mediated GFP mock (dark) and SHP-2 (dark) targeting after stimulation with NY-ESO-1-specific unlabeled multimers. (C) Quantification of the total phosphorylation levels (gMFI) of CD3ζ (Y142) (upper panels, n > 4 independent experiments) and ERK1/2 (lower panels, n > 4 independent experiments) by phospho-flow for the indicated TCR-transduced SUP-T1 variants following CRISPR/Cas9-mediated GFP (mock; −) or SHP-2 (+) targeting, at baseline or after 5 min of stimulation with NY-ESO-1-specific unlabeled multimers. Data are depicted as box (25th and 75th percentile) and whisker (min to max) with the middle line representing the median. (D) Comparison of the relative differences (fold change phosphorylation levels between baseline and 5 min of stimulation) of pCD3ζ (Y142) (upper panels) and pERK1/2 (lower panels) for the indicated TCR-transduced SUP-T1 variants following CRISPR/Cas9-mediated mock (−) and SHP-2 (+) targeting. Fold change (average) in phosphorylation intensity due to SHP-2 targeting is indicated for all conditions. Statistical analyses were performed with two-tailed, paired t tests. Significance of the p value at α = 0.05 is given by the following symbols: ns p > 0.05 and ***p ≤ 0.001. (A–D) Each TCR variant is depicted by a distinct color code.

References

    1. Aleksic M, Liddy N, Molloy PE, Pumphrey N, Vuidepot A, Chang K-M, et al. Different affinity windows for virus and cancer-specific T-cell receptors: implications for therapeutic strategies. Eur J Immunol (2012) 42:3174–9.10.1002/eji.201242606 - DOI - PMC - PubMed
    1. Hebeisen M, Allard M, Gannon PO, Schmidt J, Speiser DE, Rufer N. Identifying individual T cell receptors of optimal avidity for tumor antigens. Front Immunol (2015) 6:2455.10.1158/0008-5472.CAN-12-1123 - DOI - PMC - PubMed
    1. Irving M, Zoete V, Hebeisen M, Schmid D, Baumgartner P, Guillaume P, et al. Interplay between T cell receptor binding kinetics and the level of cognate peptide presented by major histocompatibility complexes governs CD8+ T cell responsiveness. J Biol Chem (2012) 287:23068–78.10.1074/jbc.M112.357673 - DOI - PMC - PubMed
    1. McMahan RH, McWilliams JA, Jordan KR, Dow SW, Wilson DB, Slansky JE. Relating TCR-peptide-MHC affinity to immunogenicity for the design of tumor vaccines. J Clin Invest (2006) 116:2543–51.10.1172/JCI26936DS1 - DOI - PMC - PubMed
    1. Lever M, Lim H-S, Kruger P, Nguyen J, Trendel N, Abu-Shah E, et al. Architecture of a minimal signaling pathway explains the T-cell response to a 1 million-fold variation in antigen affinity and dose. Proc Natl Acad Sci U S A (2016) 113:E6630–8.10.1073/pnas.1608820113 - DOI - PMC - PubMed