

Detection of Treatment Success after Photodynamic Therapy Using Dynamic Contrast-Enhanced Magnetic Resonance Imaging
- PMID: 29187893
- PMCID: PMC5706089
- DOI: 10.7150/thno.20418
Detection of Treatment Success after Photodynamic Therapy Using Dynamic Contrast-Enhanced Magnetic Resonance Imaging
Abstract
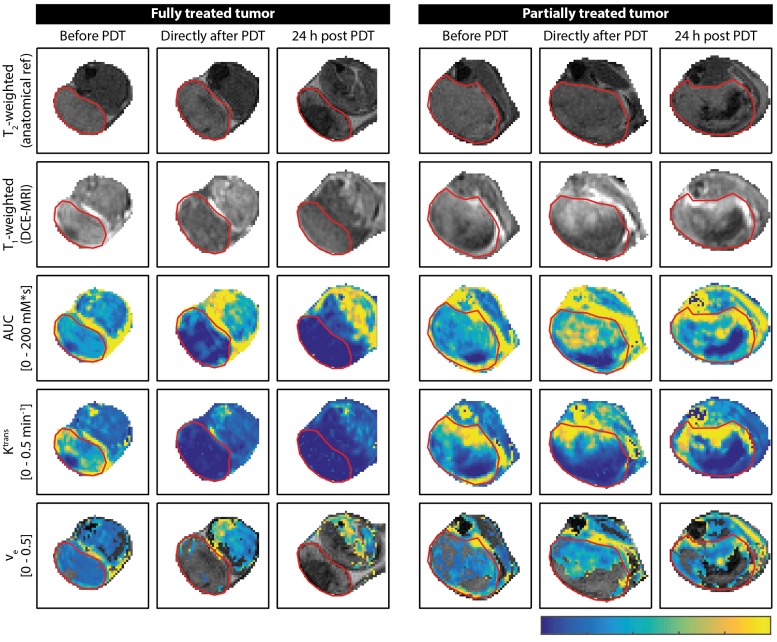
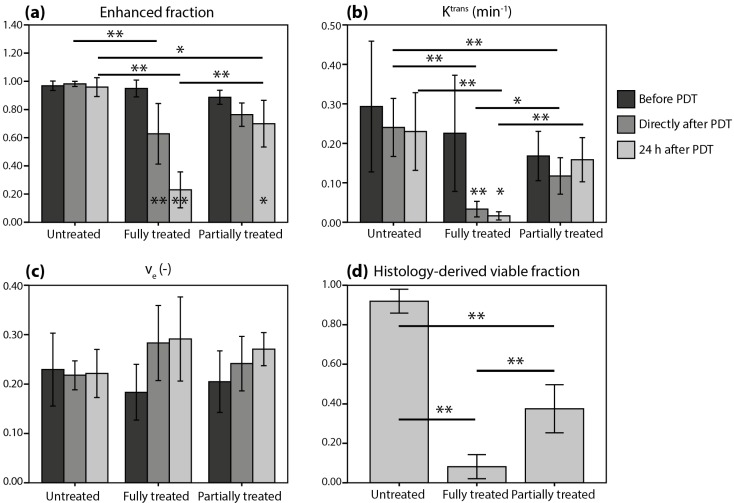
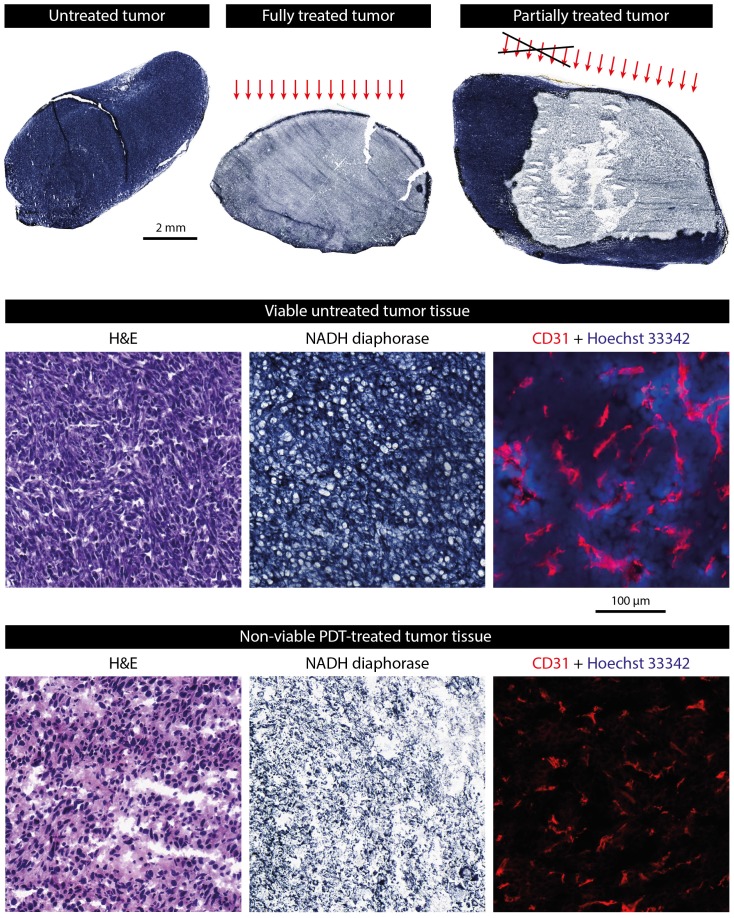
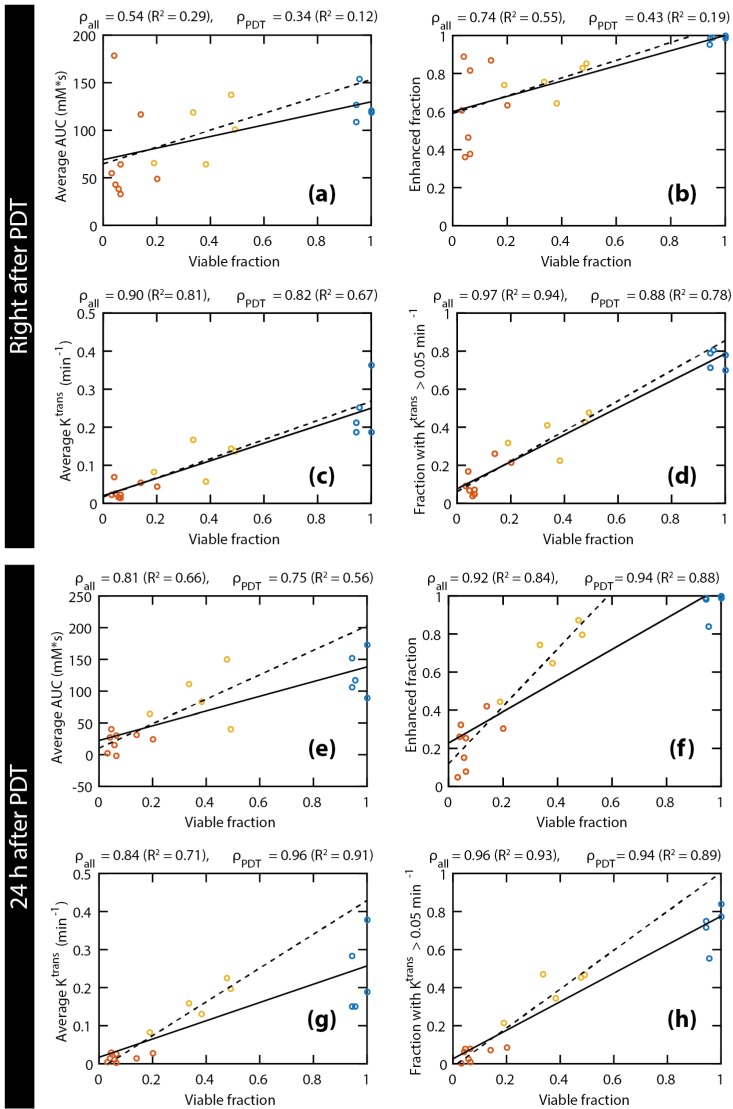
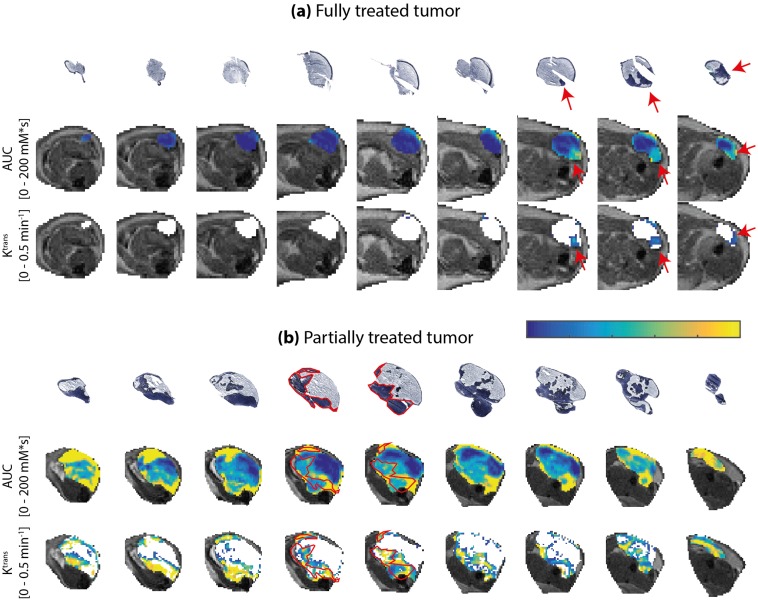
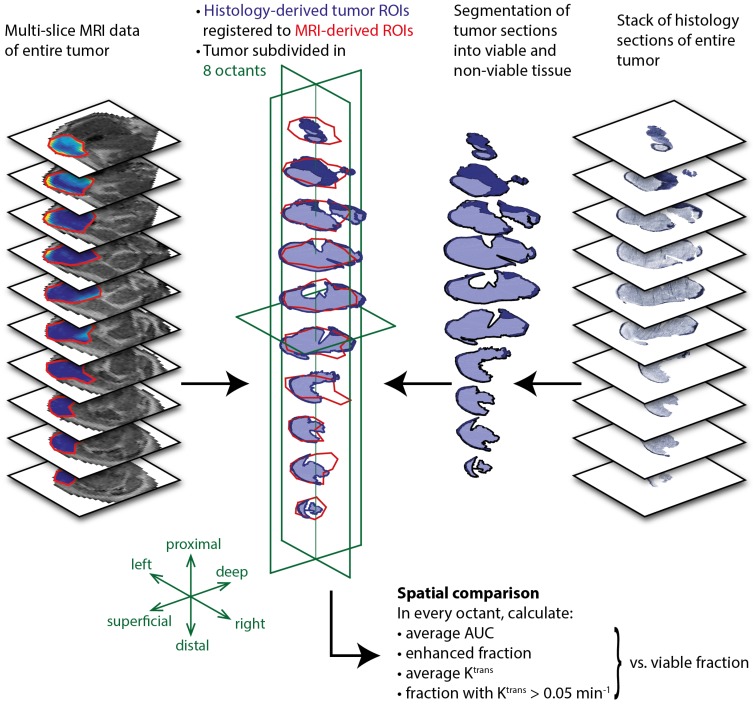
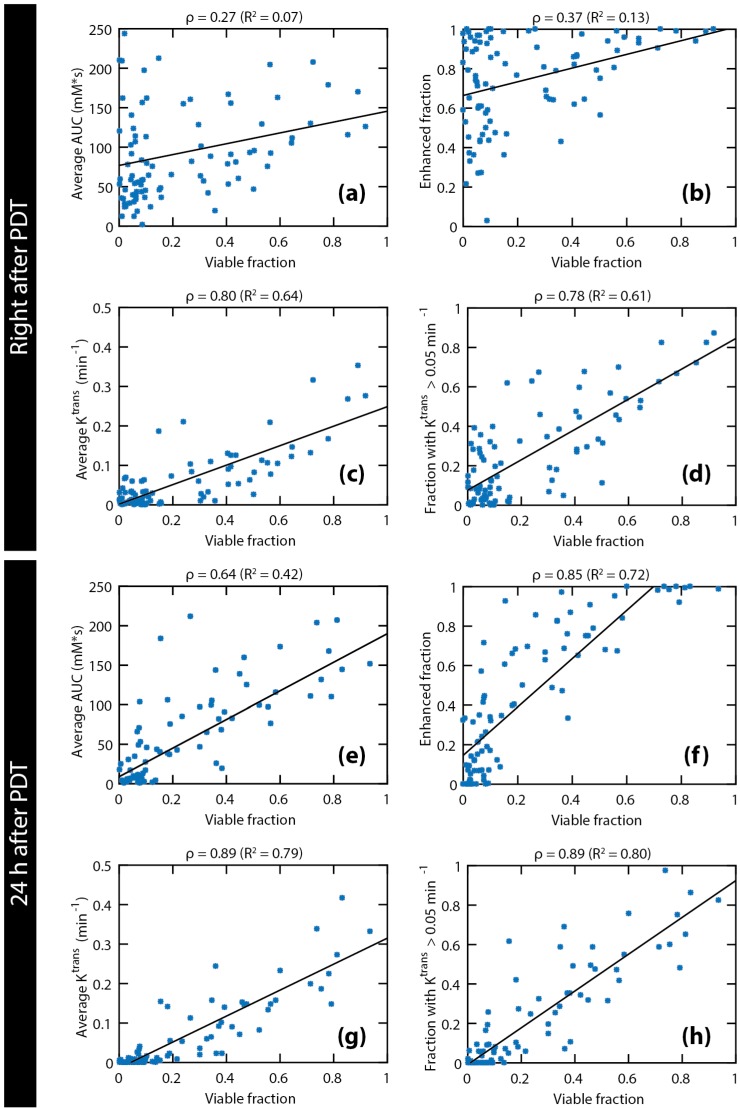
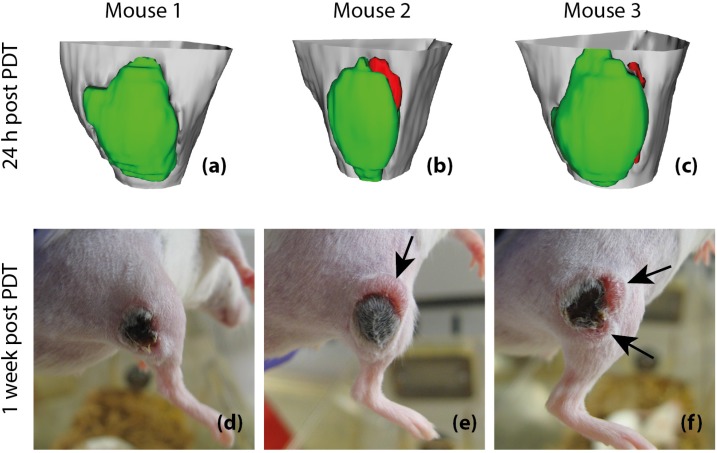
Early evaluation of response to therapy is crucial for selecting the optimal therapeutic follow-up strategy for cancer patients. PDT is a photochemistry-based treatment modality that induces tumor tissue damage by cytotoxic oxygen radicals, generated by a pre-injected photosensitive drug upon light irradiation of tumor tissue. Vascular shutdown is an important mechanism of tumor destruction for most PDT protocols. In this study, we assessed the suitability of Dynamic Contrast-Enhanced Magnetic Resonance Imaging (DCE-MRI) to evaluate treatment efficacy within a day after photodynamic therapy (PDT), using the tumor vascular response as a biomarker for treatment success. Methods: DCE-MRI at 7 T was used to measure the micro-vascular status of subcutaneous colon carcinoma tumors before, right after, and 24 h after PDT in mice. Maps of the area under the curve (AUC) of the contrast agent concentration were calculated from the DCE-MRI data. Besides, tracer kinetic parameters including Ktrans were calculated using the standard Tofts-Kermode model. Viability of tumor tissue at 24 h after PDT was assessed by histological analysis. Results: PDT led to drastic decreases in AUC and Ktrans or complete loss of enhancement immediately after treatment, indicating a vascular shutdown in treated tumor regions. Histological analysis demonstrated that the treatment induced extensive necrosis in the tumors. For PDT-treated tumors, the viable tumor fraction showed a strong correlation (ρ ≥ 0.85) with the tumor fraction with Ktrans > 0.05 min-1 right after PDT. The viable tumor fraction also correlated strongly with the enhanced fraction, the average Ktrans , and the fraction with Ktrans > 0.05 min-1 at 24 h after PDT. Images of the viability stained tumor sections were registered to the DCE-MRI data, demonstrating a good spatial agreement between regions with Ktrans > 0.05 min-1 and viable tissue regions. Finally, 3D post-treatment viability detection maps were constructed for the tumors of three mice by applying a threshold (0.05 min-1) to Ktrans at 24 h after PDT. As a proof of principle, these maps were compared to actual tumor progression after one week. Complete tumor response was correctly assessed in one animal, while residual viable tumor tissue was detected in the other two at the locations where residual tumor tissue was observed after one week. Conclusion: This study demonstrates that DCE-MRI is an effective tool for early evaluation of PDT tumor treatment.
Keywords: Dynamic contrast-enhanced magnetic resonance imaging; mouse tumor model; photodynamic therapy; treatment response evaluation; tumor perfusion.
Conflict of interest statement
Competing Interests: The authors have declared that no competing interest exists.
Figures
Similar articles
-
Quantitative Multi-Parametric Magnetic Resonance Imaging of Tumor Response to Photodynamic Therapy.PLoS One. 2016 Nov 7;11(11):e0165759. doi: 10.1371/journal.pone.0165759. eCollection 2016. PLoS One. 2016. PMID: 27820832 Free PMC article.
-
Decline of Tumor Vascular Function as Assessed by Dynamic Contrast-Enhanced Magnetic Resonance Imaging Is Associated With Poor Responses to Radiation Therapy and Chemotherapy.Int J Radiat Oncol Biol Phys. 2016 Aug 1;95(5):1495-1503. doi: 10.1016/j.ijrobp.2016.03.051. Epub 2016 Apr 8. Int J Radiat Oncol Biol Phys. 2016. PMID: 27325478
-
Anti-angiogenic therapy affects the relationship between tumor vascular structure and function: A correlation study between micro-computed tomography angiography and dynamic contrast enhanced MRI.Magn Reson Med. 2017 Oct;78(4):1513-1522. doi: 10.1002/mrm.26547. Epub 2016 Nov 25. Magn Reson Med. 2017. PMID: 27888545
-
The effect of photodynamic therapy on tumor angiogenesis.Cell Mol Life Sci. 2009 Jul;66(14):2275-83. doi: 10.1007/s00018-009-0016-4. Epub 2009 Mar 31. Cell Mol Life Sci. 2009. PMID: 19333552 Free PMC article. Review.
-
DCE-MRI of Tumor Hypoxia and Hypoxia-Associated Aggressiveness.Cancers (Basel). 2020 Jul 20;12(7):1979. doi: 10.3390/cancers12071979. Cancers (Basel). 2020. PMID: 32698525 Free PMC article. Review.
Cited by
-
Fast magnetic resonance fingerprinting for dynamic contrast-enhanced studies in mice.Magn Reson Med. 2018 Dec;80(6):2681-2690. doi: 10.1002/mrm.27345. Epub 2018 May 9. Magn Reson Med. 2018. PMID: 29744935 Free PMC article.
-
Acute cellular and vascular responses to photodynamic therapy using EGFR-targeted nanobody-photosensitizer conjugates studied with intravital optical imaging and magnetic resonance imaging.Theranostics. 2020 Jan 20;10(5):2436-2452. doi: 10.7150/thno.37949. eCollection 2020. Theranostics. 2020. PMID: 32089747 Free PMC article.
-
Noninvasive assessment and therapeutic monitoring of drug-resistant colorectal cancer by MR molecular imaging of extradomain-B fibronectin.Theranostics. 2020 Sep 8;10(24):11127-11143. doi: 10.7150/thno.47448. eCollection 2020. Theranostics. 2020. PMID: 33042274 Free PMC article.
-
Dual inhibition of PFKFB3 and VEGF normalizes tumor vasculature, reduces lactate production, and improves chemotherapy in glioblastoma: insights from protein expression profiling and MRI.Theranostics. 2020 Jun 5;10(16):7245-7259. doi: 10.7150/thno.44427. eCollection 2020. Theranostics. 2020. PMID: 32641990 Free PMC article.
-
Aptamer-functionalized nanoscale metal-organic frameworks for targeted photodynamic therapy.Theranostics. 2018 Jul 30;8(16):4332-4344. doi: 10.7150/thno.26768. eCollection 2018. Theranostics. 2018. PMID: 30214624 Free PMC article.
References
-
- Dougherty TJ, Grindey GB, Riel R, Weishaupt KR, Boyle DG. Photoradiation therapy II - Cure of animal tumors with hematoporphyrin and light. J Natl Cancer Insitute. 1975;55(1):115–21. - PubMed
-
- Fingar VH. Vascular effects of photodynamic therapy. J Clin Laser Med Surg. 1996 Oct;14(5):323–328. - PubMed
-
- Trachtenberg J, Weersink RA, Davidson SRH, Haider MA, Bogaards A, Gertner MR. et al. Vascular-targeted photodynamic therapy (padoporfin, WST09) for recurrent prostate cancer after failure of external beam radiotherapy: A study of escalating light doses. BJU Int. 2008;102(5):556–62. - PubMed
-
- Azzouzi A-R, Barret E, Moore CM, Villers A, Allen C, Scherz A. et al. TOOKAD ® Soluble vascular-targeted photodynamic (VTP) therapy: determination of optimal treatment conditions and assessment of effects in patients with localised prostate cancer. BJU Int. 2013;112(6):766–74. - PubMed
MeSH terms
LinkOut - more resources
Full Text Sources
Other Literature Sources
Research Materials
Miscellaneous
