. 2017 Oct 17;7(19):4671-4688.
doi: 10.7150/thno.21216. eCollection 2017.

Follicular Stimulating Hormone Accelerates Atherogenesis by Increasing Endothelial VCAM-1 Expression

Affiliations

Follicular Stimulating Hormone Accelerates Atherogenesis by Increasing Endothelial VCAM-1 Expression

Xiaosa Li et al. Theranostics. .

Abstract

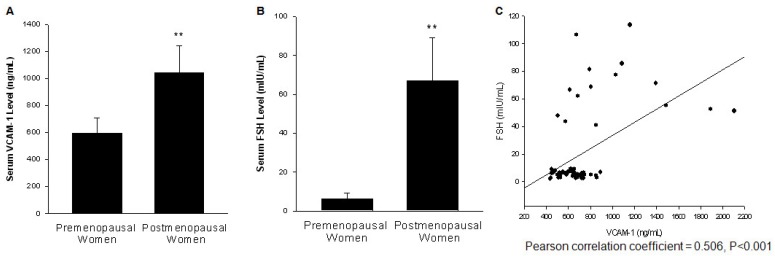
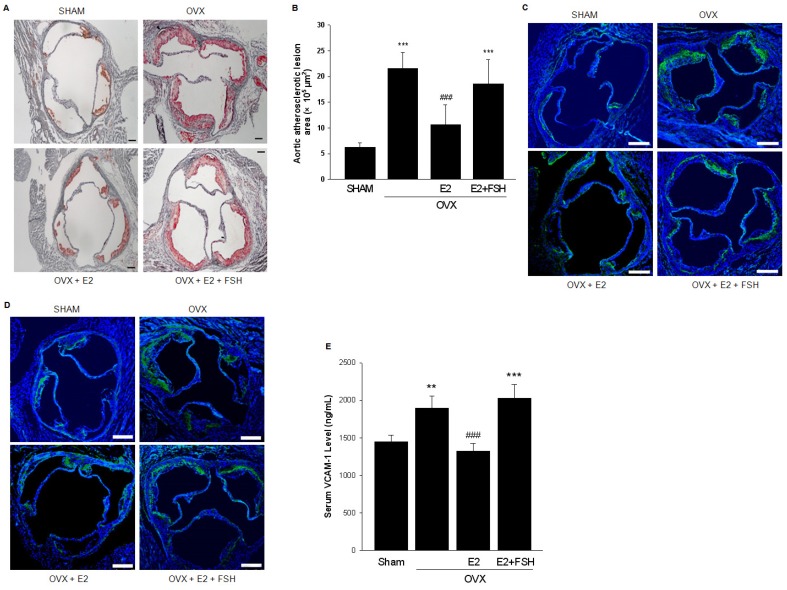
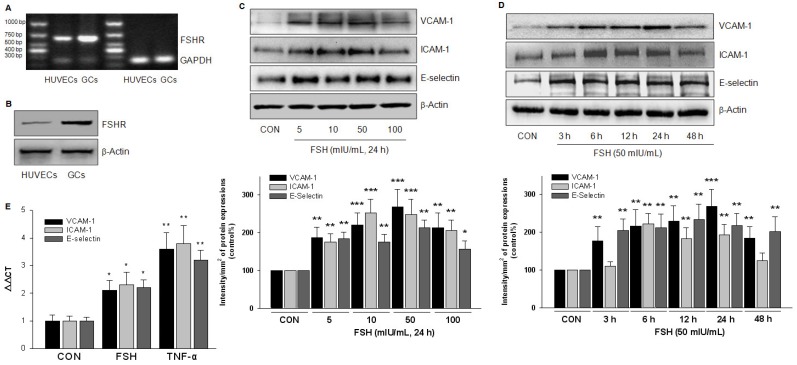
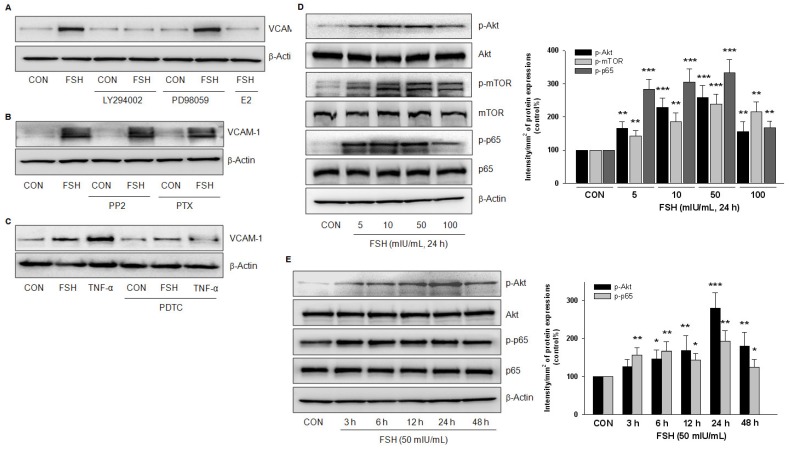
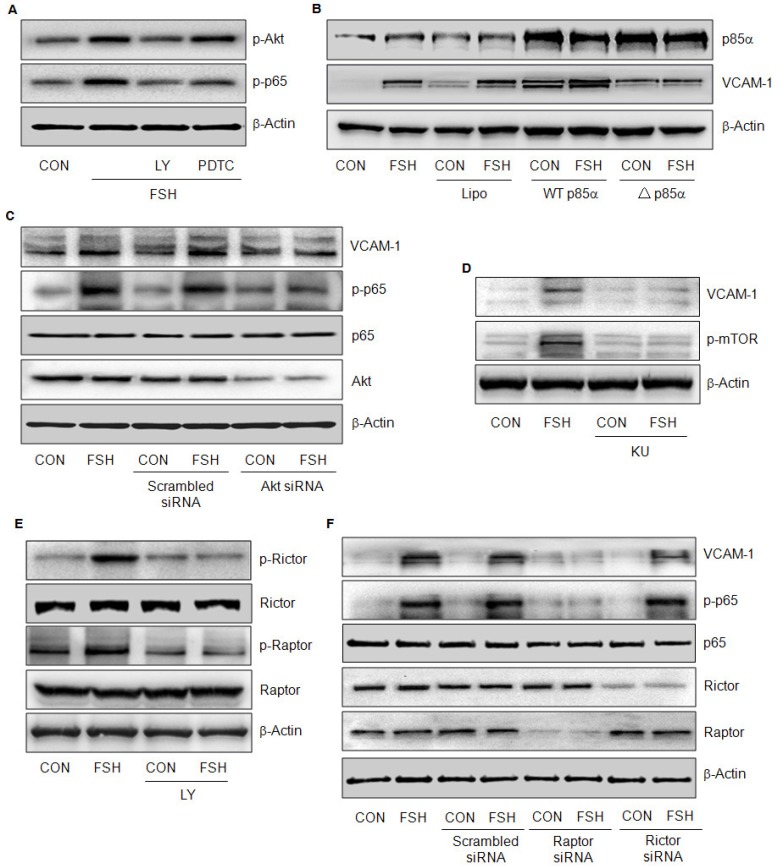
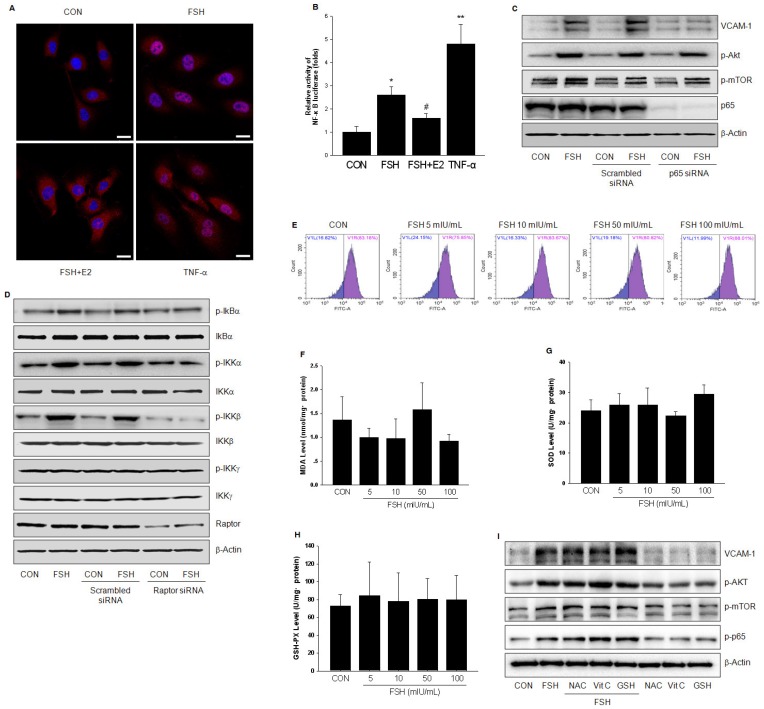
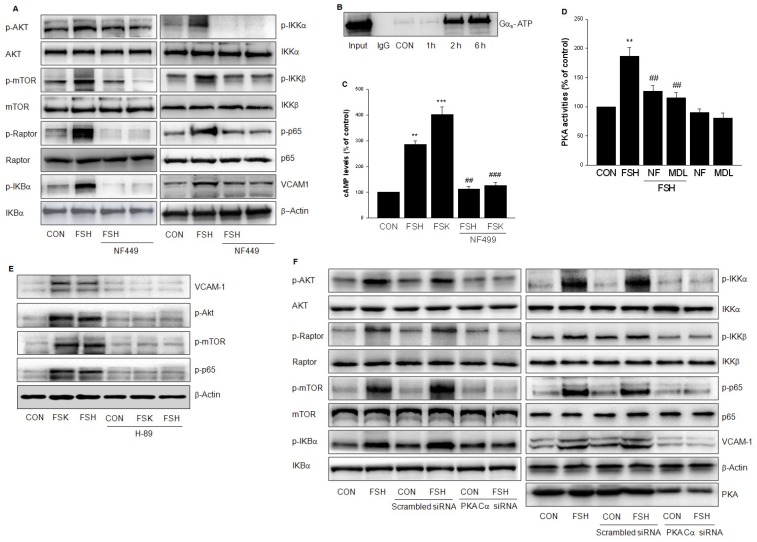
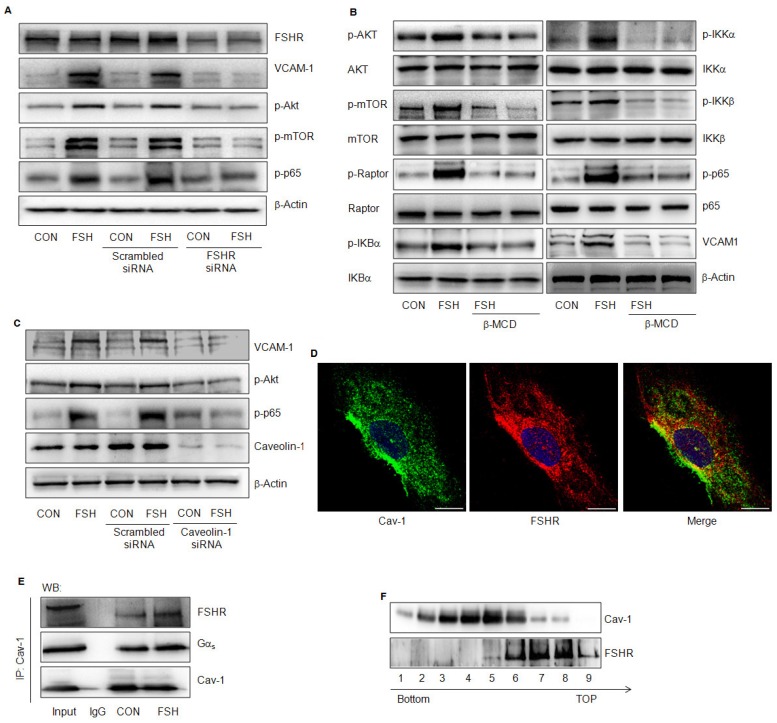
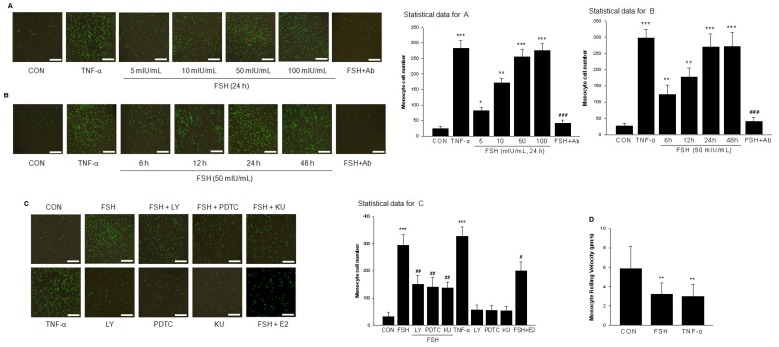
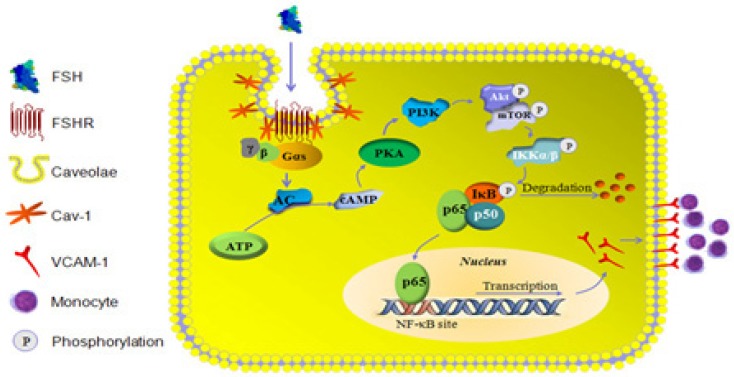
Rationale: Postmenopausal atherosclerosis (AS) has for decades been attributed to estrogen deficiency. Although the follicular stimulating hormone (FSH) levels rise sharply in parallel, the direct effect of FSH on AS has never been investigated. In this study, we explored the possible role of FSH in the development of AS. Methods: This was a prospective cohort study of 48 healthy premenopausal and 15 postmenopausal women. ApoE knockout mice were used as atherosclerosis model and human umbilical vascular endothelial cells (HUVECs) were cultured as cell model. Serum hormones and vascular cell adhesion molecule-1 (VCAM-1) levels were measured. Real-time PCR, histology for atherosclerotic lesions, immunofluorescence, luciferase assay, transfection experiments, flow chamber adhesion assay and western blot were performed. Results: In ApoE knockout mice, administration of FSH increased the atherosclerotic lesions and serum VCAM-1 concentration. Importantly, in blood samples of postmenopausal women, we detected significantly higher levels of FSH and VCAM-1 compared with those from premenopausal women, and there was a positive correlation between these two molecules. In cultured HUVECs, FSH receptor (FSHR) mRNA and protein expression were detected and FSH enhanced VCAM-1 expression. This effect was mediated by the activation of nuclear factor κB (NF-κB), which was sequentially enhanced by the activation of PI3K/Akt/mTOR cascade. FSH first enhanced GαS activity resulting in elevated cAMP level and PKA activity, which relayed the signals from FSHR to the PI3K/Akt/mTOR cascade. Furthermore, FSHR was detected in endothelial caveolae fraction and interacted with caveolin-1 and GαS. The disruption of caveolae or the silencing of caveolin-1 blocked FSH effects on signaling activation and VCAM-1 expression, suggesting the existence of a functional signaling module in membrane caveolae. Finally, FSH increased human monocyte adhesion to HUVECs which was reversed by the VCAM-1 neutralizing antibody. Conclusion: FSHR was located in the membrane caveolae of HUVECs and FSH promoted VCAM-1 expression via FSHR/GαS /cAMP/PKA and PI3K/Akt/mTOR/NF-κB pathway. This may contribute to the deleterious role of FSH in the development of AS in postmenopausal women.

Keywords: Atherosclerosis; Caveolae.; Follicular Stimulating Hormone; Vascular Cell Adhesion Molecule-1; Vascular Endothelial Cells.


Conflict of interest statement

Competing Interests: The authors have declared that no competing interest exists.

Figures

Figure 1
Figure 1
The serum level of FSH was positively associated with serum VCAM-1 level. (A). Serum VCAM-1 from 48 premenopausal women at follicular phase and 15 postmenopausal women were assessed by ELISA. ** = P<0.01 vs. premenopausal women group. (B). Serum FSH levels from these samples were determined by immunoassay. ** = P<0.01 vs. premenopausal women group. (C). Scatter diagram shows the association between the serum FSH and VCAM-1 levels.
Figure 2
Figure 2
FSH promoted aortic atherosclerotic lesion formation. (A). Oil-red O-stained aortic root lesion in ApoE-/- mice with different treatments as indicated. Scale bar = 100 μm. (B). Statistical analysis of the size of atherosclerotic plaque in the aortic root. One-way ANOVA analysis was used. n=6-9, *** = P < 0.001 vs. SHAM group; ### = P < 0.001 vs. OVX or OVX+E2+FSH group. (C-D). Immunofluorescent staining of frozen sections of aorta sinus was performed with VCAM-1 antibody (green) (C) or Specific marker antibodies for macrophages (anti-CD68) (green) (D). Nuclei were counterstained with and DAPI (blue). Scale bar = 250 μm. All experiments were repeated at least six times with consistent results and the representative images are shown. (E). Serum VCAM-1 from ApoE-/- mice with different treatments were detected by ELISA. n=6-9, ** = P<0.01, *** = P < 0.001 vs. SHAM group; ### = P<0.001 vs. OVX or OVX+E2+FSH group.
Figure 3
Figure 3
FSHR was expressed in HUVECs and FSH upregulated expression of adhesive molecules. (A). FSHR mRNA fragment was assessed by RT-PCR in HUVECs and in the positive control, the human granulosa cells (GCs). (B). FSHR protein expression was detected by Western blotting. (C-D). HUVECs were treated with different concentration of FSH for 24 h (C), or treated with FSH (50 mIU/mL) for different time as indicated (D). VCAM-1, ICAM-1 and E-selectin protein expressions were detected. * = P<0.05, ** = P<0.01, *** = P < 0.001 vs. corresponding control. All experiments were repeated at least three times with consistent results, and the representative images are shown. (E). HUVECs were treated with control vehicle (CON), FSH (50 mIU/mL) or the positive control TNF-α (0.1 ng/mL) for 24 h. VCAM-1, ICAM-1 and E-selectin mRNA were assessed by Quantitative Real-time PCR. n=5, * = P < 0.05, ** = P < 0.01 vs. corresponding control.
Figure 4
Figure 4
PI3K/Akt and NF-κB signaling were implicated in FSH-enhanced VCAM-1 expression. (A-C). HUVECs were treated with control vehicle (CON) or FSH (50 mIU/mL) for 24 h in the presence or absence of PI3K inhibitor LY294002 (5 μM), ERK1/2 inhibitor PD98059 (2.5 μM), 17β-estradiol (E2, 10 nM), c-Src inhibitor PP2 (5 μM), Gαi protein inhibitor PTX (50 ng/mL), NF-κB inhibitor PDTC (10 μM). VCAM-1 was detected by Western blotting. β-actin was used as an internal control. (D-E). HUVECs were treated with different concentrations of FSH for 24 h, or treated with 50 mIU/mL of FSH over 48 h. Total Akt, phosphorylated Akt (p-Akt), total mTOR, phosphorylated mTOR (p-mTOR), total p65, phosphorylated p65 (p-p65) and β-actin were detected by Western blotting. * = P<0.05, ** = P<0.01, *** = P < 0.001 vs. corresponding control. All experiments were repeated at least three times with consistent results, and the representative images are shown.
Figure 5
Figure 5
PI3K/Akt/mTORC1 pathway was upstream of NF-κB signaling. (A). HUVECs were treated with control vehicle (CON) or FSH (50 mIU/mL) for 24 h in the presence or absence of PI3K inhibitor LY294002 (5 μM) and NF-κB inhibitor PDTC (10 μM). Phosphorylated Akt (p-Akt), phosphorylated p65 (p-p65) and β-actin were detected by Western blotting. (B). HUVECs were transiently transfected with constitutively active p85α (WT p85α) or dominant-negative p85α (△p85α) plasmid (both 15 μg) for 48 h. Next, cells were treated with vehicle or FSH (50 mIU/mL) for another 24 h. Cell contents of p85α, VCAM-1 and β-actin were detected by Western blotting. (C). HUVECs were transfected with scrambled siRNA (100 nM) or Akt siRNA (100 nM) for 48 h followed by treatment with vehicle or FSH (50 mIU/mL) for another 24 h. Western blot of proteins is shown. (D). HUVECs were treated with vehicle or 50 mIU/mL FSH for 24 h in the presence or absence of mTOR inhibitor KU 0063794 (KU, 1 μM). Western blot of proteins is shown. (E). HUVECs were treated with control vehicle (CON) or FSH (50 mIU/mL) for 24 h in the presence or absence of PI3K inhibitor LY294002 (5 μM). Total rictor or raptor, phosphorylated rictor (p-rictor) or phosphorylated raptor (p-raptor) and β-actin were detected by Western blotting. (F). HUVECs were transfected with scrambled siRNA, raptor siRNA or rictor siRNA (all 100 nM) for 48 h. Cells were then treated with vehicle or FSH (50 mIU/mL) for another 24 h and the proteins were detected by Western blotting.
Figure 6
Figure 6
FSH activated NF-κB signaling through IKK/IkBα pathway. (A). HUVECs were treated with control vehicle (CON), FSH (50 mIU/mL) or TNF-α (0.1 ng/mL) for 24 h in the presence or absence of 17β-estradiol (E2, 10 nM). Subcellular localization of the p65 protein was assayed by immunofluorescence (red staining). Scale bar = 250 μm. (B). HUVECs were transiently transfected with 750 ng of NF-κB-luciferase reporter and 250 ng pRL-TK vector expressing renella luciferase. Subsequently, cells were treated with control vehicle (CON), FSH (50 mIU/mL) or TNF-α (0.1 ng/mL) for 24 h in the presence or absence of 17β-estradiol (E2, 10 nM). Relative luminescent units (RLU) were examined and were normalized to fold change from control. * = P < 0.05, ** = P<0.01 vs. control; # = P<0.05 vs. FSH. (C-D). HUVECs were transfected with scrambled siRNA (100 nM), p65 siRNA (100 nM) (C) or raptor siRNA (100 nM) (D) for 48 h. Cells were then treated with vehicle or FSH (50 mIU/mL) for another 24 h and analyzed by Western blotting. (E). HUVECs were treated with control vehicle (CON) or different concentrations of FSH for 24 h. Then cells were washed and loaded with H2DCFDA and subjected to fluorescence measurement by flow cytometry. V1R gate (right gate) showed the percentage of positive cells loaded with probe. No significance was found between these groups. (F-H). HUVECs were treated as indicated for 24 h and the levels of MDA, SOD, GSH-PX were measured. No significance was found between these groups. (I). HUVECs were treated with control vehicle (CON) or FSH (50 mIU/mL) for 24 h, in the presence or absence of antioxidants (including N-Acetyl-L-cysteine (NAC, 1 mM), Vitamin C (Vit C, 200 μM) and glutathione (GSH, 1 mM)). Proteins were analyzed by Western blotting. All experiments were repeated at least three times with consistent results and the representative images are shown.
Figure 7
Figure 7
FSHR coupled to GαS /AC/cAMP/PKA cascade to activate PI3K/Akt/mTOR. (A). HUVECs were treated with vehicle or FSH (50 mIU/mL) for 24 h in the presence or absence of GαS antagonist NF499 (10 μM) and analyzed by Western blotting. (B). HUVECs were treated with FSH (50 mIU/mL) for over 6 h. Cell lysates were subjected to immunoprecipitation using anti-active GαS monoclonal antibody. Immunoprecipitates were analyzed by Western blotting with anti- GαS antibody. (C). HUVECs were treated with vehicle, FSH, or adenylyl cyclase activator Forskolin (FSK, 10 μM) in the presence or absence of GαS antagonist NF499. cAMP concentration was determined by ELISA. ** = P < 0.01, *** = P < 0.001 vs. control; ## = P<0.01, ### = P<0.001 vs. FSH or FSK. (D). HUVECs were treated with vehicle or FSH in the presence or absence of NF499 or adenylate cyclase inhibitor MDL12330A (MDL, 10 μM). PKA activity was determined by ELISA. ** = P < 0.01 vs. control; ## = P<0.01 vs. FSH. (E). Western blots of HUVECs treated with vehicle, FSH or FSK in the presence or absence of PKA inhibitor H89 (10 μM) pretreatment. (F). HUVECs were transfected with scrambled siRNA (100 nM) or PKA Cα siRNA (100 nM) for 48 h. Then cells were treated with vehicle or FSH (50 mIU/mL) for another 24 h and analyzed by Western blotting. All experiments were repeated at least three times with consistent results and the representative images are shown.
Figure 8
Figure 8
FSHR was located in caveolae and its effects were caveolin-1-dependent. (A). HUVECs were transfected with scrambled siRNA (100 nM) or FSHR siRNA (100 nM) for 48 h, treated with vehicle or FSH (50 mIU/mL) for another 24 h and analyzed by Western blotting. (B). HUVECs were treated with vehicle or FSH for 24 h in presence or absence of lipid raft disruptor Methyl-β-cyclodextrin (β-MCD, 0.1 mM) and analyzed by Western blotting. (C). HUVECs were transfected with scrambled siRNA (100 nM) or caveolin-1 siRNA (100 nM) for 48 h, treated with vehicle or FSH (50 mIU/mL) for another 24 h and analyzed by Western blotting. (D). Subcellular colocalization of the Cav-1 and FSHR proteins was determined with laser scanning confocal microscopy. Cav-1 (green staining), FSHR (red staining), DAPI-stained nuclei (blue staining). Merged image (yellow staining) is shown. Scale bar = 50 μm. (E). HUVECs were treated with vehicle or FSH for 24 h. Cells were then lysed and cell lysates were subjected to immunoprecipitation using anti-caveolin-1 antibody. Immunoprecipitates were analyzed by Western blotting with anti- GαS and anti-FSHR antibodies. (F). Cell fractionation was performed by OptiPrep density gradient centrifugation as described. Distribution of FSHR in Cav-1-enriched caveolae membrane domain fractions was detected by Western blotting. Representative immunoblotting of cell fractionation from the tubes top fraction 1 to the bottom fraction 9 are shown. All experiments were performed in triplicates and representative images are shown.
Figure 9
Figure 9
FSH promoted monocyte adhesion to vascular endothelial cells. (A). Representative images of monocyte cell adhesion to HUVECs after treatment with positive control TNF-α (0.1 ng/mL) for 24 h, or with different concentrations of FSH for 24 h in the presence or absence of VCAM-1 neutralizing antibody (Ab). Total cell number of monocyte cell adhesion to HUVECs was observed and calculated by fluorescence microscopy. n=5, * = P < 0.05, ** = P < 0.01, *** = P < 0.001 vs. control; ### = P<0.001 vs. FSH at 50 mIU/mL. Scale bar = 500 μm. (B). Representative images of monocyte cell adhesion to HUVECs after various treatments as indicated. n=5, ** = P < 0.01, *** = P < 0.001 vs. control; ### = P<0.001 vs. FSH treatment for 24 h. (C). HUVECs were treated with FSH (50 mIU/mL) or treated with TNF-α as positive control for 24 h in the presence or absence of PI3K inhibitor LY294002 (LY, 5 μM), NF-κB inhibitor PDTC (10 μM), or mTOR inhibitor KU (1 μM). n=5, *** = P < 0.001 vs. control; # = P<0.05, ## = P<0.01 vs. FSH. (D). The rolling velocity of monocytes adhered to HUVECs were calculated. n= 10-20, ** = P < 0.01 vs. control.
Figure 10
Figure 10
Schema illustration of the signalling involved in FSH-induced signalling activation and VCAM-1 expression.

Similar articles

Cited by

References

    1. Mozaffarian D, Benjamin EJ, Go AS, Arnett DK, Blaha MJ, Cushman M. et al. Heart Disease and Stroke Statistics-2016 Update: A Report From the American Heart Association. Circulation. 2016;133:e38–360. - PubMed
    1. Mendelsohn ME, Karas RH. The protective effects of estrogen on the cardiovascular system. N Engl J Med. 1999;340:1801–11. - PubMed
    1. Harman SM. Menopausal hormone treatment cardiovascular disease: another look at an unresolved conundrum. Fertil Steril. 2014;101:887–97. - PubMed
    1. Genazzani AR, Simoncini T. Pharmacotherapy: Benefits of menopausal hormone therapy-timing is key. Nat Rev Endocrinol. 2013;9:5–6. - PubMed
    1. Randolph JF Jr, Sowers M, Bondarenko IV, Harlow SD, Luborsky JL, Little RJ. Change in estradiol and follicle-stimulating hormone across the early menopausal transition: effects of ethnicity and age. J Clin Endocrinol Metab. 2004;89:1555–61. - PubMed

MeSH terms