

Optimizing fresh specimen staining for rapid identification of tumor biomarkers during surgery
- PMID: 29187899
- PMCID: PMC5706095
- DOI: 10.7150/thno.21527
Optimizing fresh specimen staining for rapid identification of tumor biomarkers during surgery
Abstract
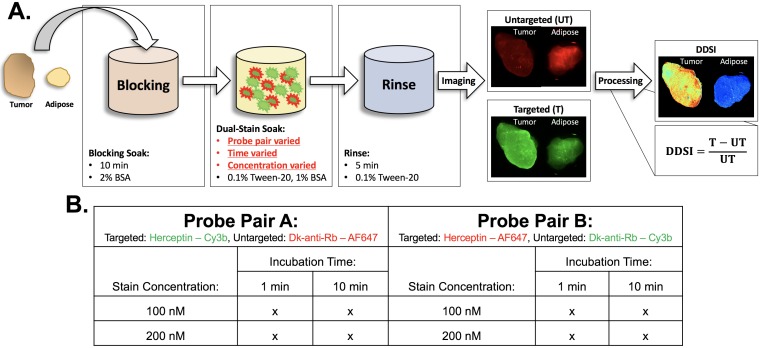
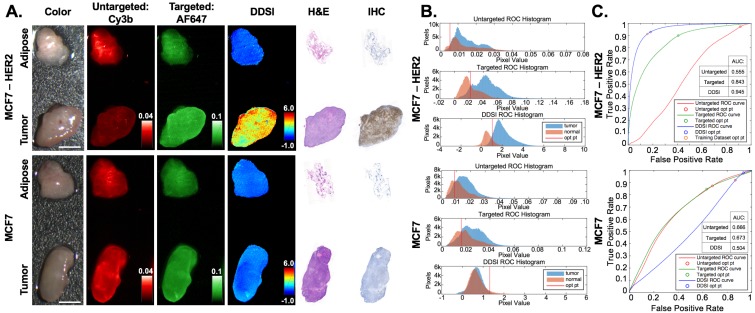
Rationale: Positive margin status due to incomplete removal of tumor tissue during breast conserving surgery (BCS) is a prevalent diagnosis usually requiring a second surgical procedure. These follow-up procedures increase the risk of morbidity and delay the use of adjuvant therapy; thus, significant efforts are underway to develop new intraoperative strategies for margin assessment to eliminate re-excision procedures. One strategy under development uses topical application of dual probe staining and a fluorescence imaging strategy termed dual probe difference specimen imaging (DDSI). DDSI uses a receptor-targeted fluorescent probe and an untargeted, spectrally-distinct fluorescent companion imaging agent topically applied to fresh resected specimens, where the fluorescence from each probe is imaged and a normalized difference image is computed to identify tumor-target distribution in the specimen margins. While previous reports suggested this approach is a promising new tool for surgical guidance, advancing the approach into the clinic requires methodical protocol optimization and further validation.
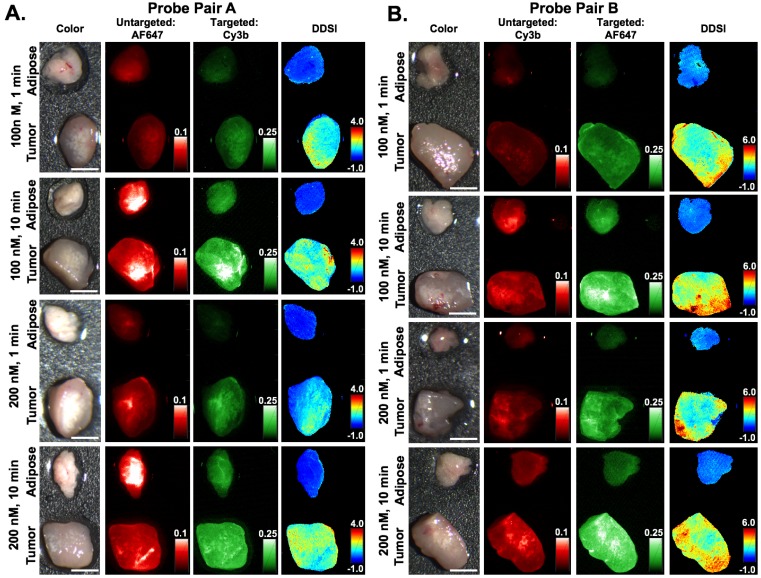
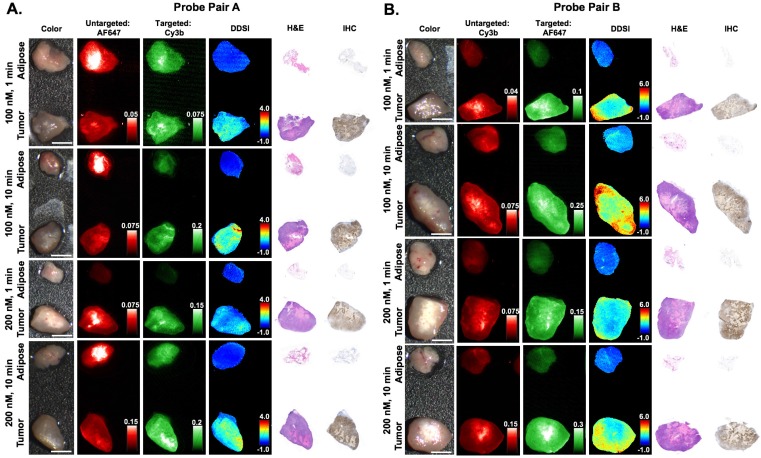
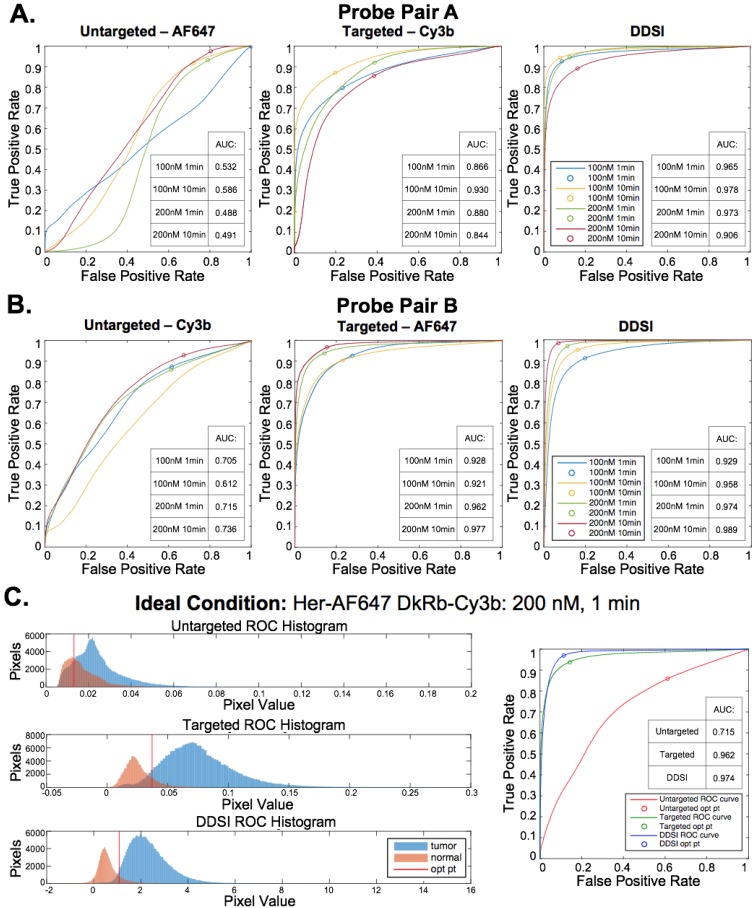
Methods: In the present study, we used breast cancer xenografts and receiver operator characteristic (ROC) curve analysis to evaluate a wide range of staining and imaging parameters, and completed a prospective validation study on multiple tumor phenotypes with different target expression. Imaging fluorophore-probe pair, concentration, and incubation times were systematically optimized using n=6 tissue specimen replicates per staining condition. Resulting tumor vs. normal adipose tissue diagnostic performance were reported and staining patterns were validated via receptor specific immunohistochemistry colocalization. Optimal staining conditions were tested in receptor positive and receptor negative cohorts to confirm specificity.
Results: The optimal staining conditions were found to be a one minute stain in a 200 nM probe solution (area under the curve (AUC) = 0.97), where the choice of fluorescent label combination did not significantly affect the diagnostic performance. Using an optimal threshold value determined from ROC curve analysis on a training data set, a prospective study on xenografts resulted in an AUC=0.95 for receptor positive tumors and an AUC = 0.50 for receptor negative (control) tumors, confirming the diagnostic performance of this novel imaging technique.
Conclusions: DDSI provides a robust, molecularly specific imaging methodology for identifying tumor tissue over benign mammary adipose tissue. Using a dual probe imaging strategy, nonspecific accumulation of targeted probe was corrected for and tumor vs. normal tissue diagnostic potential was improved, circumventing difficulties with ex vivo tissue specimen staining and allowing for rapid clinical translation of this promising technology for tumor margin detection during BCS procedures.
Keywords: breast cancer; breast conserving surgery; dual probe difference specimen imaging; dual probe imaging; fluorescence; image-guided surgery; tumor margin assessment.
Conflict of interest statement
Competing Interests: The authors have declared that no competing interest exists.
Figures
Similar articles
-
Diagnostic performance of receptor-specific surgical specimen staining correlates with receptor expression level.J Biomed Opt. 2019 Feb;24(2):1-9. doi: 10.1117/1.JBO.24.2.026002. J Biomed Opt. 2019. PMID: 30737910 Free PMC article.
-
Topical dual-probe staining using quantum dot-labeled antibodies for identifying tumor biomarkers in fresh specimens.PLoS One. 2020 Mar 11;15(3):e0230267. doi: 10.1371/journal.pone.0230267. eCollection 2020. PLoS One. 2020. PMID: 32160634 Free PMC article.
-
Evaluating Receptor-Specific Fresh Specimen Staining for Tumor Margin Detection in Clinical Breast Specimens.Mol Imaging Biol. 2023 Oct;25(5):911-922. doi: 10.1007/s11307-022-01771-9. Epub 2023 Jun 23. Mol Imaging Biol. 2023. PMID: 37351769 Free PMC article.
-
Close/positive margins after breast-conserving therapy: additional resection or no resection?Breast. 2013 Aug;22 Suppl 2:S115-7. doi: 10.1016/j.breast.2013.07.022. Breast. 2013. PMID: 24074771 Review.
-
Review of methods for intraoperative margin detection for breast conserving surgery.J Biomed Opt. 2018 Oct;23(10):1-19. doi: 10.1117/1.JBO.23.10.100901. J Biomed Opt. 2018. PMID: 30369108 Free PMC article. Review.
Cited by
-
TRIPODD: a Novel Fluorescence Imaging Platform for In Situ Quantification of Drug Distribution and Therapeutic Response.Mol Imaging Biol. 2021 Oct;23(5):650-664. doi: 10.1007/s11307-021-01589-x. Epub 2021 Mar 9. Mol Imaging Biol. 2021. PMID: 33751366
-
Effect of staining temperature on topical dual stain imaging of tissue specimens for tumor identification.Proc SPIE Int Soc Opt Eng. 2019 Feb;10862:108620L. doi: 10.1117/12.2509848. Epub 2019 Mar 7. Proc SPIE Int Soc Opt Eng. 2019. PMID: 31929674 Free PMC article.
-
Diagnostic performance of receptor-specific surgical specimen staining correlates with receptor expression level.J Biomed Opt. 2019 Feb;24(2):1-9. doi: 10.1117/1.JBO.24.2.026002. J Biomed Opt. 2019. PMID: 30737910 Free PMC article.
-
Assessing the efficacy of intraoperative fluorescence imaging for tumor margin identification in breast conserving surgery.Bioinformation. 2024 Dec 31;20(12):1927-1930. doi: 10.6026/9732063002001927. eCollection 2024. Bioinformation. 2024. PMID: 40230928 Free PMC article.
-
Topical dual-probe staining using quantum dot-labeled antibodies for identifying tumor biomarkers in fresh specimens.PLoS One. 2020 Mar 11;15(3):e0230267. doi: 10.1371/journal.pone.0230267. eCollection 2020. PLoS One. 2020. PMID: 32160634 Free PMC article.
References
-
- Miller KD, Siegel RL, Lin CC, Mariotto AB, Kramer JL, Rowland JH. et al. Cancer treatment and survivorship statistics, 2016. CA: a cancer journal for clinicians. 2016;66:271–89. - PubMed
-
- Waljee JF, Hu ES, Newman LA, Alderman AK. Predictors of re-excision among women undergoing breast-conserving surgery for cancer. Annals of surgical oncology. 2008;15:1297–303. - PubMed
-
- Wilke LG, Czechura T, Wang C, Lapin B, Liederbach E, Winchester DP. et al. Repeat surgery after breast conservation for the treatment of stage 0 to II breast carcinoma: a report from the National Cancer Data Base, 2004-2010. JAMA Surg. 2014;149:1296–305. - PubMed
Publication types
MeSH terms
Substances
Grants and funding
LinkOut - more resources
Full Text Sources
Other Literature Sources
