. 2017 Oct 18;7(22):9750-9762.
doi: 10.1002/ece3.3503. eCollection 2017 Nov.

Radiation of the polymorphic Little Devil poison frog (Oophaga sylvatica) in Ecuador

Affiliations

Radiation of the polymorphic Little Devil poison frog (Oophaga sylvatica) in Ecuador

Alexandre B Roland et al. Ecol Evol. .

Abstract

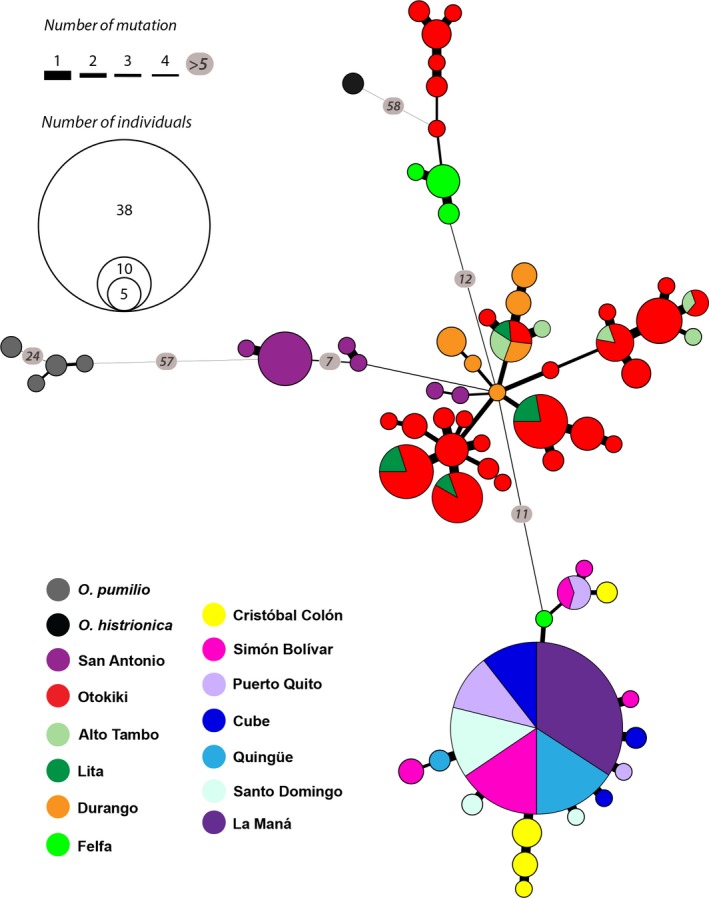
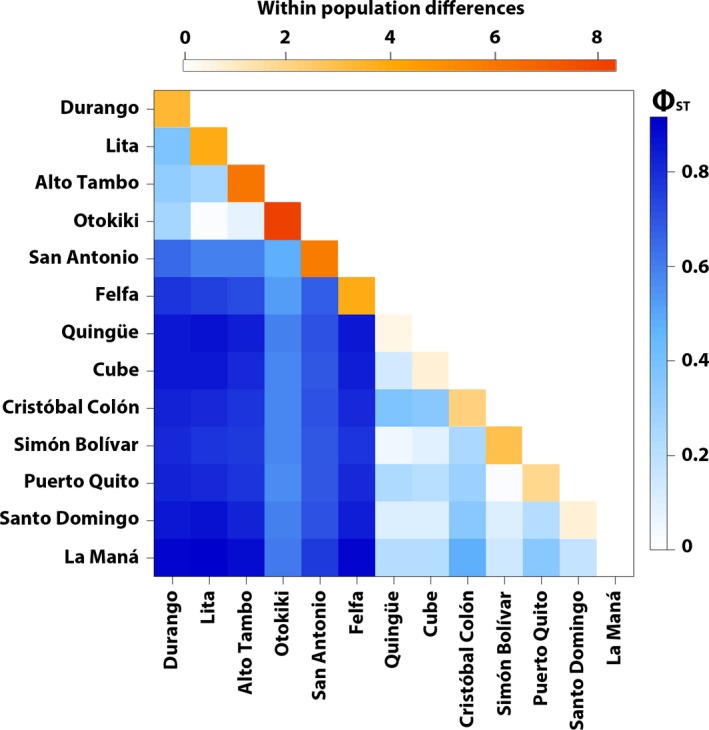
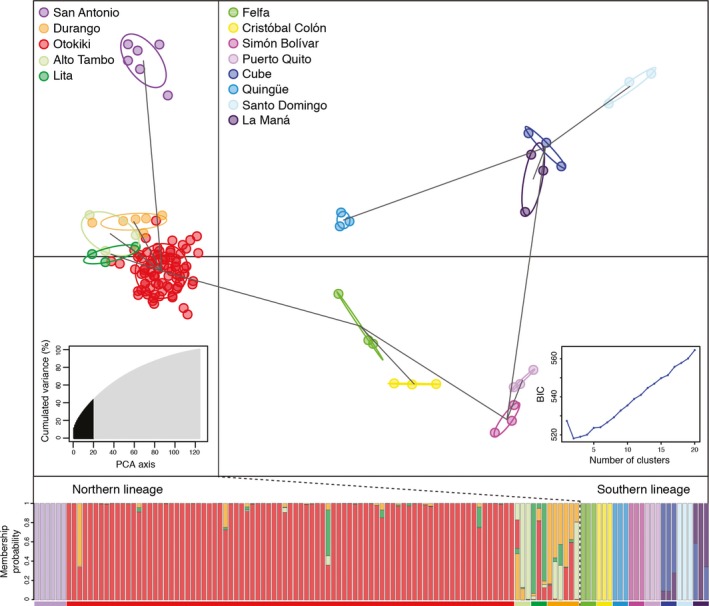
Some South American poison frogs (Dendrobatidae) are chemically defended and use bright aposematic colors to warn potential predators of their unpalatability. Aposematic signals are often frequency-dependent where individuals deviating from a local model are at a higher risk of predation. However, extreme diversity in the aposematic signal has been documented in poison frogs, especially in Oophaga. Here, we explore the phylogeographic pattern among color-divergent populations of the Little Devil poison frog Oophaga sylvatica by analyzing population structure and genetic differentiation to evaluate which processes could account for color diversity within and among populations. With a combination of PCR amplicons (three mitochondrial and three nuclear markers) and genome-wide markers from a double-digested RAD (ddRAD) approach, we characterized the phylogenetic and genetic structure of 199 individuals from 13 populations (12 monomorphic and 1 polymorphic) across the O. sylvatica distribution. Individuals segregated into two main lineages by their northern or southern latitudinal distribution. A high level of genetic and phenotypic polymorphism within the northern lineage suggests ongoing gene flow. In contrast, low levels of genetic differentiation were detected among the southern lineage populations and support recent range expansions from populations in the northern lineage. We propose that a combination of climatic gradients and structured landscapes might be promoting gene flow and phylogenetic diversification. Alternatively, we cannot rule out that the observed phenotypic and genomic variations are the result of genetic drift on near or neutral alleles in a small number of genes.

Keywords: Dendrobatidae; Ecuador; Oophaga sylvatica; amphibian; aposematism; ddRAD; gene flow; phenotypic variation; population genomics.


Figures

Figure 1
Figure 1
(a) Oophaga sylvatica distribution in Ecuador and morphological diversity. Oophaga sylvatica were found in lowland and foothill rain forest (0 to 1,020 m above sea level) in northwestern Ecuador. Most frogs were phenotypically variable among geographical localities (populations), while relatively monomorphic within populations (Fig. S1). Color diversity is particularly dramatic, ranging from yellow to red to brown and greenish, and can be combined with either markings or spots of different colors. (b) A striking example of diversity within the population of Otokiki, located in the center of the northern range, with phenotypes similar to the surrounding monomorphic populations as well as intermediate phenotypes
Figure 2
Figure 2
Haplotype network of 66 unique haplotypes of concatenated mitochondrial genes (12S‐tRNAV al, 16S, CO1) of Oophaga sylvatica, O. histrionica, and O. pumilio (2,084 bp). Circles indicate haplotypes, with the area being proportional to the number of individuals sharing that haplotype. Colors refer to the geographic origin of the population, and the pie charts represent the percentage of each population sharing the same haplotype. Line thickness between haplotypes is proportional to the inferred mutational steps (or inferred intermediate haplotypes). Inferred numbers of mutational steps are shown inside circles along the line when greater than four steps
Figure 3
Figure 3
Heatmap representation of between and within‐population differentiation in Oophaga sylvatica for concatenated mitochondrial genes (12S‐tRNAV al, 16S, CO1). Below the diagonal are the pairwise ϕST values between populations ranging from low (white) to high (blues). The diagonal is within‐population pairwise difference values ranging from low (white) to high (orange)
Figure 4
Figure 4
Structure inferred for 13 populations of Oophaga sylvatica from ddRAD data. Bar plots show Bayesian assignment probabilities for 125 individual frogs as inferred by STRUCTURE for K = 3 clusters, each color depicting one of the putative clusters
Figure 5
Figure 5
DAPC scatterplot for ddRAD data. The scatterplot shows the first two principal components of the DAPC of data generated with 3,785 SNPs. Individuals are represented by dots, and groups (i.e., geographic populations) are color‐coded according to Figure 1 and depicted by 95% inertia ellipses, which represent graphical summaries of clouds of points. Lines between groups represent the minimum spanning tree based on the squared distances and show the actual proximities between populations within the entire space. Right inset shows the inference of the number of clusters using the Bayesian information criterion (BIC). The chosen number of clusters corresponds to the inflexion point of the BIC curve (K = 2). Left inset shows the number of PCA eigenvalues retained in black and how much they accounted for variance. The bottom graph represents the membership probability of each individual to one or more populations. Geographic populations (groups) are represented with the same colors as in the DAPC plot
Figure 6
Figure 6
Analysis of the spatial pattern of genetic variability among 13 populations of Oophaga sylvatica. The map shows the results of the sPCA represented by the lagged scores (~principal component [PC] scores). The inset shows the sPCA eigenvalues, and only the PC associated with the first positive eigenvalue was retained (depicted by the black bar)

References

    1. Arteaga, A. , Pyron, R. A. , Peñafiel, N. , Romero‐Barreto, P. , Culebras, J. , Bustamante, L. , … Guayasamin, J. M. (2016). Comparative phylogeography reveals cryptic diversity and repeated patterns of cladogenesis for amphibians and reptiles in northwestern Ecuador. PLoS ONE, 11, e0151746. - PMC - PubMed
    1. Bastian, M. , Heymann, S. , & Jacomy, M. (2009). Gephi: an open source software for exploring and manipulating networks. ICWSM, 8, 361–362.
    1. Benson, W. W. (1971). Evidence for the evolution of unpalatability through kin selection in the Heliconiinae (Lepidoptera). The American Naturalist, 105, 213.
    1. Brodie, E. D. I. (1993). Differential avoidance of coral snake banded patterns by free‐ranging avian predators in Costa Rica. Evolution, 47, 227–235. - PubMed
    1. Brown, J. , Twomey, E. , Amézquita, A. , de Souza, M. B. , Caldwell, J. P. , Lötters, S. , … Summers, K. (2011). A taxonomic revision of the Neotropical poison frog genus Ranitomeya (Amphibia: Dendrobatidae). Zootaxa, 120, 1–120.

LinkOut - more resources