. 2017 Oct 16;8(11):5013-5026.
doi: 10.1364/BOE.8.005013. eCollection 2017 Nov 1.

Active thermodynamic contrast imaging for label-free tumor detection in a murine xenograft tumor model

Affiliations

Active thermodynamic contrast imaging for label-free tumor detection in a murine xenograft tumor model

Gyungseok Oh et al. Biomed Opt Express. .

Abstract

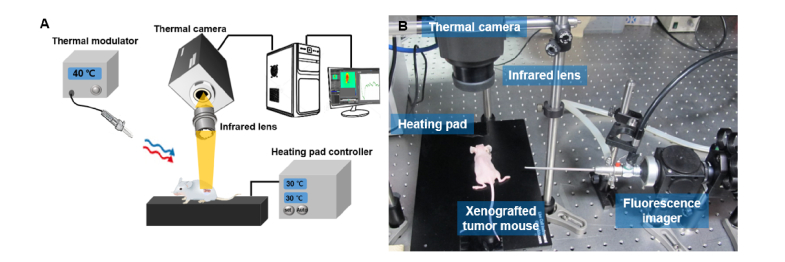
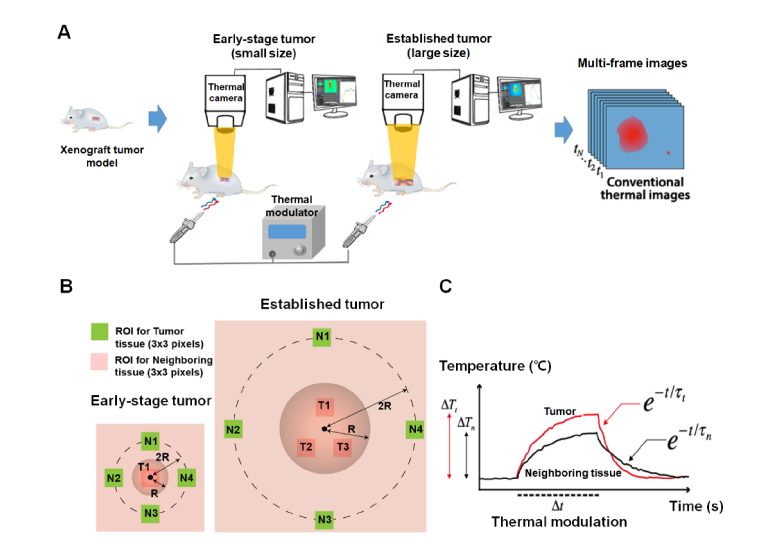
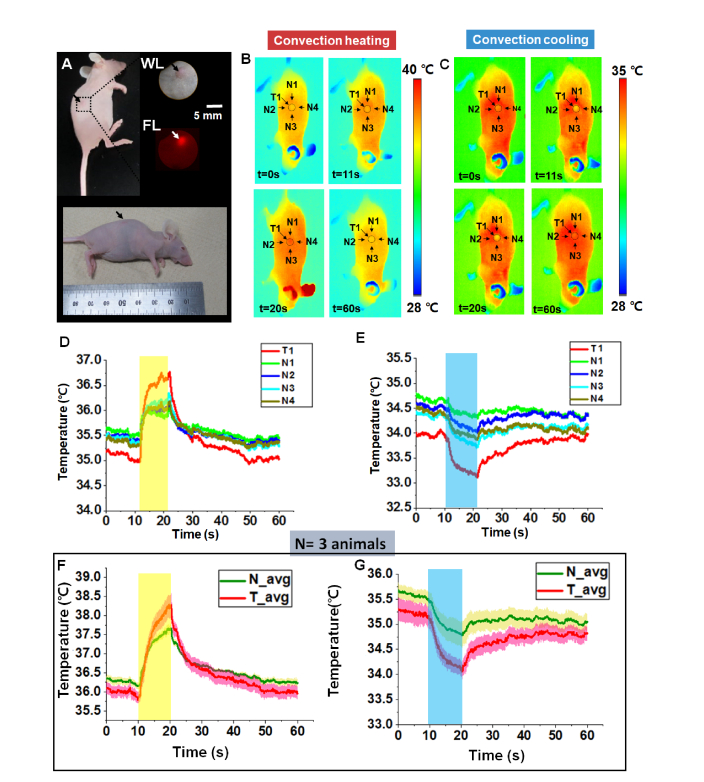
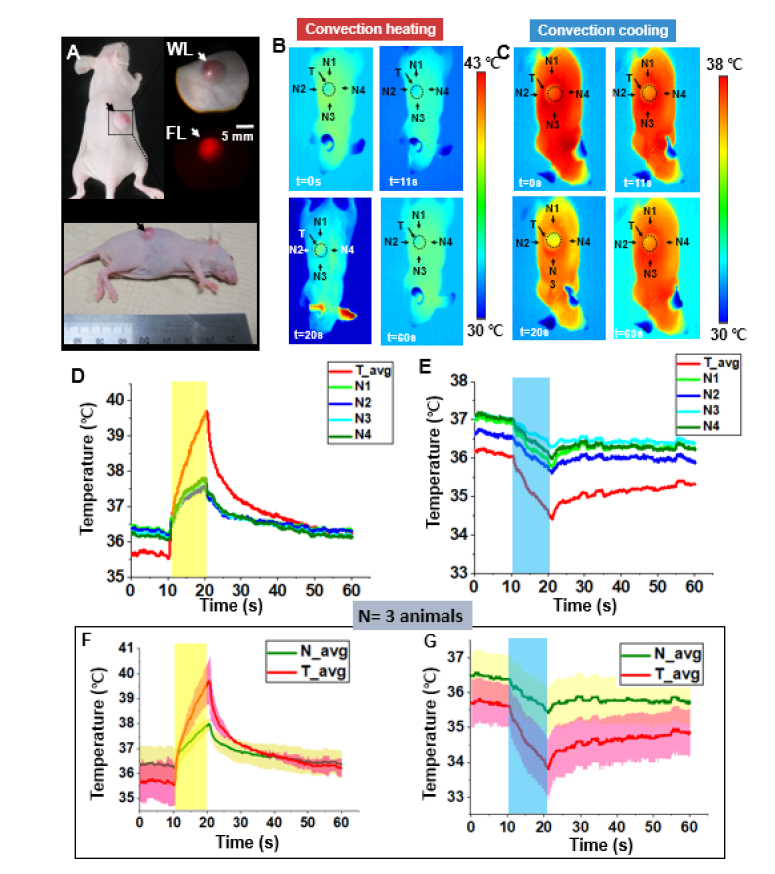
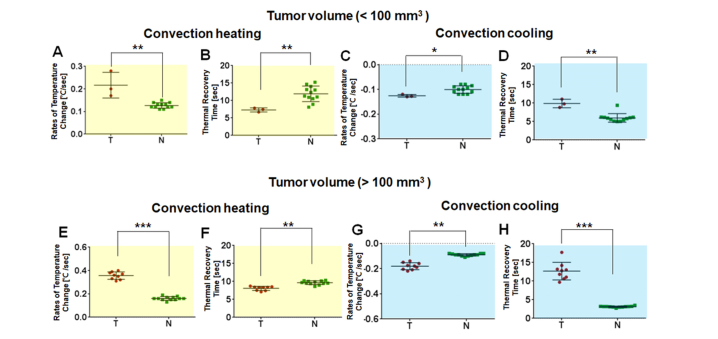
Passive thermal imaging provides a limited differentiation between a tumor and neighboring tissue based on the temperature difference. We propose active thermodynamic contrast imaging (ATCI) with convection thermal modulators to provide more physiologically relevant parameters with high contrast such as the rate of temperature change, and thermal recovery time for tumor detection with a murine xenograft tumor model. With early stage tumors, we found the average rate of temperature change was higher in the tumor (0.22 ± 0.06 [Formula: see text]/sec) than that of neighboring tissue (0.13 ± 0.01 [Formula: see text]/sec) with heating modulation. With established tumors (volume > 100 mm3), this tendency was greater. On the other hand, the thermal recovery time was shorter in tumor tissue (τ = 7.30 ± 0.59 sec) than that of neighboring tissue (τ = 11.91 ± 2.22 sec). We also found distinct thermal contrast with cooling modulation. These data suggest ATCI is a potential tumor detection modality for clinical application with its inherently label-free and physiology-based approach. Furthermore, this strategy may find applications in endoscopic tumor detection in the future.

Keywords: (040.3060) Infrared; (110.2970) Image detection systems; (170.3880) Medical and biological imaging; (170.4580) Optical diagnostics for medicine.


Figures

Fig. 1
Fig. 1
Experimental setup of active thermodynamic contrast imaging (A) Schematic diagram of experimental setup. (B) Photograph of the setup consists of a thermal camera and a fluorescence imager. The thermal camera has a standard f 10 mm infrared imaging lens.
Fig. 2
Fig. 2
Active thermodynamic contrast imaging experimental procedure. (A) After generation of a subcutaneous tumor (SL4-DsRed cancer cell) to the right flank, the thermal imaging of sequential temperature distribution throughout the convection modulation on the skin with subcutaneous tumors. With the same animal, the data collection was performed when the tumor was at an early-stage and in its established stage using the thermal camera. After data collection, the time series of images were processed with custom-written software. (B) Region of interest of tumor and neighboring tissues. (C) An exemplary diagram for data analysis.
Fig. 3
Fig. 3
Thermal contrast imaging using convection thermal modulator with early-stage tumors. (A) Photograph of SL4-DsRed tumor-bearing mouse model. WL: white light image, FL: fluorescence image. (B, D) and (C, E) are representative sequential thermal images, and temperature changes over time in tumor and neighboring areas for heating and cooling, respectively from one animal. (F, G) shows the average and standard deviation in from all the animals in tumor and neighboring areas. The vertical shaded columns in F and G indicates the duration of thermal modulation for 10 secs for heating and cooling, respectively.
Fig. 4
Fig. 4
Thermal contrast imaging using convection thermal modulator with established tumors. (A) Photograph of SL4-DsRed tumor-bearing mouse model. WL: white light image, FL: fluorescence image. (B, D) and (C, E) are representative sequential thermal images, and temperature changes over time in tumor and neighboring areas for heating and cooling, respectively. (F, G) shows the average and standard deviation in from all the animals in tumor and neighboring areas. The vertical shaded columns in F and G indicates the duration of thermal modulation for 10 secs for heating and cooling, respectively.
Fig. 5
Fig. 5
The rate of temperature change and the thermal recovery time (τ) between tumor and neighboring tissue for active thermal imaging at xenograft mice model (n = 3). (A-D) Early-stage tumor and its neighboring tissue. (E-H) Established tumor and its neighboring tissue. (A-B) The comparison graph between early-stage tumor and neighboring tissue using heating modulation. (A) The rate of temperature change values. (B) Thermal recovery time during the recovery period. (C-D) The comparison graph between tumor and neighboring tissue using cooling modulation. (C) The rate of temperature change. (D) Thermal recovery time during the recovery period. (E-F) The comparison graph between established tumor and neighboring tissue using heating modulation. (E) The rate of temperature change values. (F) Thermal recovery time during the recovery period. (G-H) The comparison graph between established tumor and neighboring tissue using cooling modulation. (G) The rate of temperature change. (H) Thermal recovery time during the recovery period. The error bars are standard deviations from all the ROI data (i.e. total 3 for early-stage tumors and 9 for established tumors while 12 for all the neighboring tissues). * P < 0.05, ** P < 0.01, *** P < 0.001.
Fig. 6
Fig. 6
Histological features of the early-stage tumor. (A-C) Hematoxylin & Eosin (H&E) stain, (D-E) Immunohistochemical stain using smooth muscle actin antibody to highlight vascular structures. (magnifications A: × 80, B, C: × 200, D, E: × 400). Early-stage tumors (n = 3, size ranges 2.2 – 4.2 mm in diameter) show little signs of tumor necrosis (only one out of three tumors has localized necrosis). The tumor periphery (Box 1, B and D) shows relatively loose cell arrangement with tumoral capillaries highlighted with immunohistochemistry, while the central region (Box 2, C and E) shows compactly arranged tumor cells with slightly decreased capillary density with some collapsing signs in E.
Fig. 7
Fig. 7
Histological features of the established tumor. (A-C) Hematoxylin & Eosin (H&E) stain, (D-E) Immunohistochemical stain using smooth muscle actin antibody. (magnifications A: × 40, B, C: × 200, D, E: × 400). Established tumors (n = 4, size ranges 7.9 – 12.5 mm in diameter) show extensive tumor necrosis for all the tumor samples. The tumor periphery (Box 1, B and D) shows irregularly dilated staghorn-like blood vessels while the central region (Box 2, C and E) shows densely packed tumor cells with mostly collapsed vessels of low density that are barely recognized with immunohistochemistry.
Fig. 8
Fig. 8
Evidence of tumor necrosis from early-stage tumor (A), and established tumors (B-E) with Hematoxylin & Eosin (H&E) staining (magnification: × 100). Only one relatively small area of necrosis was found in the early-stage tumors (A) while extensive necrotic changes were observed from all the established tumors (B-E, images from all four tumors).

Similar articles

Cited by

References

    1. Oh G., Park Y., Yoo S. W., Hwang S., Chin-Yu A. V. D., Ryu Y.-M., Kim S.-Y., Do E.-J., Kim K. H., Kim S., Myung S. J., Chung E., “Clinically compatible flexible wide-field multi-color fluorescence endoscopy with a porcine colon model,” Biomed. Opt. Express 8(2), 764–775 (2017). - PMC - PubMed
    1. Sturm M.B., Wang T.D.,” Emerging optical methods for surveillance of Barrett's oesophagus,” Gut, gutjnl-2013–306706 (2015) - PMC - PubMed
    1. Diakides N. A., “Infrared Imaging: An Emerging Technology in Medicine,” IEEE Eng. Med. Biol. Mag. 17(4), 17–18 (1998). - PubMed
    1. Maldague X. P., Nondestructive evaluation of materials by infrared thermography (Springer Science & Business Media, 2012)
    1. Ng E.-K., “A review of thermography as promising non-invasive detection modality for breast tumor,” Int. J. Therm. Sci. 48(5), 849–859 (2009).

LinkOut - more resources