. 2017 Oct 20;8(11):5127-5138.
doi: 10.1364/BOE.8.005127. eCollection 2017 Nov 1.

Ultrahigh-resolution optical coherence elastography through a micro-endoscope: towards in vivo imaging of cellular-scale mechanics

Affiliations

Ultrahigh-resolution optical coherence elastography through a micro-endoscope: towards in vivo imaging of cellular-scale mechanics

Qi Fang et al. Biomed Opt Express. .

Abstract

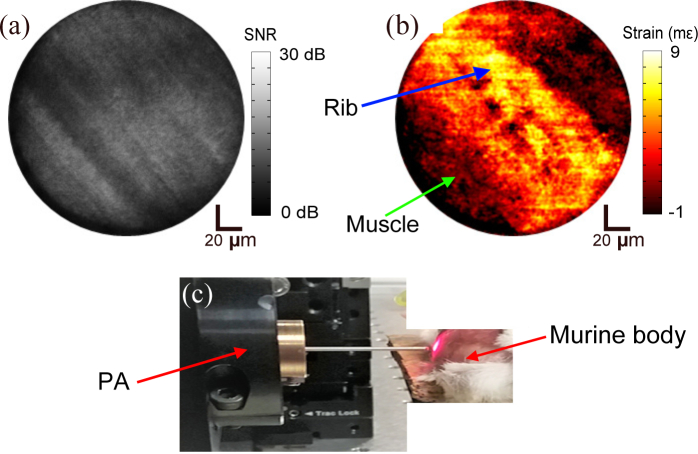
In this paper, we describe a technique capable of visualizing mechanical properties at the cellular scale deep in living tissue, by incorporating a gradient-index (GRIN)-lens micro-endoscope into an ultrahigh-resolution optical coherence elastography system. The optical system, after the endoscope, has a lateral resolution of 1.6 µm and an axial resolution of 2.2 µm. Bessel beam illumination and Gaussian mode detection are used to provide an extended depth-of-field of 80 µm, which is a 4-fold improvement over a fully Gaussian beam case with the same lateral resolution. Using this system, we demonstrate quantitative elasticity imaging of a soft silicone phantom containing a stiff inclusion and a freshly excised malignant murine pancreatic tumor. We also demonstrate qualitative strain imaging below the tissue surface on in situ murine muscle. The approach we introduce here can provide high-quality extended-focus images through a micro-endoscope with potential to measure cellular-scale mechanics deep in tissue. We believe this tool is promising for studying biological processes and disease progression in vivo.

Keywords: (110.4500) Optical coherence tomography; (170.2150) Endoscopic imaging; (170.3880) Medical and biological imaging.


Conflict of interest statement

BFK: OncoRes Medical (F,I), AC and DDS: OncoRes Medical (I). The other authors declare that there are no conflicts of interest related to this article.

Figures

Fig. 1
Fig. 1
(a) Schematic of the UHROCE system. DC, dispersion compensation; FC, fiber coupler; GS, galvanometer scanning mirrors; OL, objective lens; SLM, spatial light modulator (angle exaggerated); PBS, polarizing beam splitter; PC, polarization controller; λ/4, quarter-wave plate. (b) Enlarged drawing of the GRIN lens micro-endoscope setup used for phantom and ex vivo tissue measurements. GM, GRIN lens micro-endoscope; GP, glass plate; L, compliant layer; PA, piezoelectric actuator; S, sample. (c) Drawing of the micro-endoscope setup used for the in situ measurement. Figure components are not to scale.
Fig. 2
Fig. 2
Bessel beam profiles before and after the micro-endoscope. En face Bessel beam profile at focus (a) before and (b) after the micro-endoscope. Axial Bessel beam profile (c) before and (e) after the micro-endoscope. Maximum light intensity projection along the axial direction at focus (d) before and (f) after the micro-endoscope. DOF, depth-of-field.
Fig. 3
Fig. 3
PSF characterization. En face OCT image of a particle at focus in a PSF phantom imaged (a) before and (b) after the micro-endoscope; OCT B-scan of a particle at focus in the PSF phantom (c) before and (d) after the micro-endoscope. (e) and (f) SNR profiles along the horizontal and vertical red dashed lines in (a). (h) and (i) SNR profiles along the horizontal and vertical red dashed lines in (b). (g) and (j) SNR profiles along the vertical red dashed line in (c) and (d), respectively. Double-headed arrows are labelled for characterized resolutions in (e)–(j).
Fig. 4
Fig. 4
En face (a) OCM image and (b) quantitative micro-elastogram of the phantom at a depth of 100 µm.
Fig. 5
Fig. 5
En face (a) OCM image and (b) quantitative micro-elastogram of the freshly excised murine pancreatic tumor at a depth of 100 µm. The black arrows indicate a stiff area in the tumor. (c) Photograph of the tumor. The green dashed circle indicates the indented area, which corresponds to the scanning location. The photograph is cropped around the tumor margin. (d) Representative H&E histology at 100 µm depth with an enlarged view of the approximate scan area. C, cancer cells; E, extracellular matrices.
Fig. 6
Fig. 6
En face (a) OCM image and (b) strain micro-elastogram at an imaging depth of 230 µm from the surface of the murine muscle. (c) Photograph of the in situ setup. The red light appears illuminating the sample is the scattering light in the visible wings of the spectrum. PA, piezoelectric actuator.

References

    1. Janmey P. A., McCulloch C. A., “Cell mechanics: integrating cell responses to mechanical stimuli,” Annu. Rev. Biomed. Eng. 9, 1–34 (2007).10.1146/annurev.bioeng.9.060906.151927 - DOI - PubMed
    1. Greenleaf J. F., Fatemi M., Insana M., “Selected methods for imaging elastic properties of biological tissues,” Annu. Rev. Biomed. Eng. 5, 57–78 (2003).10.1146/annurev.bioeng.5.040202.121623 - DOI - PubMed
    1. Sarvazyan A. P., Rudenko O. V., Swanson S. D., Fowlkes J. B., Emelianov S. Y., “Shear wave elasticity imaging: a new ultrasonic technology of medical diagnostics,” Ultrasound Med. Biol. 24(9), 1419–1435 (1998).10.1016/S0301-5629(98)00110-0 - DOI - PubMed
    1. Muthupillai R., Ehman R. L., “Magnetic resonance elastography,” Nat. Med. 2, 601–603 (1996).10.1038/nm0596-601 - DOI - PubMed
    1. Butt H.-J., Cappella B., Kappl M., “Force measurements with the atomic force microscope: Technique, interpretation and applications,” Surf. Sci. Rep. 59(1–6), 1–152 (2005).10.1016/j.surfrep.2005.08.003 - DOI

LinkOut - more resources