

Optimal hemoglobin extinction coefficient data set for near-infrared spectroscopy
- PMID: 29188110
- PMCID: PMC5695960
- DOI: 10.1364/BOE.8.005151
Optimal hemoglobin extinction coefficient data set for near-infrared spectroscopy
Abstract
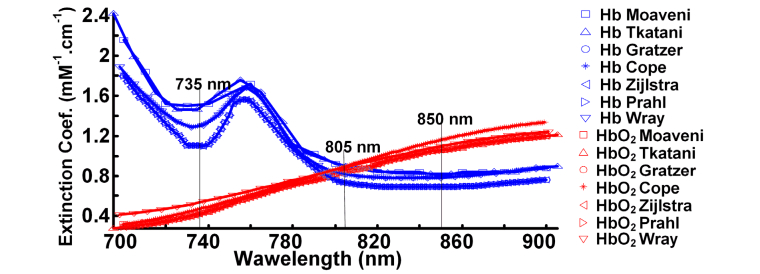
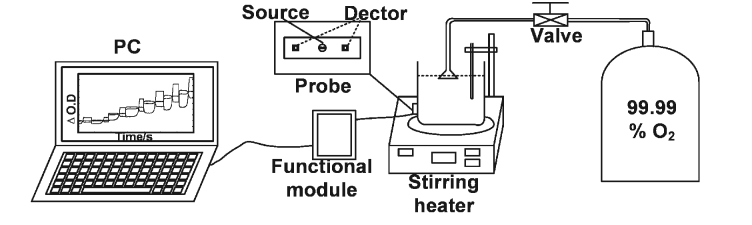
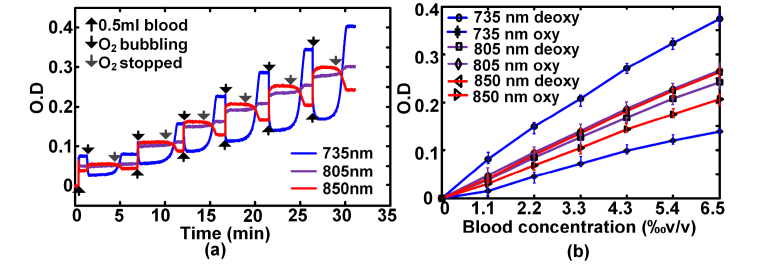
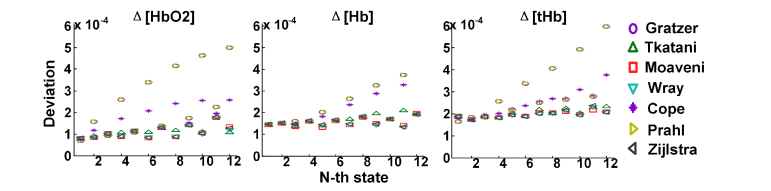
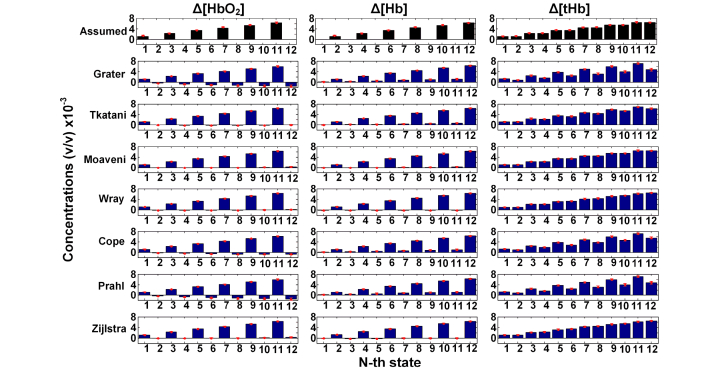
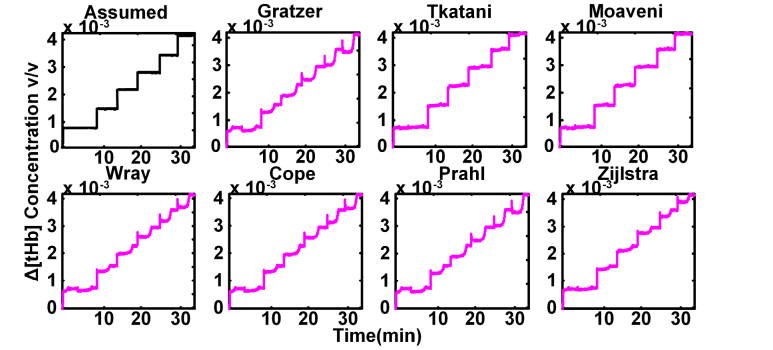
Extinction coefficient (ε) is a critical parameter for quantification of oxy-, deoxy-, and total-hemoglobin concentrations (Δ[HbO2], Δ[Hb], Δ[tHb]) from optical measurements of Near-infrared spectroscopy (NIRS). There are several different ε data sets which were frequently used in NIRS quantification. A previous study reported that even a small variation in ε could cause a significant difference in hemodynamic measurements. Apparently the selection of an optimal ε data set is important for NIRS. We conducted oxygen-state-varied and blood-concentration-varied model experiments with 57 human blood samples to mimic tissue hemodynamic variations. Seven reported ε data sets were evaluated by comparisons between quantifications and assumed values. We found that the Moaveni et al (1970)' ε data set was the optimal one, the NIRS quantification varied significantly among different ε data sets and parameter Δ[tHb] was most sensitive to ε data sets selection.
Keywords: (120.0120) Instrumentation, measurement, and metrology; (170.1470) Blood or tissue constituent monitoring; (170.6510) Spectroscopy.
Conflict of interest statement
The authors declare that there are no conflicts of interest related to this article.
Figures
Similar articles
-
Possible Influences on the Interpretation of Functional Domain (FD) Near-Infrared Spectroscopy (NIRS): An Explorative Study.Appl Spectrosc. 2016 Feb;70(2):363-71. doi: 10.1177/0003702815620562. Epub 2015 Dec 18. Appl Spectrosc. 2016. PMID: 26903570
-
Language-activated cerebral blood oxygenation and hemodynamic changes of the left prefrontal cortex in poststroke aphasic patients: a near-infrared spectroscopy study.Stroke. 1998 Jul;29(7):1299-304. doi: 10.1161/01.str.29.7.1299. Stroke. 1998. PMID: 9660376
-
Cerebral baseline optical and hemodynamic properties in pediatric population: a large cohort time-domain near-infrared spectroscopy study.Neurophotonics. 2024 Oct;11(4):045009. doi: 10.1117/1.NPh.11.4.045009. Epub 2024 Nov 15. Neurophotonics. 2024. PMID: 39554693 Free PMC article.
-
Hemodynamic signals in fNIRS.Prog Brain Res. 2016;225:153-79. doi: 10.1016/bs.pbr.2016.03.004. Epub 2016 Apr 7. Prog Brain Res. 2016. PMID: 27130415 Review.
-
Near-Infrared Spectroscopy: The New Must Have Tool in the Intensive Care Unit?Semin Cardiothorac Vasc Anesth. 2016 Sep;20(3):213-24. doi: 10.1177/1089253216644346. Epub 2016 May 19. Semin Cardiothorac Vasc Anesth. 2016. PMID: 27206637 Review.
Cited by
-
Feasibility of NAD(P)/NAD(P)H as redox agents in enzymatic plasmonic gold nanostar assays for galactose quantification.R Soc Open Sci. 2023 Oct 11;10(10):230825. doi: 10.1098/rsos.230825. eCollection 2023 Oct. R Soc Open Sci. 2023. PMID: 37830025 Free PMC article.
-
Enhancing cognitive and physical performance in older adults through wearable sensor-based interactive cognitive-motor training: a randomized clinical trial.Sci Rep. 2025 May 28;15(1):18604. doi: 10.1038/s41598-025-03725-x. Sci Rep. 2025. PMID: 40437038 Free PMC article. Clinical Trial.
-
Optical Measurement of Molar Absorption Coefficient of HbA1c: Comparison of Theoretical and Experimental Results.Sensors (Basel). 2022 Oct 25;22(21):8179. doi: 10.3390/s22218179. Sensors (Basel). 2022. PMID: 36365877 Free PMC article.
-
Cerebrovascular impedance estimation with near-infrared and diffuse correlation spectroscopy.Neurophotonics. 2023 Jan;10(1):015002. doi: 10.1117/1.NPh.10.1.015002. Epub 2023 Jan 23. Neurophotonics. 2023. PMID: 36699625 Free PMC article.
-
Recent Progress in Flexible and Wearable All Organic Photoplethysmography Sensors for SpO2 Monitoring.Adv Sci (Weinh). 2023 Nov;10(31):e2302752. doi: 10.1002/advs.202302752. Epub 2023 Sep 23. Adv Sci (Weinh). 2023. PMID: 37740697 Free PMC article. Review.
References
-
- Murkin J. M., Arango M., “Near-infrared spectroscopy as an index of brain and tissue oxygenation,” Br. J. Anaesth. 103(Suppl 1), i3–i13 (2009). - PubMed
-
- Colak S. B., Van der Mark M. B., Hooft G. W., Hoogenraad J. H., Van der Linden E. S., Kuijpers F. A., “Clinical optical tomography and NIR spectroscopy for breast cancer detection,” IEEE J. Sel. Top. Quantum Electron. 5(4), 1143–1158 (1999).
-
- Delpy D. T., Cope M., “Quantification in tissue near-infrared spectroscopy,” Phil. Trans. Biol. Sci. 352(1354), 649–659 (2002).
-
- Jöbsis F. F., “Noninvasive, infrared monitoring of cerebral and myocardial oxygen sufficiency and circulatory parameters,” Science 198(4323), 1264–1267 (1977). - PubMed
-
- Strangman G., Franceschini M. A., Boas D. A., “Factors affecting the accuracy of near-infrared spectroscopy concentration calculations for focal changes in oxygenation parameters,” Neuroimage 18(4), 865–879 (2003). - PubMed
LinkOut - more resources
Full Text Sources
Other Literature Sources