A three-dimensional spatial mapping approach to quantify fine-scale heterogeneity among leaves within canopies
- PMID: 29188145
- PMCID: PMC5703180
- DOI: 10.3732/apps.1700056
A three-dimensional spatial mapping approach to quantify fine-scale heterogeneity among leaves within canopies
Abstract
Premise of the study: The three-dimensional structure of tree canopies creates environmental heterogeneity, which can differentially influence the chemistry, morphology, physiology, and/or phenology of leaves. Previous studies that subdivide canopy leaves into broad categories (i.e., "upper/lower") fail to capture the differences in microenvironments experienced by leaves throughout the three-dimensional space of a canopy.
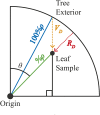
Methods: We use a three-dimensional spatial mapping approach based on spherical polar coordinates to examine the fine-scale spatial distributions of photosynthetically active radiation (PAR) and the concentration of ultraviolet (UV)-absorbing compounds (A300) among leaves within the canopies of black mangroves (Avicennia germinans).
Results: Linear regressions revealed that interior leaves received less PAR and produced fewer UV-absorbing compounds than leaves on the exterior of the canopy. By allocating more UV-absorbing compounds to the leaves on the exterior of the canopy, black mangroves may be maximizing UV-protection while minimizing biosynthesis of UV-absorbing compounds.
Discussion: Three-dimensional spatial mapping provides an inexpensive and portable method to detect fine-scale differences in environmental and biological traits within canopies. We used it to understand the relationship between PAR and A300, but the same approach can also be used to identify traits associated with the spatial distribution of herbivores, pollinators, and pathogens.
Keywords: Avicennia germinans; UV-absorbing compounds; spatial mapping; spherical polar coordinates.
Figures


Similar articles
-
Effects of kaolin application on light absorption and distribution, radiation use efficiency and photosynthesis of almond and walnut canopies.Ann Bot. 2007 Feb;99(2):255-63. doi: 10.1093/aob/mcl252. Epub 2006 Nov 30. Ann Bot. 2007. PMID: 17138580 Free PMC article.
-
Estimating photosynthetically active radiation distribution in maize canopies by a three-dimensional incident radiation model.Funct Plant Biol. 2008 Dec;35(10):867-875. doi: 10.1071/FP08054. Funct Plant Biol. 2008. PMID: 32688838
-
Distribution and accumulation of ultraviolet-radiation-absorbing compounds in leaves of tropical mangroves.Planta. 1992 Sep;188(2):143-54. doi: 10.1007/BF00216808. Planta. 1992. PMID: 24178250
-
Variation in leaf photosynthetic capacity within plant canopies: optimization, structural, and physiological constraints and inefficiencies.Photosynth Res. 2023 Nov;158(2):131-149. doi: 10.1007/s11120-023-01043-9. Epub 2023 Aug 24. Photosynth Res. 2023. PMID: 37615905 Review.
-
Optimality of nitrogen distribution among leaves in plant canopies.J Plant Res. 2016 May;129(3):299-311. doi: 10.1007/s10265-016-0824-1. Epub 2016 Apr 8. J Plant Res. 2016. PMID: 27059755 Review.
Cited by
-
Epigenetic and transcriptional responses underlying mangrove adaptation to UV-B.iScience. 2021 Sep 20;24(10):103148. doi: 10.1016/j.isci.2021.103148. eCollection 2021 Oct 22. iScience. 2021. PMID: 34646986 Free PMC article.
References
-
- Agati G., Galardi C., Gravano E., Romani A., Tattini M. 2002. Flavonoid distribution in tissues of Phillyrea latifolia L. leaves as estimated by microspectrofluorometry and multispectral fluorescence microimaging. Photochemistry and Photobiology 76: 350–360. - PubMed
-
- Agati G., Brunetti C., Di Ferdinando M., Ferrini F., Pollastri S., Tattini M. 2013. Functional roles of flavonoids in photoprotection: New evidence, lessons from the past. Plant Physiology and Biochemistry 72: 35–45. - PubMed
-
- Baldocchi D. D., Wilson K. B., Gu L. 2002. How the environment, canopy structure and canopy physiological functioning influence carbon, water and energy fluxes of a temperate broad-leaved decidous forest—an assessment with the biophysical model CANOAK. Tree Physiology 22: 1065–1077. - PubMed
-
- Beggs C. J., Wellmann E. 1994. Photocontrol of flavonoid biosynthesis. In R. E. Kendrick and G. H. M. Kronenberg [eds.], Photomorphogenesis in plants, ed. 2, 733–751. Kluwer Academic Publishers, Dordecht, The Netherlands.
-
- Bilger W., Johnsen T., Schreiber U. 2001. UV-excited chlorophyll fluorescence as a tool for the assessment of UV-protection by the epidermis of plants. Journal of Experimental Botany 52: 2007–2014. - PubMed
LinkOut - more resources
Full Text Sources
Other Literature Sources
Research Materials

