. 2016 Dec 27;1(3):208-218.
doi: 10.1182/bloodadvances.2016000158. Epub 2016 Oct 30.

Fewer Circulating Natural Killer Cells 28 Days After Double Cord Blood Transplantation Predicts Inferior Survival and IL-15 Response

Affiliations

Fewer Circulating Natural Killer Cells 28 Days After Double Cord Blood Transplantation Predicts Inferior Survival and IL-15 Response

Rachel J Bergerson et al. Blood Adv. .

Abstract

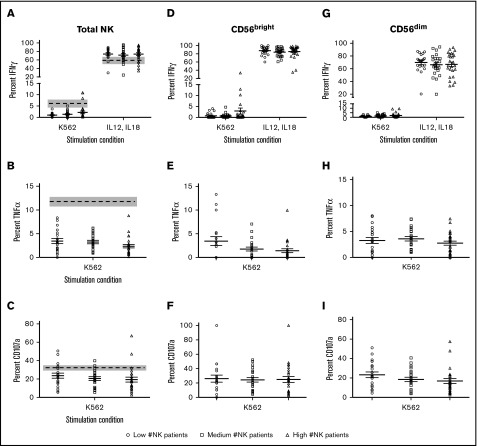
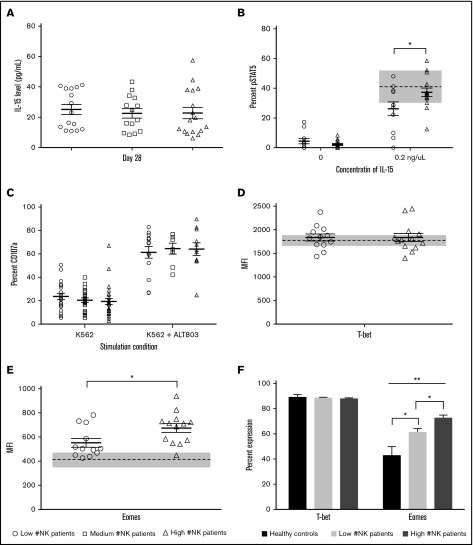
Natural Killer (NK) cell immune reconstitution after double umbilical cord blood transplantation (dUCBT) is rapid and thought to be involved in graft vs. leukemia (GvL) reactions. To investigate the role of NK cell recovery on clinical outcomes, the absolute number of NK cells at Day 28 after dUCBT was determined and patients with low numbers of NK cells had inferior two year disease-free survival (hazard ratio 1.96; p=0.04). A detailed developmental and functional analysis of the recovering NK cells was performed to link NK recovery and patient survival. The proportion of NK cells in each developmental stage was similar for patients with low, medium, and high Day 28 NK cell numbers. As compared to healthy controls, patients post-transplant showed reduced NK functional responses upon K562 challenge (CD107a, IFN-γ, and TNFα); however, there were no differences based on Day 28 NK cell number. Patients with low NK numbers had 30% less STAT5 phosphorylation in response to exogenous IL-15 (p=0.04) and decreased Eomes expression (p=0.025) compared to patients with high NK numbers. Decreased STAT5 phosphorylation and Eomes expression may be indicative of reduced sensitivity to IL-15 in the low NK cell group. Incubation of patient samples with IL-15 superagonist (ALT803) increased cytotoxicity and cytokine production in all patient groups. Thus, clinical interventions, including administration of IL-15 early after transplantation may increase NK cell number and function and, in turn, improve transplantation outcomes.


Conflict of interest statement

Conflict of interest statement: The authors have no relevant conflicts.

Figures

None
Graphical abstract
Figure 1.
Figure 1.
Absolute numbers of NK cells at D+28 after dUCBT are associated with clinical outcomes. (A) 2-year DFS of low, medium, and high NK groups (28%, 46%, and 55%; *shows comparison of low NK vs high NK groups where P = .04). (B) 2-year NRM of low, medium, and high NK groups (41%, 26%, and 18%; P = .08). (C) 2-year relapse incidence in the low, medium, and high NK groups (30%, 28%, and 27%; P = .94). (D) 100-day grade II-IV acute GVHD in the low, medium, and high NK patients (49%, 46%, and 47%; P = .51).
Figure 2.
Figure 2.
Number of NK cells at D+28 after dUCB correlates with the number and percentage of CD56brightand CD56dimNK cells. (A) Absolute number of CD56+Lin NK cells in each tertile. (B) Absolute number of CD56bright (R = 0.85, 95% CI: 0.77-0.90; P < .01) and CD56dim (R = 0.95, 95% CI: 0.92-0.97; P < .01) NK cells in each tertile as a function of the total NK cell population. (C) Proportion of CD56+Lin NK cells in each tertile (R = 0.57, 95% CI: 0.40-0.70; P < .01). (D) Proportion of CD56bright (R = 0.27, 95% CI: 0.06-0.46; P = .01) and CD56dim (R = −0.28, 95% CI: −0.47–0.06; P = .01) NK cells in each tertile. Data represented as a data point for each patient with the mean as the solid middle line with standard error above and below. R = Spearman correlation coefficients. Healthy donor controls for panel B are represented by the dashed line (mean) and gray box (standard error). The absolute number of each population was calculated by multiplying the proportion of each NK differentiation stage by the absolute number of NK cells. *R = ±0.25-0.50; **R = ±0.50-0.8; ***R > ±0.8.
Figure 3.
Figure 3.
Overall number of NK cells correlates with number but not the proportion of each NK developmental stage. (A) Absolute number of circulating CD56brightCD117+NKG2A stage III NK cells. (B) Absolute number of circulating stage IV CD56brightCD117+ (left, R = 0.85, 95% CI: 0.77-0.90; P < .01) and CD56brightCD117 (right, R = 0.77, 95% CI: 0.66-0.85; P < .01) NK cells. (C) Absolute number circulating of CD56dimNKG2A+ stage V (left, R = 0.86, 95% CI: 0.80-0.91; P < .01), CD56dimKIR+ stage V (middle, R = 0.77, 95% CI: 0.66-0.84; P < .01), and CD56dimCD57 stage V (right, R = 0.77, 95% CI: 0.66-0.84; P < .01) NK cells. (D) Absolute number of circulating CD56dimCD57+ stage VI NK cells (R = 0.95, 95% CI: 0.92-0.97; P < .01). (E) Proportion of stage III NK cells. (F) Proportion of stage IV CD56bright CD117+ (left) and CD56brightCD117 (right) NK cells. (G) Proportion of NKG2A+ stage V (left), KIR+ stage V (middle), and CD56dimCD57 stage V (left) NK cells. (F) Proportion of CD56dimCD57+ stage VI NK cells. R = Spearman correlation coefficients. Data represented as a data point for each patient with the mean of the population as the solid middle line with standard error above and below. Healthy donor controls for panels E-H are represented by the mean (dashed line) and standard error (gray box). The absolute number of each population was calculated by multiplying the proportion of each NK differentiation stage by the absolute number of NK cells. *R = ±0.25-0.50; **R = ±0.50-0.8; ***R > ±0.8.
Figure 4.
Figure 4.
Target cell–induced function is impaired at D+28 after dUCBT for NK cell groups. PBMCs from healthy donor controls and patients at D+28 after dUCBT were cocultured with K562 target cells for 4 hours or IL-12/IL-18 overnight. Expression of CD107a, IFN-γ, and TNF-α was measured on CD56+Lin gated NK cells. (A) Expression of IFN-γ after K562 coculture (left) or IL-12/IL-18 stimulation (right). (B) Expression of TNF-α after K562 coculture. (C) Expression of CD107a after K562 coculture. Data represented as a data point for each patient with the mean of the population as the solid middle line with standard error above and below. Healthy donor controls are represented by the mean (dashed line) and standard error (gray box). For samples shown in panels D-I, NK cells were gated on CD56bright and CD56dim populations based on MFI. Percentage expression of IFN-γ (D,G), TNF-α (E,H), and CD107a (F,I) is shown.
Figure 5.
Figure 5.
Patients with low NK numbers at D+28 have impaired response to exogenous IL-15 and reduced Eomes expression. Serum or PBMCs from healthy donor controls and patients at D+28 after dUCBT were rested overnight. Expression of pSTAST5, T-bet, and Eomes was measured on CD56+Lin gated NK cells. (A) D+28 IL-15 serum levels measured by ELISA in patients with low, medium, and high numbers of NK cells D+28 post-dUCBT. (B) Expression of pSTAT5 at baseline (left) or after 15 minutes of stimulation with 0.2 ng/μL IL-15 (right) in patients with low or high NK numbers D+28. (C) MFI of T-bet expression in patients with low or high NK numbers D+28. (D) MFI of Eomes expression in patients with low or high NK numbers D+28. (E) Percentage of T-bet (left) and Eomes (right) expression in healthy controls and patients with low or high NK numbers D+28. Scatter plot data represented as a data point for each patient with the mean of the population as the solid middle line and standard error above and below (A-D). Healthy donor controls are represented by the mean (dashed line) and standard error (gray box) where applicable. *P < .05; **P < .01.

References

    1. Merindol N, Charrier E, Duval M, Soudeyns H. Complementary and contrasting roles of NK cells and T cells in pediatric umbilical cord blood transplantation. J Leukoc Biol. 2011;90(1):49-60. - PubMed
    1. Kanda J, Chiou LW, Szabolcs P, et al. . Immune recovery in adult patients after myeloablative dual umbilical cord blood, matched sibling, and matched unrelated donor hematopoietic cell transplantation. Biol Blood Marrow Transplant. 2012;18:1664-1676.e1661. - PMC - PubMed
    1. Barker JN, Weisdorf DJ, DeFor TE, et al. . Transplantation of 2 partially HLA-matched umbilical cord blood units to enhance engraftment in adults with hematologic malignancy. Blood. 2005;105(3):1343-1347. - PubMed
    1. Verneris MR, Brunstein CG, Barker J, et al. . Relapse risk after umbilical cord blood transplantation: enhanced graft-versus-leukemia effect in recipients of 2 units. Blood. 2009;114(19):4293-4299. - PMC - PubMed
    1. Scaradavou A, Brunstein CG, Eapen M, et al. . Double unit grafts successfully extend the application of umbilical cord blood transplantation in adults with acute leukemia. Blood. 2013;121(5):752-758. - PMC - PubMed

LinkOut - more resources