. 2017 Nov 30:6:e30233.
doi: 10.7554/eLife.30233.

Time-gated detection of protein-protein interactions with transcriptional readout

Affiliations

Time-gated detection of protein-protein interactions with transcriptional readout

Min Woo Kim et al. Elife. .

Abstract

Transcriptional assays, such as yeast two-hybrid and TANGO, that convert transient protein-protein interactions (PPIs) into stable expression of transgenes are powerful tools for PPI discovery, screens, and analysis of cell populations. However, such assays often have high background and lose information about PPI dynamics. We have developed SPARK (Specific Protein Association tool giving transcriptional Readout with rapid Kinetics), in which proteolytic release of a membrane-tethered transcription factor (TF) requires both a PPI to deliver a protease proximal to its cleavage peptide and blue light to uncage the cleavage site. SPARK was used to detect 12 different PPIs in mammalian cells, with 5 min temporal resolution and signal ratios up to 37. By shifting the light window, we could reconstruct PPI time-courses. Combined with FACS, SPARK enabled 51 fold enrichment of PPI-positive over PPI-negative cells. Due to its high specificity and sensitivity, SPARK has the potential to advance PPI analysis and discovery.

Keywords: GPCR; LOV domain; TEV protease; Tango; cell biology; genetic selection; proximity-dependent labeling.


Conflict of interest statement

No competing interests declared.

AYT and WW have filed a patent application covering some aspects of this work.(U.S. Pat. App. No. 62/440,825).

Alice Y Ting: AYT and WW have filed a patent application covering some aspects of this work.(U.S. Pat. App. No. 62/440,825).

Figures

Figure 1.
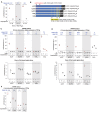
Figure 1.. Design of SPARK and application to light- and agonist-dependent detection of β2-adrenergic receptor (β2AR)-β-arrestin2 interaction.
(A) Scheme. A and B are proteins that interact under certain conditions. In this example, protein A is membrane-associated and is fused to a light-sensitive eLOV domain (Wang et al., 2017), a protease cleavage site (TEVcs), and a transcription factor (TF). These comprise the ‘SPARK TF component.’ Protein B is fused to a truncated variant of TEV protease (TEVp) (‘SPARK protease component’). When A and B interact (right), TEVp is recruited to the vicinity of TEVcs. When blue light is applied to the cells, eLOV reversibly unblocks TEVcs. Hence, the coincidence of light and A-B interaction permits cleavage of TEVcs by TEVp, resulting in the release of the TF, which translocates to the nucleus and drives transcription of a chosen reporter gene. (B) SPARK constructs for studying the β2AR-β-arrestin2 interaction. V5 and myc are epitope tags. UAS is a promoter recognized by the TF Gal4. (C) Imaging of SPARK activation by β2AR-β-arrestin2 interaction under four conditions. HEK 293T cells were transiently transfected with the three SPARK components shown in (B). β2AR-β-arrestin2 interaction was induced with addition of 10 μM isoproterenol for 5 min. Light stimulation was via 467 nm LED at 60 mW/cm2 and 10% duty cycle (0.5 s of light every 5 s) for 5 min. Nine hours after stimulation, cells were fixed and imaged. (D) Same as (C), but HEK 293T cells were stably expressing the SPARK protease component and transiently expressing SPARK TF component and UAS-luciferase. Results of shorter and longer irradiation times are also shown. ±isoproterenol signal ratio was quantified for each time point. Each datapoint reflects one well of a 96-well plate containing >6000 transfected cells. Four replicates per condition. (E) SPARK is specific for PPIs over non-interacting protein pairs. Same experiment as in (C), except arrestin was replaced by calmodulin protein (which does not interact with β2AR) in the second column, and β2AR was replaced by the calmodulin effector peptide MK2 (which does not interact with arrestin) in the third column. Anti-myc and anti-V5 antibodies stain for the SPARK protease and TF components, respectively. (F) SPARK is activated by direct interactions and not merely proximity. Top: experimental scheme. To drive proximity but not interaction, we created SPARK constructs in which A and B domains were a transmembrane (TM) segment of the CD4 protein, and β-arrestin2, respectively. TM and arrestin do not interact. HEK 293T cells expressing these SPARK constructs were also transfected with an expression plasmid for HA-tagged β2AR. Upon isoproterenol addition, β-arrestin2-TEVp is recruited to the plasma membrane via interaction with β2AR, but it does not interact directly with the SPARK TF component. Bottom: Images of HEK 293T cells 9 hr after stimulation with isoproterenol and light (for 5 min). The last column shows the experiment depicted in the scheme. The first two columns are positive controls with SPARK constructs containing β2AR and β-arrestin2 (which do interact). The third column is a negative control with omission of the HA-β2AR construct. Anti-V5, anti-myc, and anti-HA antibodies stain for SPARK TF component, SPARK protease component, and HA- β2AR proteins, respectively. All scale bars, 100 μm.
Figure 1—figure supplement 1.
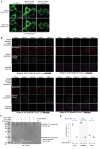
Figure 1—figure supplement 1.. Characterization of SPARK – Testing alternative TEVcs sequences and alternative LOV domains.
(A) Three alternative TEVcs sequences that differ at the P1´ site were tested in the context of β2AR-β-arrestin2 SPARK. HEK cells were prepared as in Figure 1D and stimulated with 10 μM isoproterenol and blue LED light for 5 min. Nine hours later, cells were analyzed for luciferase activity. Each condition was replicated four times. We then used the TEVcs sequence with X = M for all experiments in this study, except where indicated. (B) Five LOV-TEVcs fusions compared. eLOV (top) was engineered by directed evolution in a previous study122, and is used in all SPARK experiments in this study, except where indicated. The red lines indicate where the eLOV sequence differs from that of AsLOV2(G126A/N136E)122, the template used for directed evolution. iTANGO123 uses the LOV domain from iLID125 (bottom two constructs) and its TEVcs ‘bites back’ six amino acids into LOV’s Jα helix. Yellow lines indicate where iLID’s LOV sequence differs from that of AsLOV2(G126A/N136E)(Strickland et al., 2010). hLOV1 and hLOV2 are two hybrid LOV domains that merge the features of eLOV and iLID. TEVcs is the same in the top four constructs but has Gly instead of Met in the P1´ position in the bottom construct. (C) Comparison of five LOV-TEVcs fusions, with luciferase readout, and stable (low) expression of β-arrestin2-TEVp. The boxed region is enlarged underneath. HEK 293T cells were prepared as in Figure 1D, with β-arrestin2-TEVp stably expressed and SPARK β2AR-TF (containing one of five LOV-TEVcs sequences from (B)) and UAS-luciferase transiently expressed. 18 hr post-transfection, cells were stimulated with 15 min of isoproterenol and ambient light. Nine hours later, cells were analyzed for luciferase activity. Each condition was replicated four times. ± Ligand signal ratios (SR) and ±light signal ratios for each construct quantified across top. (D) Same as (C), but with transient overexpression of β-arrestin2-TEVp component, instead of stable/low expression. The boxed region is enlarged underneath. (E) Same as (D) but with 5 min instead of 15 min light stimulation.
Figure 1—figure supplement 2.
Figure 1—figure supplement 2.. Further characterization of SPARK tool.
(A) HA-β2AR construct recruits β-arrestin2 -EGFP to the plasma membrane. GFP images of HEK293T cells transiently expressing rat β-arrestin2-EGFP along with one of the following: HA-β2AR, β2AR SPARK TF component (from Figure 1B), or TM SPARK TF component (TM from CD4, used in Figure 1F). Live cell GFP images were acquired before and after incubation with 10 μM isoproterenol to activate β2AR. Arrowheads point to regions showing re-localization of β-arrestin2-GFP. Scale bar, 10 μm. (B) Additional fields of view for the experiment shown in Figure 1F. Scale bar, 100 μm. (C) HEK293T cells were transiently transfected (using PEI max) with the SPARK constructs shown in Figure 1B. 18 hr post-transfection, cells were stimulated with 10 μM isoproterenol and blue light (467 nm, 60 mW/cm2, 10% duty cycle) for 5 or 30 min total. Cells were then immediately lysed in the presence of 20 mM iodoacetamide TEVp inhibitor and run on 8% SDS-PAGE. Anti-V5 blot visualizes the SPARK TF component, which is 97 kD before cleavage and 32 kD after cleavage at the TEVcs. Negative controls omit isoproterenol or light. (D) HEK293T cells were prepared as in Figure 1D. 15 hr post-transfection, cells were stimulated with 5 min of either ambient room light or blue LED light (467 nm, 60 mW/cm2, 10% duty cycle) concurrently with 10 μM isoproterenol. Nine hours later, cells were analyzed for luciferse activity. Each condition was replicated four times.
Figure 2.
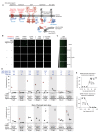
Figure 2.. SPARK can be applied to a variety of PPIs.
(A) PPI pairs studied with SPARK. DRD1 and NMBR are GPCRs that interact with β-arrestin2. EGFR is a receptor tyrosine kinase that recruits Grb2 upon stimulation with EGF ligand. FKBP and FRB are soluble proteins that heterodimerize upon addition of the drug rapamycin; to keep FRB SPARK out of the nucleus in the basal state, we fuse it to either a plasma membrane anchor (TM from CD4) or a mitochondrial membrane anchor (TM from AKAP1). CIBN-CRY2PHR is a light-inducible PPI (Kennedy et al., 2010). (B) SPARK data corresponding to PPIs depicted in (A). SPARK constructs were the same as those shown in Figure 1B, except β2AR and β-arrestin2 genes were respectively replaced by the A and B protein-coding genes indicated. HEK293T cells transiently expressing SPARK constructs were stimulated with light and the ligand indicated in (A) for 5 min, then fixed and imaged 9 hr later. Citrine fluorescence images are shown. Dashed lines separate experiments that were performed separately and shown with different Citrine intensity scales. Scale bar, 100 μm. Quantitation of EGFR-Grb2 SPARK images (five separate fields of view): ±light signal ratio = 12; ±EGF signal ratio = 27. (C) SPARK detection of CIBN-CRY2PHR interaction. Blue light (467 nm, 60 mW/cm2, 33% duty cycle (2 s light every 6 s)) simultaneously uncages the eLOV domain and induces the CIBN-CRY2PHR interaction. Scale bar, 100 μm. See Figure 2—figure supplement 1 for additional data using FRB-FKBP and CIBN-CRY2PHR SPARK constructs. (D) SPARK applied to eight different GPCRs. HEK293T cells were prepared as in Figure 1D. The SPARK protease component is β-arrestin2-TEVp. The SPARK TF component contains the indicated GPCR (no vasopressin V2 domain). Light (ambient) and ligand were applied for 15 min total, then cells were analyzed for luciferase activity 9 hr later. Four replicates per condition. ±Ligand signal ratios (SR) and ±light signal ratios for each GPCR quantified across top. The boxed region is enlarged at bottom. (E) Isoproterenol and alprenolol dose-response curves with β2AR-β-arrestin2 SPARK readout. HEK293T cells were prepared and stimulated as in Figure 1D, with 5 min light window. Four replicates per concentration. Errors, ±STD. EC50 of 52 nM for isoproterenol and IC50 of 0.7 nM for alprenolol are close to published values (Fisher et al., 2010; Gether et al., 1995).
Figure 2—figure supplement 1.
Figure 2—figure supplement 1.. Additional data with FRB-FKBP and CIBN-CRY2PHR SPARK constructs.
The SPARK constructs from Figure 2B and C were co-expressed in HEK293T cells with UAS-luciferase reporter gene to facilitate quantification. Stimulation conditions were the same as in Figure 2B and C, and cells were treated with luciferin 9 hr later. We performed four replicates per condition. ±Ligand signal ratios (SR) and ±light SR are quantified across the top.
Figure 3.
Figure 3.. Shifting the light window permits SPARK analysis of the dynamic GPCR-β-arrestin2 interaction.
(A) Scheme. By shifting the light window, it is possible to read out different temporal regimes of protein A-protein B interaction. On the left, light coincides with a period of high A-B interaction, resulting in SPARK activation and transcription of a reporter gene. On the right, light coincides with a period of low A-B interaction, so SPARK is not activated. (B) Panel of β2AR agonists, partial agonists, and antagonist. Biased agonists preferentially recruit one downstream effector (such as β-arrestin2) over another. (C) β2AR-β-arrestin2 interaction time course with various ligands. HEK293T cells expressing SPARK constructs were prepared as in Figure 1D. 15 hr after transfection, 10 μM ligand was added at time = 0 min and remained on the cells for the duration of the experiment. The light window was 5 min, centered around the timepoint given on the x axis. 9 hr after initial addition of ligand, cells were mixed with luciferin substrate and analyzed for luciferase activity. Time courses are normalized with maximum signal ratio (SR) set to one and minimum SR set to 0. Each datapoint represents the mean of 4 replicates. Errors, ±STD. (D) Receptor-β-arrestin2 interaction time course with different receptors. Same as (C), except β2AR in the SPARK TF component was replaced with various other GPCRs, and ligand was added only briefly, from time = 0 to 5 min. (E) Same as (D), except ligand remained on the cells for the duration of the experiment (9 hr).
Figure 4.
Figure 4.. SPARK can be coupled to genetic selections.
(A) Selection scheme to enrich cells with PPI (protein-protein interaction) event during time window of interest over cells without PPI event. Culture dish containing mixed population of cells. Protein A (the ‘bait’) remains constant in the SPARK TF component, but protein B (‘prey’) varies in the SPARK protease component. In our model selection, we used β-arrestin2 as the matched prey (interacts with β2AR), and calmodulin as the mis-matched prey (does not interact with β2AR). The culture dish is subjected to light and β2AR-stimulating ligand isoproterenol for 10 min, then cultured for an additional 9 hr. FACS sorting is performed to isolate cells with high Citrine expression, indicative of SPARK activation. After sorting, the cell population is expected to be strongly enriched in β-arrestin2-expressing cells over calmodulin-expressing cells. (B) Imaging of HEK293T cells expressing SPARK components with matched bait + prey (top) versus mismatched bait + prey (bottom). Images were acquired 9 hr after stimulation with 10 μM isoproterenol and light (daylight lamp, 25W, 6500K, 480 nm/530 nm/590 nm). Anti-V5 antibody stains for the SPARK β2AR TF component. Scale bar, 100 μm. (C) RT-qPCR analysis of mixed cell population before and after FACS sorting. RNA was extracted from cells and reverse transcribed, and arrestin-TEVp:calmodulin-TEVp ratios were quantified by qPCR. Pre-sort ratio is 1:66; post-sort ratio is 1:1.3. Data represent the mean of three replicates. Error bar, ±STD.
Figure 4—figure supplement 1.
Figure 4—figure supplement 1.. SPARK comparison to TANGO and iTANGO.
(A) SPARK, TANGO, and iTANGO constructs used to detect β2AR-β-arrestin2 interaction. The β2AR fusions were each prepared with and without the vasopressin receptor tail (V2, purple) that enhances arrestin recruitment (Oakley et al., 2000). These SPARK, TANGO, and iTANGO constructs differ in their TEVcs, TEVp, and LOV sequences; arrestin, β2AR, and TF domains are constant. In comparison to SPARK, TANGO uses full-length TEVp and a lower-affinity TEVcs with Leu instead of Met at the P1´ site. TANGO has no light gating. In comparison to SPARK, iTANGO uses a split TEVp with lower catalytic turnover (Lee et al., 2017; Wehr et al., 2006; Gray et al., 2010), a higher-affinity TEVcs with Gly at the P1´ site, and the LOV sequence from iLID (Guntas et al., 2015) instead of eLOV (Wang et al., 2017). (B) SPARK versus TANGO comparison. HEK293T cells stably expressing the protease component of SPARK or TANGO were transiently transfected with the corresponding TF component and UAS-luciferase. 18 hr post-transfection, cells were stimulated with 15 min of light (daylight lamp) and isoproterenol, then analyzed for luciferase activity 9 hr later (left). Alternatively (right), cells were stimulated with 15 min of light in the presence of isoproterenol, and isoproterenol remained on the cells for another 18 hr, before luciferase detection (to match published conditions for TANGO [Barnea et al., 2008; Inagaki et al., 2012]). Each condition was replicated four times. ± Isoproterenol signal ratios are quantified at top. (C) SPARK versus iTANGO comparison. Constructs shown in (A) were introduced by lipofectamine transfection into HEK293T cells along with UAS-luciferase. 18 hr post-transfection, cells were stimulated with either 5 min (left) or 20 min (right) of isoproterenol and light (daylight lamp). Nine hours later, cells were analyzed for luciferase activity. Each condition was replicated four times. ± Isoproterenol and ±light signal ratios are quantified at top. (D) β2AR-β-arrestin2 interaction time course comparison using SPARK or iTANGO constructs. Assay was performed by shifting the light window as in Figure 4—figure supplement 1A. 15 hr post-transfection, isoproterenol was added from t=0 to 5 minutes, and light was delivered at various time intervals indicated (light window was 5 minutes, centered around the x-axis value, i.e., 0-5 min, 5-10 min, etc.). 9 hours after isoproterenol addition, luciferase activity was measured. Time courses are normalized with maximum signal ratio (SR) set to 1 and minimum SR set to 0. Each datapoint represents the mean of 4 replicates. Errors, ±STD. (E) Same as (D) except the β2AR gene in SPARK or iTANGO was replaced with the DRD1 (dopamine receptor D1) gene. The ligand used for stimulation (0-5 min) was dopamine.

References

    1. Barnea G, Strapps W, Herrada G, Berman Y, Ong J, Kloss B, Axel R, Lee KJ. The genetic design of signaling cascades to record receptor activation. PNAS. 2008;105:64–69. doi: 10.1073/pnas.0710487105. - DOI - PMC - PubMed
    1. Bologna Z, Teoh JP, Bayoumi AS, Tang Y, Kim IM. Biased G protein-coupled receptor signaling: New player in modulating physiology and pathology. Biomolecules & Therapeutics. 2017;25:12–25. doi: 10.4062/biomolther.2016.165. - DOI - PMC - PubMed
    1. Eichel K, Jullié D, von Zastrow M. β-Arrestin drives MAP kinase signalling from clathrin-coated structures after GPCR dissociation. Nature Cell Biology. 2016;18:303–310. doi: 10.1038/ncb3307. - DOI - PMC - PubMed
    1. Fetchko M, Stagljar I. Application of the split-ubiquitin membrane yeast two-hybrid system to investigate membrane protein interactions. Methods. 2004;32:349–362. doi: 10.1016/j.ymeth.2003.10.010. - DOI - PubMed
    1. Fields S, Song O. A novel genetic system to detect protein-protein interactions. Nature. 1989;340:245–246. doi: 10.1038/340245a0. - DOI - PubMed

Publication types