

Comparative Analysis of Soybean Root Proteome Reveals Molecular Basis of Differential Carboxylate Efflux under Low Phosphorus Stress
- PMID: 29189708
- PMCID: PMC5748659
- DOI: 10.3390/genes8120341
Comparative Analysis of Soybean Root Proteome Reveals Molecular Basis of Differential Carboxylate Efflux under Low Phosphorus Stress
Abstract
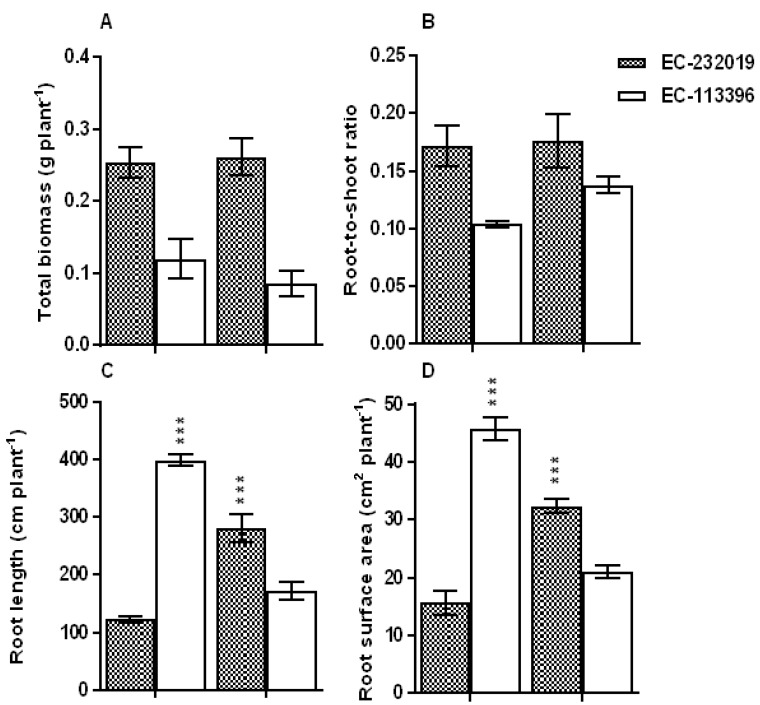
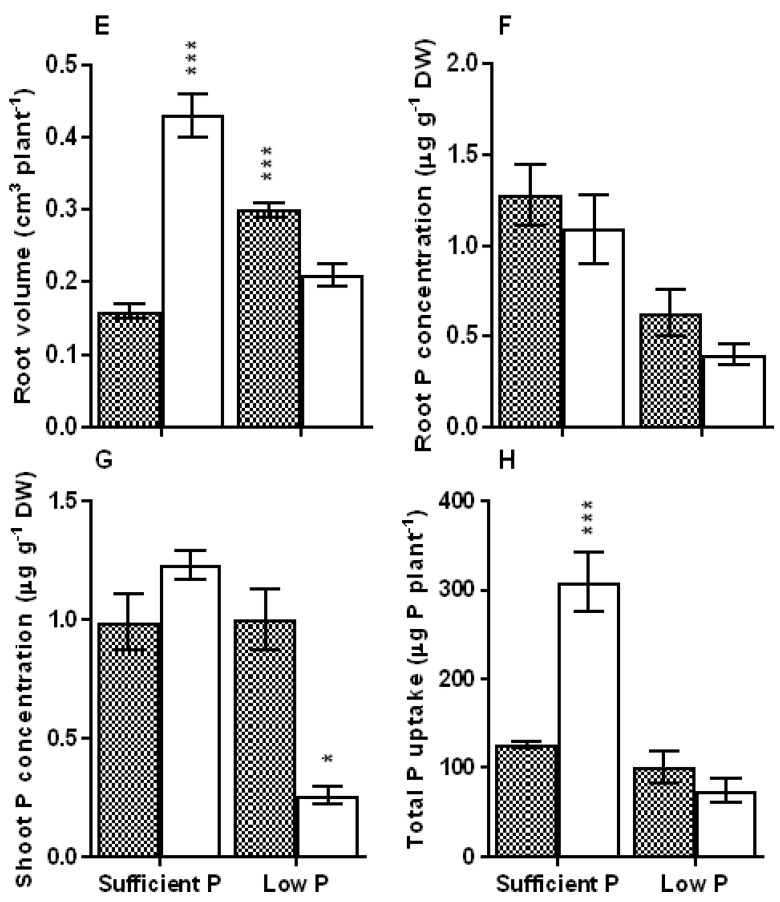
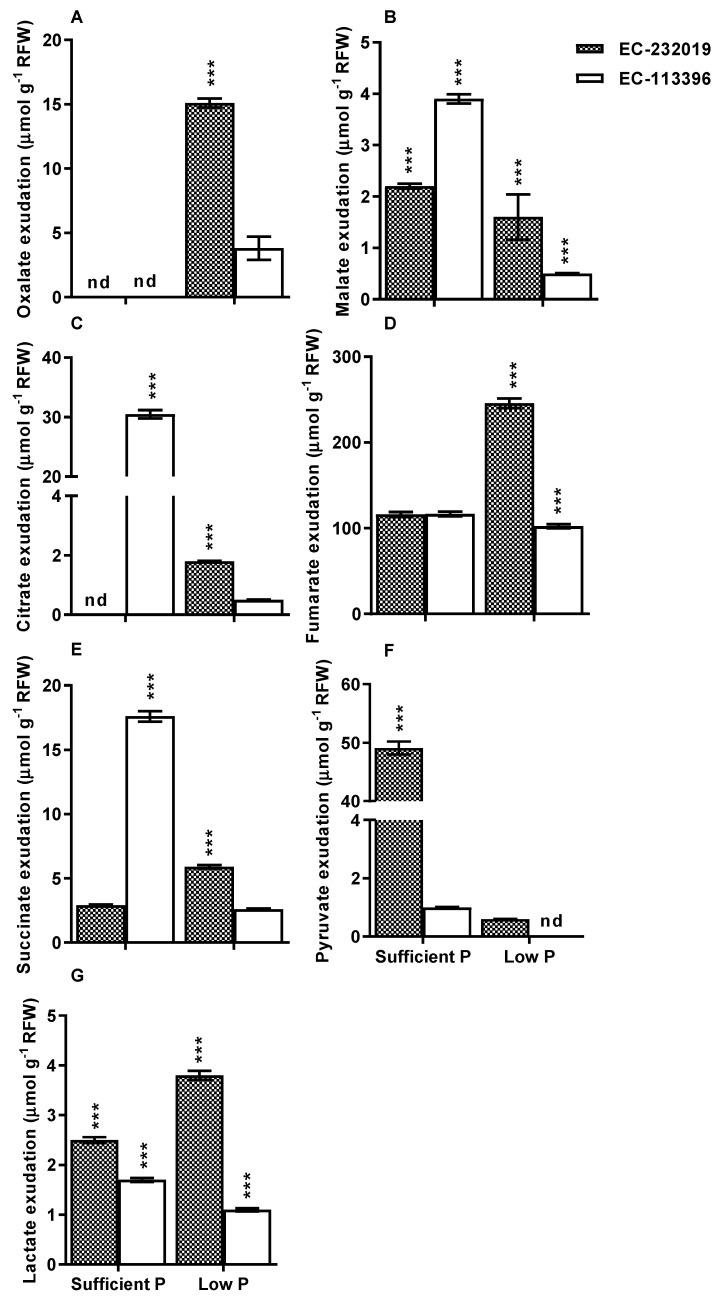
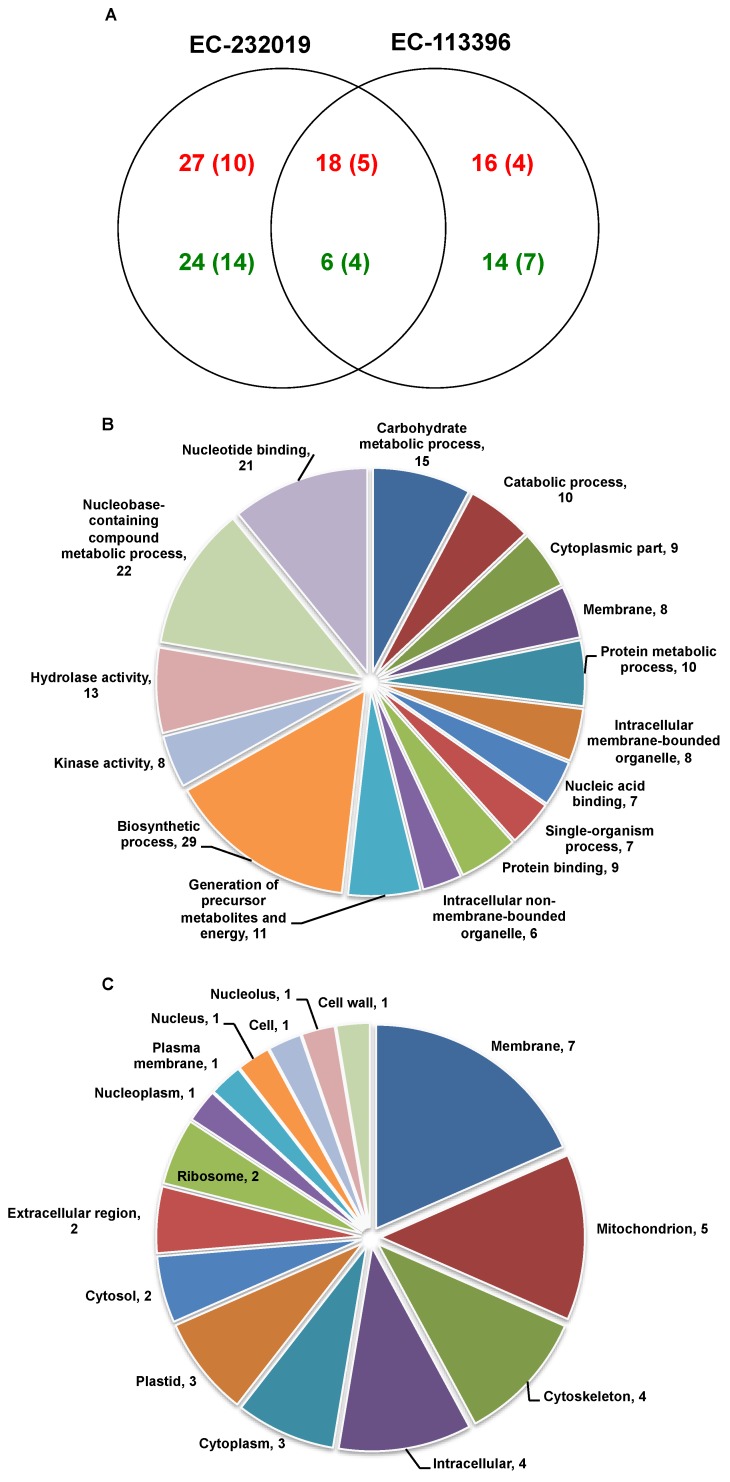
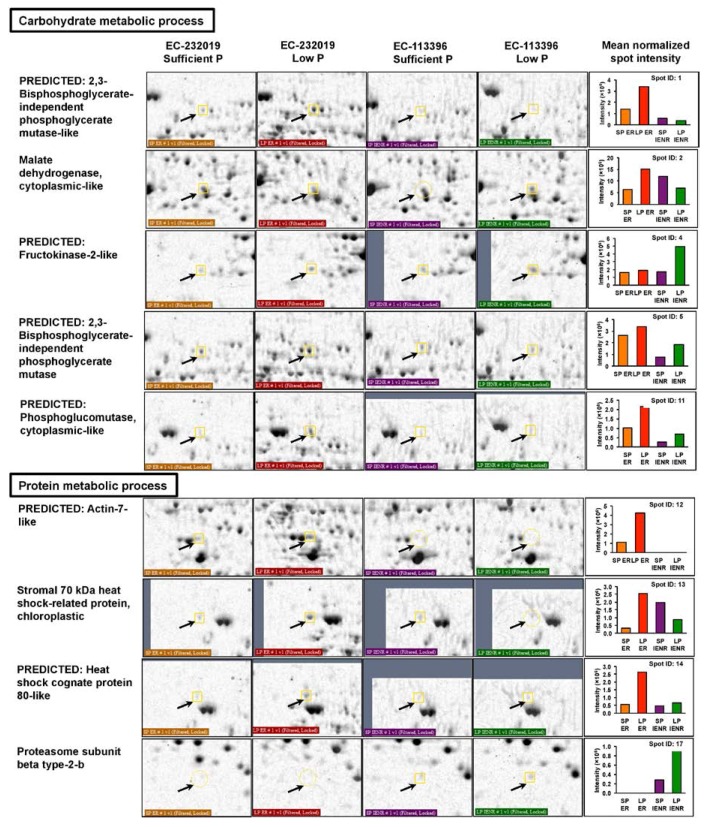
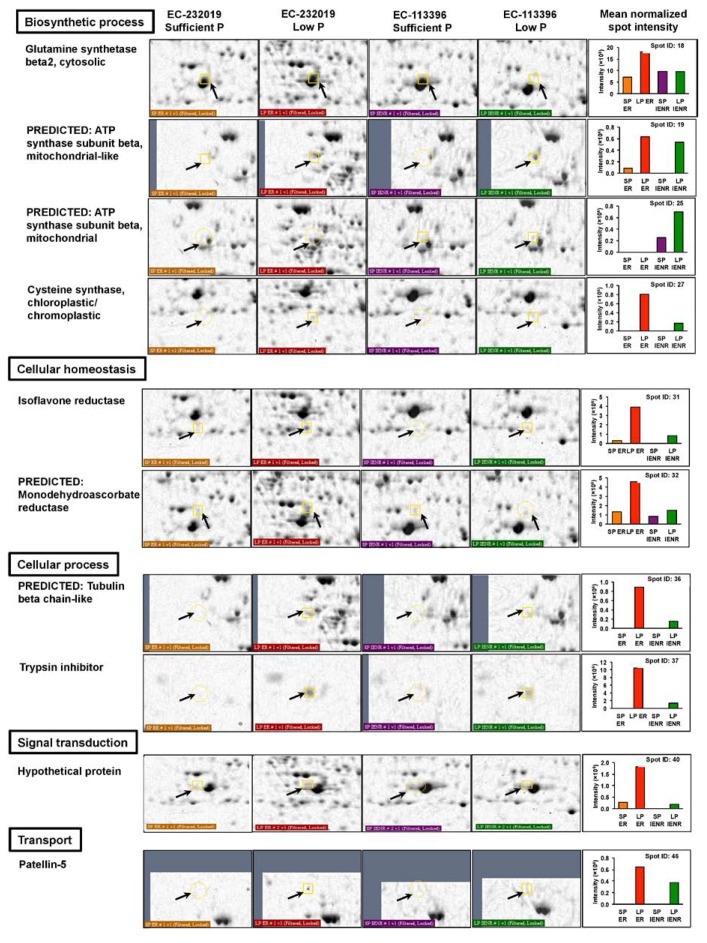
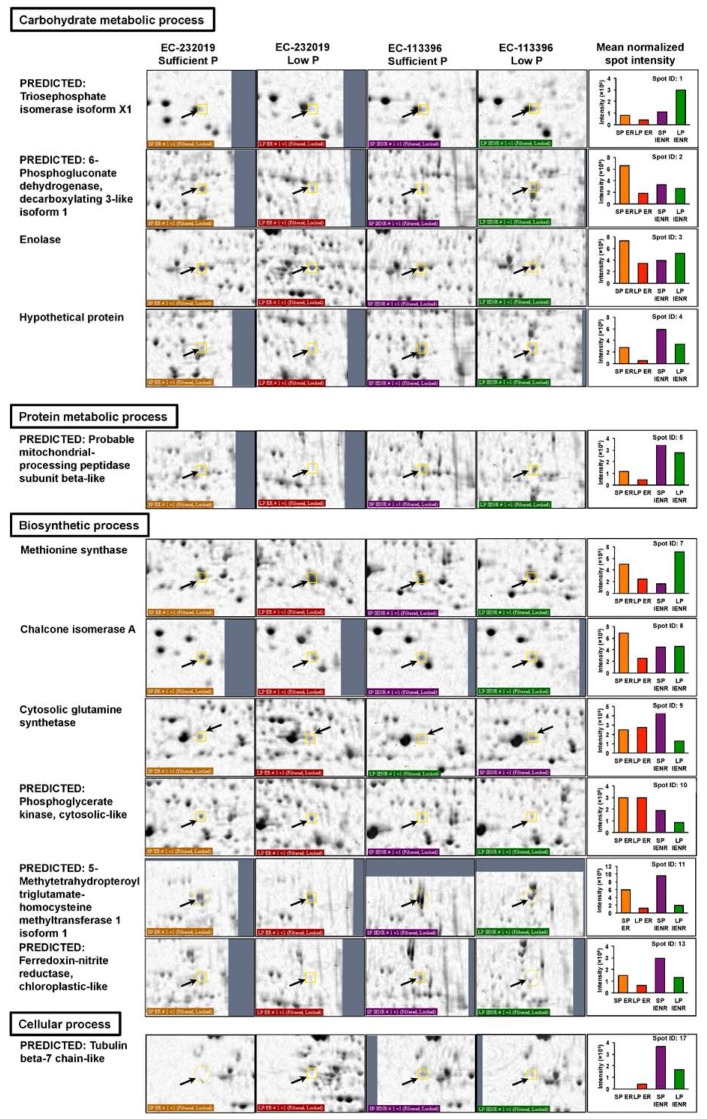
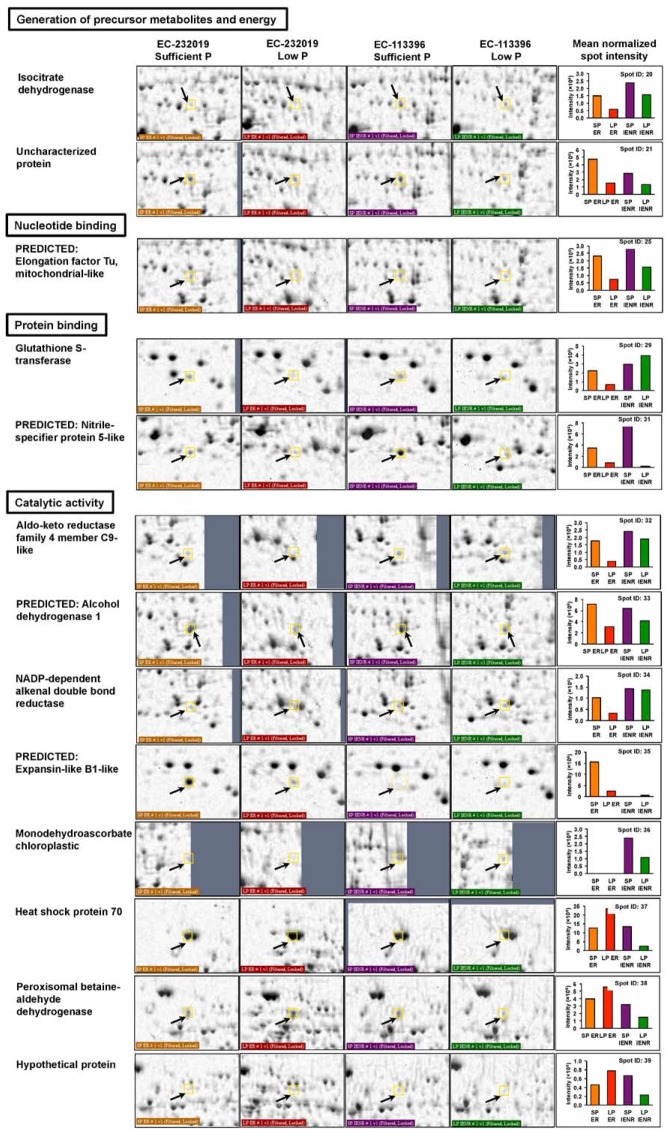
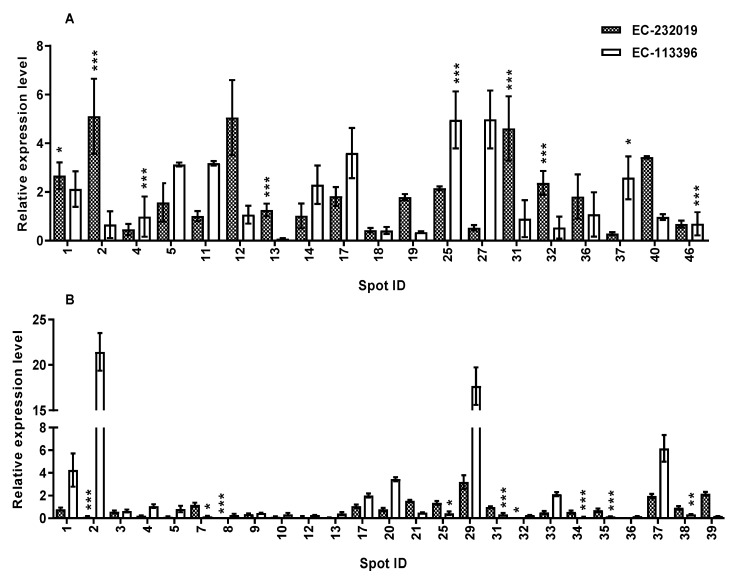
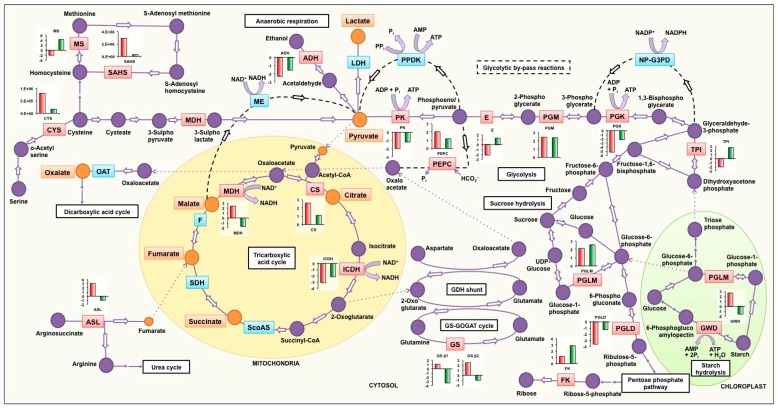
Carboxylate efflux from roots is a crucial and differential response of soybean genotypes to low phosphorus (P) stress. Exudation of carboxylic acids including oxalate, citrate, succinate and fumarate was induced under low P stress, particularly in P-efficient soybean genotypes. Enhancement of root length, surface area and volume further improved P acquisition under low P stress. To understand the molecular basis of carboxylate efflux under low P stress, the root proteome of contrasting genotypes (P-efficient: EC-232019 and P-inefficient: EC-113396) was compared. Among a total of 325 spots, 105 (32%) were differentially abundant proteins (DAPs) between sufficient (250 µM) and low P (4 µM) levels. Abundance of 44 (14%) proteins decreased by more than two-fold under low P stress, while 61 (19%) proteins increased by more than two-fold. Protein identification and annotation revealed that the DAPs were involved in a myriad of functions including carboxylic acid synthesis, carbohydrate, protein and lipid metabolism. Proteins with significant abundance included malate dehydrogenase, isocitrate dehydrogenase, phosphoglucomutase, phosphoglycerate mutase, fructokinase, enolase, phosphoglycerate kinase, triosephosphate isomerase, alcohol dehydrogenase, glucan water dikinase, glutamine synthetase and argininosuccinate lyase. Inferences from proteomic analysis suggests the crosstalk between various metabolic pathways implicated in conferring superior P acquisition efficiency under stress.
Keywords: Glycine max; carboxylate efflux; gene expression analysis; mass spectrometry; phosphorus stress; root proteome; two-dimensional gel electrophoresis.
Conflict of interest statement
The authors declare no conflict of interest. The funding sponsors had no role in the design of the study; in the collection, analyses, or interpretation of data; in the writing of the manuscript, and in the decision to publish the results.
Figures
Similar articles
-
Root exudation potential in contrasting soybean genotypes in response to low soil phosphorus availability is determined by photo-biochemical processes.Plant Physiol Biochem. 2018 Mar;124:1-9. doi: 10.1016/j.plaphy.2018.01.002. Epub 2018 Jan 4. Plant Physiol Biochem. 2018. PMID: 29309926
-
Root carboxylate exudation capacity under phosphorus stress does not improve grain yield in green gram.Plant Cell Rep. 2014 Jun;33(6):919-28. doi: 10.1007/s00299-014-1570-2. Epub 2014 Feb 4. Plant Cell Rep. 2014. PMID: 24493254
-
Phosphorus and aluminum interactions in soybean in relation to aluminum tolerance. Exudation of specific organic acids from different regions of the intact root system.Plant Physiol. 2006 Jun;141(2):674-84. doi: 10.1104/pp.105.076497. Epub 2006 Apr 28. Plant Physiol. 2006. PMID: 16648222 Free PMC article.
-
Proteomic and comparative genomic analysis reveals adaptability of Brassica napus to phosphorus-deficient stress.J Proteomics. 2015 Mar 18;117:106-19. doi: 10.1016/j.jprot.2015.01.012. Epub 2015 Jan 30. J Proteomics. 2015. PMID: 25644742
-
Genotypic Differences in Phosphorus Efficiency and the Performance of Physiological Characteristics in Response to Low Phosphorus Stress of Soybean in Southwest of China.Front Plant Sci. 2016 Nov 24;7:1776. doi: 10.3389/fpls.2016.01776. eCollection 2016. Front Plant Sci. 2016. PMID: 27933086 Free PMC article.
Cited by
-
Phosphorus Application Enhances Root Traits, Root Exudation, Phosphorus Use Efficiency, and Seed Yield of Soybean Genotypes.Plants (Basel). 2023 Mar 1;12(5):1110. doi: 10.3390/plants12051110. Plants (Basel). 2023. PMID: 36903971 Free PMC article.
-
Physiological and Biochemical Responses of Cucumis melo L. Chloroplasts to Low-Phosphate Stress.Front Plant Sci. 2018 Oct 22;9:1525. doi: 10.3389/fpls.2018.01525. eCollection 2018. Front Plant Sci. 2018. PMID: 30405663 Free PMC article.
-
Multi-omics analysis of the regulatory effects of low-phosphorus stress on phosphorus transport in soybean roots.Front Plant Sci. 2022 Sep 2;13:992036. doi: 10.3389/fpls.2022.992036. eCollection 2022. Front Plant Sci. 2022. PMID: 36119614 Free PMC article.
-
Proteome Mapping of South African Cassava Mosaic Virus-Infected Susceptible and Tolerant Landraces of Cassava.Proteomes. 2021 Oct 23;9(4):41. doi: 10.3390/proteomes9040041. Proteomes. 2021. PMID: 34842800 Free PMC article.
-
GmSPX8, a nodule-localized regulator confers nodule development and nitrogen fixation under phosphorus starvation in soybean.BMC Plant Biol. 2022 Apr 1;22(1):161. doi: 10.1186/s12870-022-03556-2. BMC Plant Biol. 2022. PMID: 35365088 Free PMC article.
References
-
- Jones D.L., Dennis P.G., Owen A.G., van Hees P.A.W. Organic acid behavior in soils—Misconceptions and knowledge gaps. Plant Soil. 2003;248:31–41. doi: 10.1023/A:1022304332313. - DOI
-
- Neumann G., Romheld V. The release of root exudates as affected by the plant physiological status. In: Pinton R., Varanini Z., Nannipieri Z., editors. The Rhizosphere: Biochemistry and Organic Substances at the Soil-Plant Interface. CRC Press; Boca Raton, FL, USA: 2007. pp. 23–71.
LinkOut - more resources
Full Text Sources
Other Literature Sources
