. 2018 Feb 28;46(4):e22.
doi: 10.1093/nar/gkx1206.

Efficient in situ barcode sequencing using padlock probe-based BaristaSeq

Affiliations

Efficient in situ barcode sequencing using padlock probe-based BaristaSeq

Xiaoyin Chen et al. Nucleic Acids Res. .

Abstract

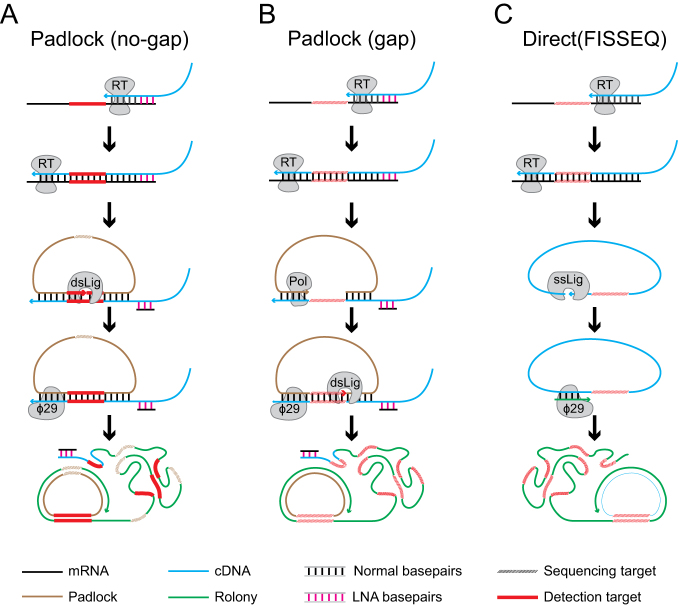
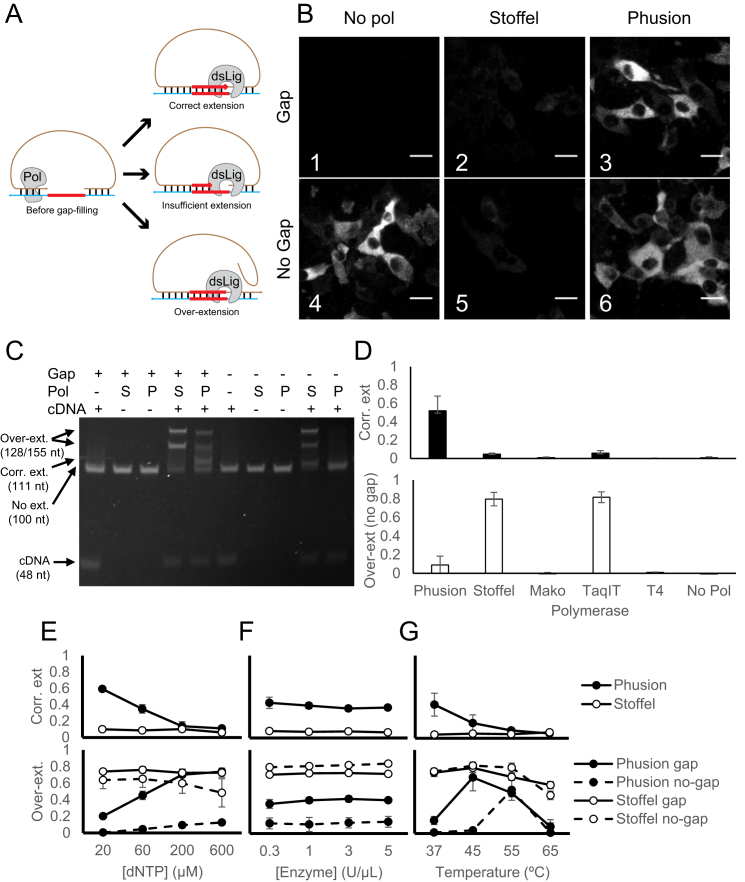
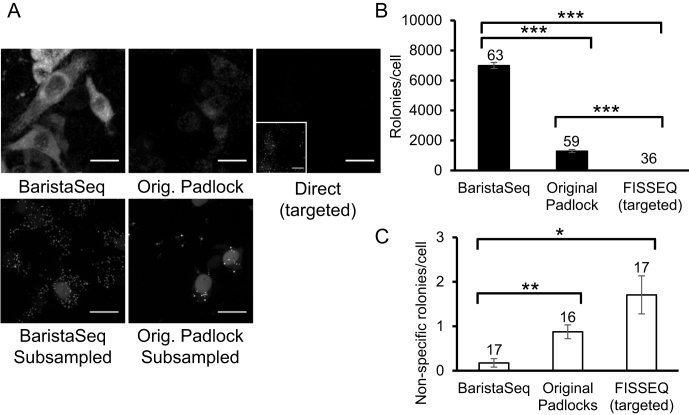
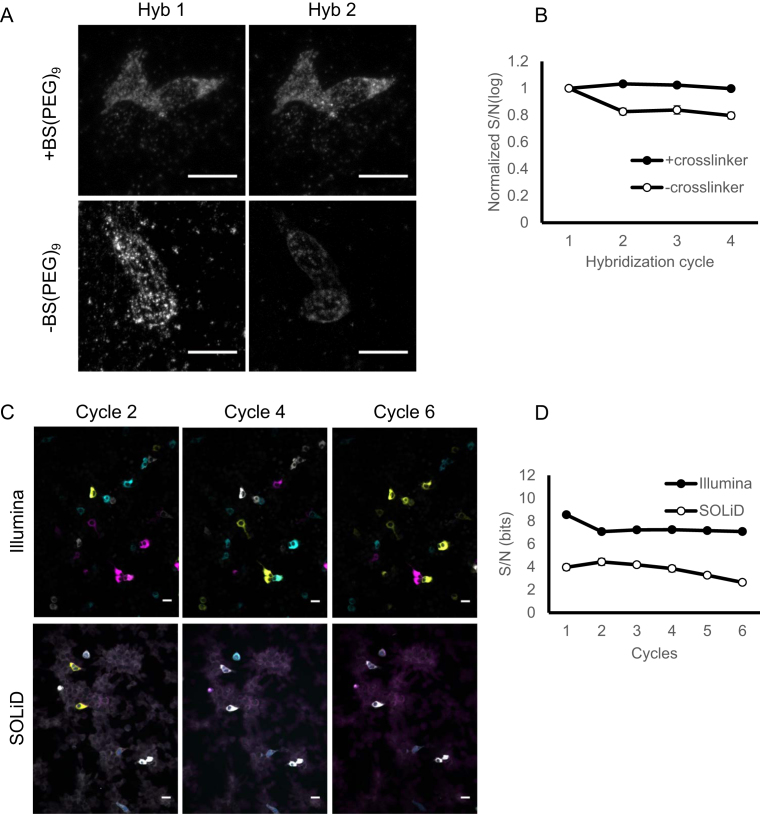
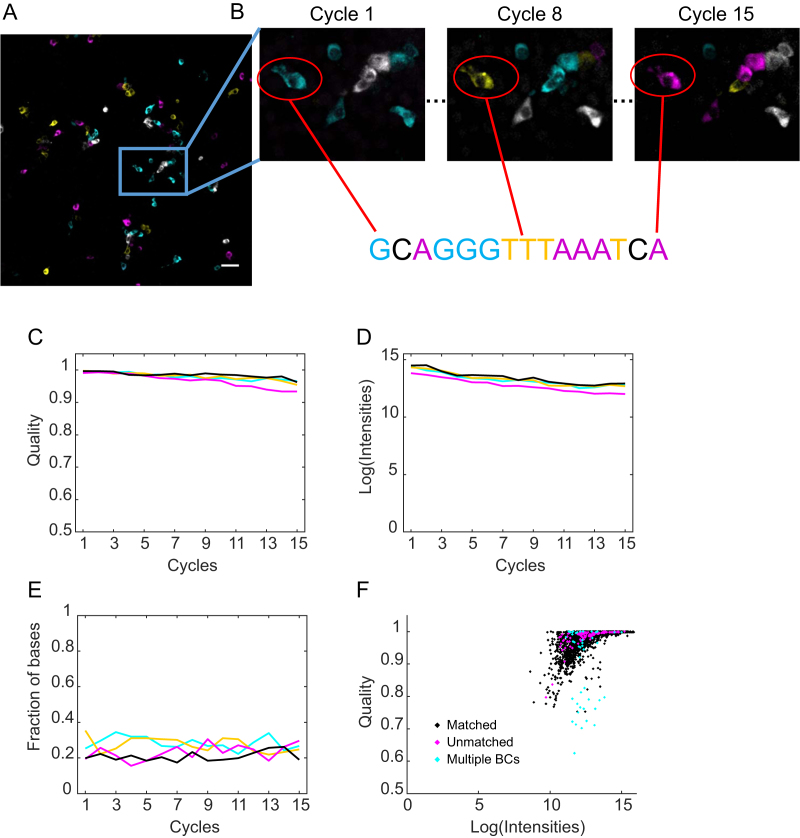
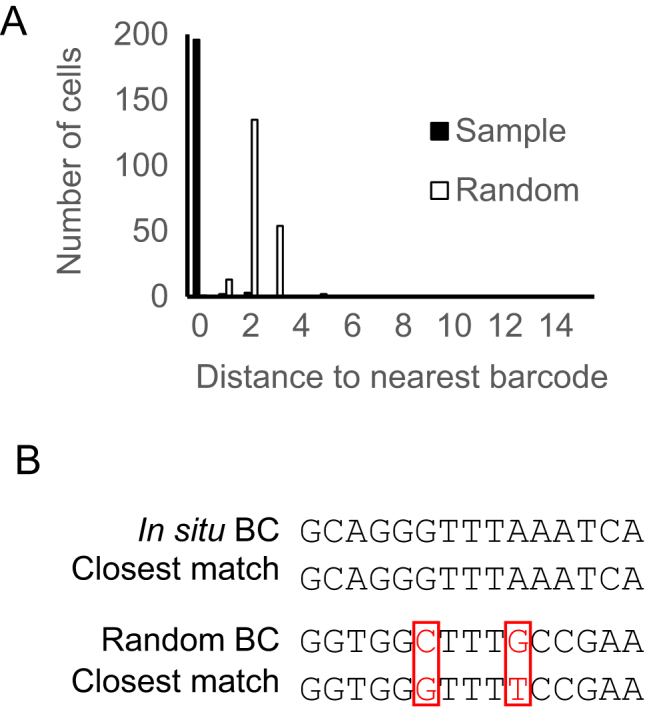
Cellular DNA/RNA tags (barcodes) allow for multiplexed cell lineage tracing and neuronal projection mapping with cellular resolution. Conventional approaches to reading out cellular barcodes trade off spatial resolution with throughput. Bulk sequencing achieves high throughput but sacrifices spatial resolution, whereas manual cell picking has low throughput. In situ sequencing could potentially achieve both high spatial resolution and high throughput, but current in situ sequencing techniques are inefficient at reading out cellular barcodes. Here we describe BaristaSeq, an optimization of a targeted, padlock probe-based technique for in situ barcode sequencing compatible with Illumina sequencing chemistry. BaristaSeq results in a five-fold increase in amplification efficiency, with a sequencing accuracy of at least 97%. BaristaSeq could be used for barcode-assisted lineage tracing, and to map long-range neuronal projections.


Figures

Figure 1.
Figure 1.
Comparison of in situ sequencing methods. In the padlock probe-based method without gap-filling (A), the RNA is reverse transcribed with an LNA primer (magenta) to produce a cDNA containing the sequence of interest (red). A padlock probe (yellow) containing a barcode (dashed) corresponding to the mRNA identity is hybridized onto the resulting cDNA and circularized with a double stranded DNA ligase. The circularized padlock probe is then used as a template for RCA and the barcode is sequenced in situ. In the padlock probe-based method with gap-filling (B), the two padlock arms hybridizes to the sequences flanking the area to be sequenced (red dashed). The padlock probe is then gap-filled with a DNA polymerase first, followed by circularization and RCA. In the direct-ligation based FISSEQ method (C), the RNA (black) containing the sequence of interest (red) is reverse transcribed, and the resulting cDNA (blue) is circularized with a single stranded DNA ligase. The circularized single stranded cDNA is then used as a template for rolling circle amplification (RCA) to generate a rolony (green).
Figure 2.
Figure 2.
Optimization of gap-filling in in situ barcode sequencing. (A) Illustrations of normal (top) and aberrant gap-filling products caused by insufficient gap-filling (middle) and overextension (bottom). (B) In situ barcode amplification in infected BHK cells with padlock probes that require (gap) or do not require (no gap) gap-filling using the indicated polymerases. Scale bars = 20 μm. (C) In vitro gap-filling assay performed on padlocks that require (+ gap) or do not require (– gap) gap-filling using no polymerase (–), the Stoffel fragment (S) or Phusion DNA polymerase (P) in the presence (+ cDNA) or absence (– cDNA) of a cDNA template. Arrows on the left, from top to bottom, indicate positions for strand displaced gap-filling product, correct gap-filling product for ‘+ Gap’ padlock, pre-gapfilling padlock, and the cDNA template. (D) The means and SEMs of the fraction of the correct gap-filling product using the gap padlock (top, black bars) and the fraction of over-extended products using the no-gap padlock (bottom, white bars) with the indicated polymerases. N = 3 for all enzymes. (EG) The means and SEMs of the faction of correct gap-filling product using the gap padlock (top) and the fraction of over-extended products (bottom) using either the gap padlock (solid lines) or the no-gap padlock (dashed lines) with either Phusion DNA polymerase (black dots) or the Stoffel fragment (white dots). The reactions were performed with the indicated dNTP concentrations (E), with the indicated enzyme concentrations (F), or at the indicated temperature (G). N = 3 for each condition in (E) and (F) and N = 4 for each condition in (G).
Figure 3.
Figure 3.
Quantification of rolony formation using BaristaSeq. (A) Top row: representative images of barcode amplicons in BHK cells using the indicated methods. Inset in the top right image shows the same image with 20× gain during post-processing. Bottom row: representative images of barcode amplicons in BHK cells with 100× subsampling. One in ∼100 rolonies were visualized in these images. Scale bars = 20 μm. (B and C) Average number of barcode amplicons per cell using the indicated methods in BHK cells with (B) or without (C) Sindbis virus. Error bars indicate SEM. *P = 0.01, **P < 0.005, ***P < 0.0005 after Bonferroni correction. The numbers of cells counted are indicated on top of each bar. Quantification for both padlock approaches were done using subsampling.
Figure 4.
Figure 4.
Improving in situ barcode amplification for sequencing. (A) Barcode amplicons with (+) or without (–) the post-RCA crosslinking before (Hyb 1) and after (Hyb 2) stripping with formamide and reprobing with a fluorescent probe. Scale bars = 20 μm. (B) Mean S/N ratios of rolonies during several hybridization cycles with (+) or without (–) BS(PEG)9 crosslinking after RCA. Error bars indicate SEM. N = 3 biological replicates. (C) Representative images of in situ barcode sequencing images using Illumina (top row) sequencing or SOLiD (bottom row) in BHK cells. The images were median filtered, but did not go through background subtraction. Scale bars = 20 μm. (D) Comparison of S/N ratio for SOLiD sequencing and Illumina sequencing over six cycles.
Figure 5.
Figure 5.
BaristaSeq in barcoded BHK cells. (A) Representative sequencing image of the first cycle. Scale bar = 50 μm. (B) Sequencing images of cycle 1, cycle 8 and cycle 15 of the indicated area from (A). The circled cell is basecalled below the images. (C) The intensity of the four channels, (D) fraction of the four bases and (E) the quality of the base calls are shown over 15 cycles of Illumina sequencing in situ. (F) Quality of base calls and the intensity of the called channel for individual base calls. Black indicates correct base calls; magenta indicates base calls from in situ reads that did not match to in vitro reads; cyan indicates base calls from cells expressing more than one barcode.
Figure 6.
Figure 6.
Comparison of BaristaSeq reads to conventional Illumina sequencing reads. (A) Histogram of the number of mismatches between the in situ reads and their closest matches from in vitro reads (Sample) and the number of mismatches between random sequences and their closest matches from in vitro reads (Random). (B) Examples of a barcode read in situ and its closest match in vitro, and a random sequence and its closest match in vitro. Red indicates mismatches.

References

    1. Walsh C., Cepko C.L.. Widespread dispersion of neuronal clones across functional regions of the cerebral cortex. Science. 1992; 255:434–440. - PubMed
    1. Walsh C., Cepko C.L.. Clonal dispersion in proliferative layers of developing cerebral cortex. Nature. 1993; 362:632–635. - PubMed
    1. Mayer C., Jaglin X.H., Cobbs L.V., Bandler R.C., Streicher C., Cepko C.L., Hippenmeyer S., Fishell G.. Clonally related forebrain interneurons disperse broadly across both functional areas and structural boundaries. Neuron. 2015; 87:989–998. - PMC - PubMed
    1. Harwell C.C., Fuentealba L.C., Gonzalez-Cerrillo A., Parker P.R., Gertz C.C., Mazzola E., Garcia M.T., Alvarez-Buylla A., Cepko C.L., Kriegstein A.R.. Wide dispersion and diversity of clonally related inhibitory interneurons. Neuron. 2015; 87:999–1007. - PMC - PubMed
    1. McKenna A., Findlay G.M., Gagnon J.A., Horwitz M.S., Schier A.F., Shendure J.. Whole-organism lineage tracing by combinatorial and cumulative genome editing. Science. 2016; 353:aaf7907. - PMC - PubMed

Publication types