

Using systems science to understand the determinants of inequities in healthy eating
- PMID: 29190662
- PMCID: PMC5708780
- DOI: 10.1371/journal.pone.0188872
Using systems science to understand the determinants of inequities in healthy eating
Abstract
Introduction: Systems thinking has emerged in recent years as a promising approach to understanding and acting on the prevention and amelioration of non-communicable disease. However, the evidence on inequities in non-communicable diseases and their risks factors, particularly diet, has not been examined from a systems perspective. We report on an approach to developing a system oriented policy actor perspective on the multiple causes of inequities in healthy eating.
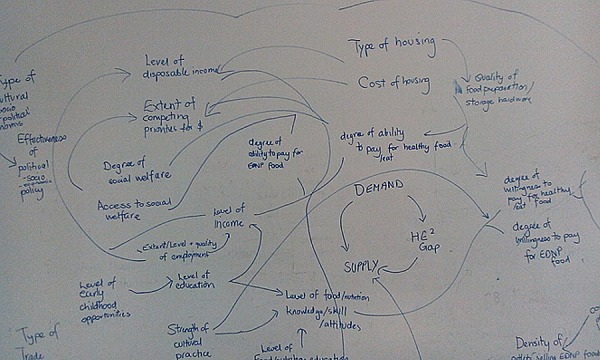
Methods: Collaborative conceptual modelling workshops were held in 2015 with an expert group of representatives from government, non-government health organisations and academia in Australia. The expert group built a systems model using a system dynamics theoretical perspective. The model developed from individual mind maps to pair blended maps, before being finalised as a causal loop diagram.
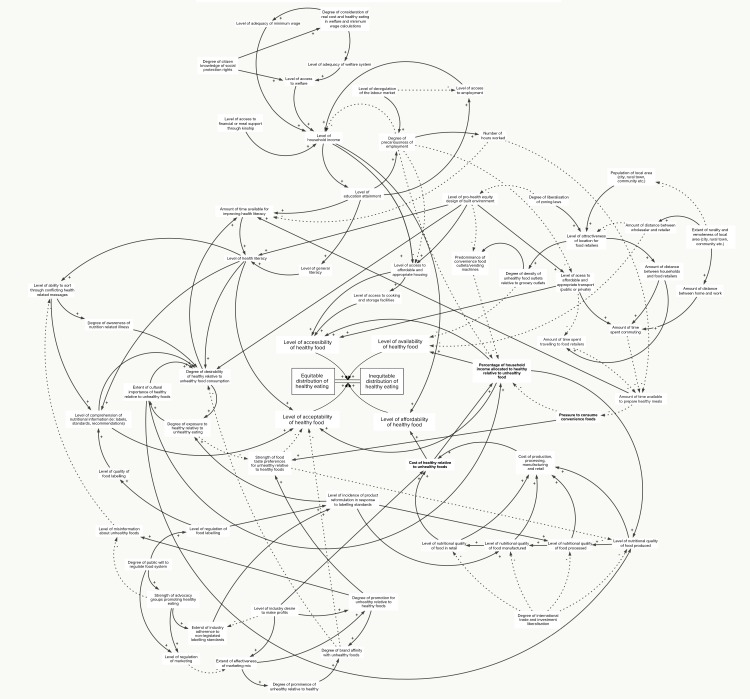
Results: The work of the expert stakeholders generated a comprehensive causal loop diagram of the determinants of inequity in healthy eating (the HE2 Diagram). This complex dynamic system has seven sub-systems: (1) food supply and environment; (2) transport; (3) housing and the built environment; (4) employment; (5) social protection; (6) health literacy; and (7) food preferences.
Discussion: The HE2 causal loop diagram illustrates the complexity of determinants of inequities in healthy eating. This approach, both the process of construction and the final visualisation, can provide the basis for planning the prevention and amelioration of inequities in healthy eating that engages with multiple levels of causes and existing policies and programs.
Conflict of interest statement
Figures


References
-
- Rickles D, Hawe P, Shiell A. A simple guide to chaos and complexity. Journal of epidemiology and community health. 2007;61(11):933–7. doi: 10.1136/jech.2006.054254 - DOI - PMC - PubMed
-
- Bar-Yam Y. Improving the effectiveness of health care and public health: a multiscale complex systems analysis. American Journal of Public Health. 2006;96(3):459–66. doi: 10.2105/AJPH.2005.064444 - DOI - PMC - PubMed
-
- Ba Swinburn, Sacks G, Hall KD, McPherson K, Finegood DT, Moodie ML, et al. The global obesity pandemic: shaped by global drivers and local environments. Lancet. 2011;378(9793):804–14. doi: 10.1016/S0140-6736(11)60813-1 - DOI - PubMed
-
- Friel S, Hattersley L, Ford L, O'Rourke K. Addressing inequities in healthy eating. Health Promotion International. 2015;30(suppl 2):ii77–ii88. - PubMed
MeSH terms
LinkOut - more resources
Full Text Sources
Other Literature Sources
