. 2017 Nov 30;15(11):e2003213.
doi: 10.1371/journal.pbio.2003213. eCollection 2017 Nov.

Evaluation of RNAi and CRISPR technologies by large-scale gene expression profiling in the Connectivity Map

Affiliations

Evaluation of RNAi and CRISPR technologies by large-scale gene expression profiling in the Connectivity Map

Ian Smith et al. PLoS Biol. .

Abstract

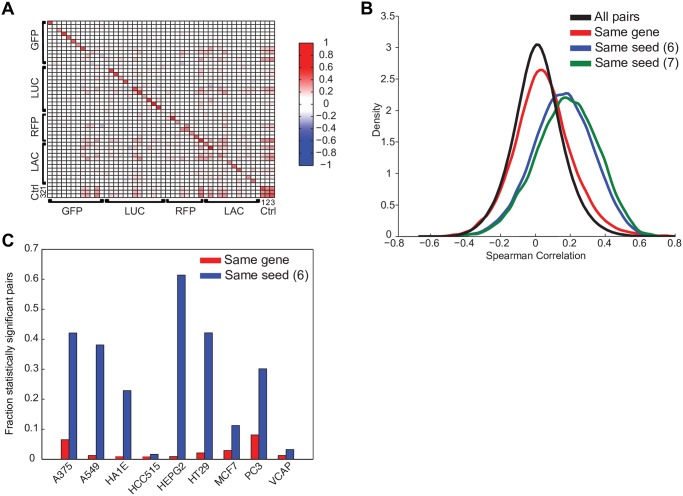
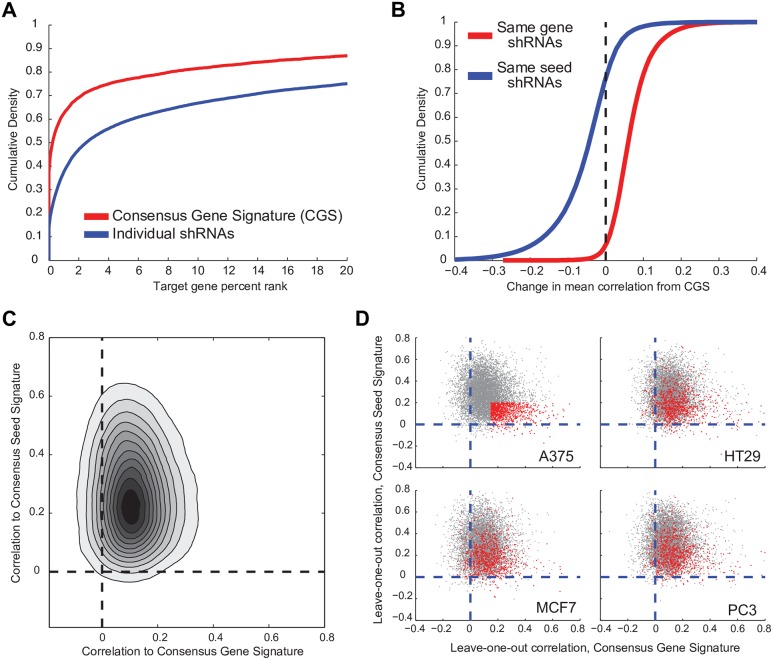
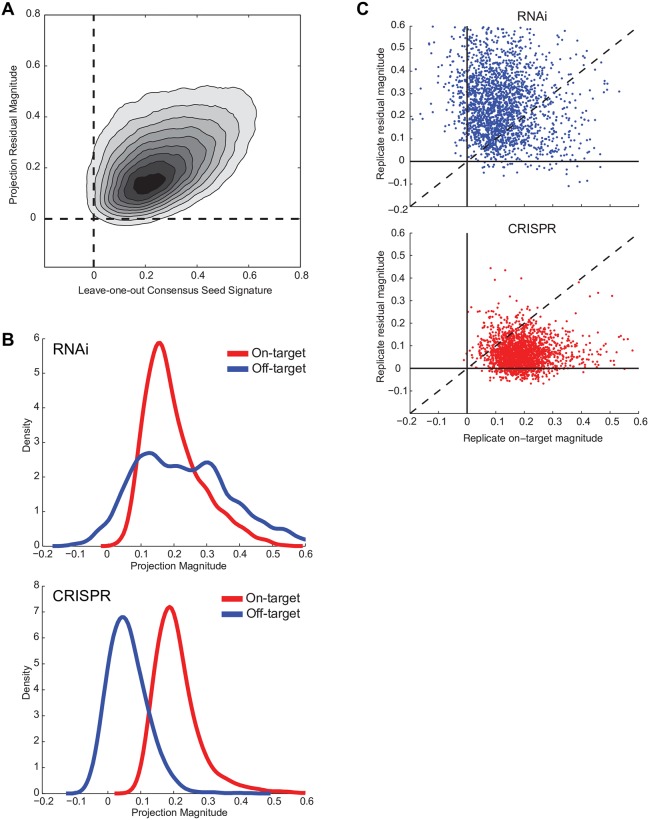
The application of RNA interference (RNAi) to mammalian cells has provided the means to perform phenotypic screens to determine the functions of genes. Although RNAi has revolutionized loss-of-function genetic experiments, it has been difficult to systematically assess the prevalence and consequences of off-target effects. The Connectivity Map (CMAP) represents an unprecedented resource to study the gene expression consequences of expressing short hairpin RNAs (shRNAs). Analysis of signatures for over 13,000 shRNAs applied in 9 cell lines revealed that microRNA (miRNA)-like off-target effects of RNAi are far stronger and more pervasive than generally appreciated. We show that mitigating off-target effects is feasible in these datasets via computational methodologies to produce a consensus gene signature (CGS). In addition, we compared RNAi technology to clustered regularly interspaced short palindromic repeat (CRISPR)-based knockout by analysis of 373 single guide RNAs (sgRNAs) in 6 cells lines and show that the on-target efficacies are comparable, but CRISPR technology is far less susceptible to systematic off-target effects. These results will help guide the proper use and analysis of loss-of-function reagents for the determination of gene function.


Conflict of interest statement

We have read the journal's policy and the authors of this manuscript have the following competing interests: A.S. is a shareholder of Genometry, Inc.

Figures

Fig 1
Fig 1. RNAi reagents have widespread off-target effects.
(A) Heat map of Spearman correlations among pairs of shRNAs targeting control genes. Correlation on the diagonal reveals a gene expression signal that is reproducible and specific to each shRNA, despite the absence of a target. Control genes are labeled as follows: GFP, LUC, RFP, and LAC. Additional control treatments are grouped under Ctrl; 1: pgw, a lentivirus with no U6 promoter and no shRNA; 2: empty_vector, a lentivirus with a run of 5 thymidines immediately after the U6 promoter, to terminate transcription; 3: UnTrt, wells that did not receive any lentivirus. (B) Distribution of pairwise correlations of shRNA signatures with the same gene target, the same 6- and 7-mer seed sequence, and all pairs of shRNAs. Data shown are from HT29 cells. Pairs of shRNAs with the same seed correlate much better than those with the same gene, which correlate only marginally better than random pairs. (C) The fraction of pairs of shRNA signatures with the same target gene (red) or the same 6-mer seed (blue) that are statistically significant (q < 0.25) in each cell line. In all cell lines, correlation due to seed is more often significant than correlation due to gene. See S2 Data. Ctrl, control; GFP, green fluorescent protein; LAC, beta-galactosidase; LUC, firefly luciferase; pgw, puromycin-GFP-WPRE; RFP, red fluorescence protein; RNAi, RNA interference; shRNA, short hairpin RNA; U6, human U6 polymerase III promoter; UnTrt, untreated.
Fig 2
Fig 2. CGSs and investigation of PC1.
(A) Schematic of the weighted average procedure for combining individual shRNA signatures targeting the same gene into a CGS. The shRNAs are weighted by the sum of their correlations to other same-gene shRNAs and then averaged. (B) CGSs made from random groups of shRNAs show increasing variance of Spearman correlation with larger numbers of component shRNAs. Because these are random groups, there should not be a consistent signal; the increasing probability of very large correlations reveals a spurious signal that we attribute to the PC1 of the data. (C) Comparison of the fraction of variance explained by PC1 for either CMAP build 02, which used Affymetrix arrays to profile small molecules [1], or the expansion of CMAP, which uses L1000 technology [5] with different types of perturbation. Level 5 data were used. The shRNA CGS has a notably larger PC1. See S3 Data. (D) Pearson correlation of PC1 across RNA measurement platforms and perturbation types in level 5 data. (E) For genes with 6 or more shRNAs, a fraction of statistically significant holdout results at different q-value-corrected false discovery rate thresholds, comparing PC1 retained or PC1 removed. Analysis was performed separately for each cell line and data for all cell lines are shown as a single distribution. Because holdout analysis combines multiple shRNA signatures, removal of PC1 decreases the background caused by the general increase in correlations shown in panel (B) and thus improves the performance of this particular analysis. (F) Removal of PC1 does not diminish the magnitude of the seed effect. After removal of PC1, distribution of pairwise Spearman correlations in HT29 (as a representative cell line) for pairs of shRNAs with the same gene target, the same 6- and 7-mer seed sequence, and all pairs of shRNAs. Compare to Fig 1C. (G) Effect of PC1 of CMAP queries. For small molecules previously profiled in CMAP build 02 by Affymetrix technology, the rank of the matched compound when queried against small molecule L1000 data, with either PC1 retained or removed. CGS, consensus gene signature; CMAP, Connectivity Map; PC1, first principal component; shRNA, short hairpin RNA.
Fig 3
Fig 3. CGS enhances on-target signal and mitigates off-target effects.
(A) For directly-measured landmark transcripts targeted by RNAi, cumulative distribution of the rank of that transcript in the resulting signature when using either the signature produced by an individual shRNA or the CGS. (B) Cumulative distribution plot of the change in the correlation to the CGS for either individual shRNAs that target the gene or for shRNAs that share the same seed as one of the shRNAs that contributed to the CGS. (C) For individual leave-one-out shRNAs, comparison of the correlation to the CGS and the analogous CSS. The density color scale is linear. (D) Comparison of on- and off-target activity across cell lines. Top left: for each shRNA in A375 cells, the plot shows the correlation between CGS (x-axis) and CSS (y-axis). Those in red have minimal off-target effects (CSS Spearman correlation <|0.2|) and substantial on-target effects (CGS Spearman correlation >0.15). Remaining panels: the red-highlight shRNAs from A375 cells are highlighted in red in 3 other cell lines. CSS, consensus seed signature; CGS, consensus gene signature; RNAi, RNA interference; shRNA, short hairpin RNA.
Fig 4
Fig 4. Gene expression analysis of CRISPR-Cas9 reagents.
(A) Analysis of landmark transcript reduction, comparing CRISPR and RNAi for genes targeted by both technologies. The dotted line (blue) is a null distribution of the set of all z-scores. Both technologies show significant down-regulation of directly measured target transcripts. (B) As in Fig 2E, comparison of holdout results either retaining or removing PC1 for the CRISPR dataset. (C) Holdout analysis for genes assayed by CRISPR (left) and RNAi (right). Genes are shown for RNAi only if they were also assayed by CRISPR; furthermore, because holdout analysis requires at least 6 independent reagents, not all of the genes assayed by CRISPR have sufficient coverage by RNAi; missing values in some cell lines are indicated by black boxes. Smaller q-values (green) indicate greater statistical significance, i.e., that the CGS is valid. See S6 Data. Cas9, CRISPR-associated 9; CGS, consensus gene signature; CRISPR, clustered regularly interspaced short palindromic repeat; PC1, first principal component; RNAi, RNA interference.
Fig 5
Fig 5. Decomposition by projection.
(A) For shRNAs, the magnitude of the off-target effect comparing the leave-one-out CSS to projection. Pearson correlation coefficient = 0.43. (B) For individual shRNAs (top) and sgRNAs (bottom), in which the on-target magnitude passes FDR < 25%, distribution of on- and off-target magnitudes, as assessed by projection decomposition. (C) Scatter plots of on-target and off-target projection magnitudes for RNAi (top) and CRISPR (bottom) for all of the signatures of reagents in the dataset. While the 2 technologies show similar on-target activities, RNAi shows large off-target effects. CRISPR, clustered regularly interspaced short palindromic repeat; CSS, consensus seed signature; FDR, false discovery rate; RNAi, RNA interference; sgRNA, single guide RNA; shRNA, short hairpin RNA.
Fig 6
Fig 6. CMAP queries for RNAi and CRISPR reagents.
(A) For all genes assessed by both CRISPR and RNAi technologies, the q-values for querying CMAP with the CRISPR CGS and its resulting connectivity to the RNAi CGS. See S7 Data. (B) Same as in (A), but only for genes passing holdout analysis (q-values < 0.25) by both technologies individually in a cell line, the q-values for connectivity. Holdout analysis q-values are plotted for each technology in the first 2 columns; connectivity q-values are plotted in the third column. See S7 Data. CGS, consensus gene signature; CMAP, Connectivity Map; CRISPR, clustered regularly interspaced short palindromic repeat; RNAi, RNA interference.

References

    1. Lamb J, Crawford ED, Peck D, Modell JW, Blat IC, Wrobel MJ, et al. The Connectivity Map: using gene-expression signatures to connect small molecules, genes, and disease. Science. American Association for the Advancement of Science; 2006;313: 1929–1935. doi: 10.1126/science.1132939 - DOI - PubMed
    1. Belcastro V, Siciliano V, Gregoretti F, Mithbaokar P, Dharmalingam G, Berlingieri S, et al. Transcriptional gene network inference from a massive dataset elucidates transcriptome organization and gene function. Nucleic Acids Research. 2011;39: 8677–8688. doi: 10.1093/nar/gkr593 - DOI - PMC - PubMed
    1. Wang Z, Monteiro CD, Jagodnik KM, Fernandez NF, Gundersen GW, Rouillard AD, et al. Extraction and analysis of signatures from the Gene Expression Omnibus by the crowd. Nature Communications. Nature Publishing Group; 2016;7: 12846 doi: 10.1038/ncomms12846 - DOI - PMC - PubMed
    1. Pirhaji L, Milani P, Leidl M, Curran T, Avila-Pacheco J, Clish CB, et al. Revealing disease-associated pathways by network integration of untargeted metabolomics. Nature Methods. Nature Research; 2016;13: 770–776. doi: 10.1038/nmeth.3940 - DOI - PMC - PubMed
    1. Subramanian A, Narayan R, Corsello SM, Peck DD, Natoli TE, Lu X, et al. A Next Generation Connectivity Map: L1000 Platform And The First 1,000,000 Profiles. bioRxiv. Cold Spring Harbor Labs Journals; 2017;: 136168 doi: 10.1101/136168 - DOI - PMC - PubMed

Publication types

Substances