. 2017 Nov 30;12(11):e0188036.
doi: 10.1371/journal.pone.0188036. eCollection 2017.

Premedical special master's programs increase USMLE STEP1 scores and improve residency placements

Affiliations

Premedical special master's programs increase USMLE STEP1 scores and improve residency placements

Bryan Johnson et al. PLoS One. .

Abstract

The effectiveness of Special Master's Programs (SMPs) in benefiting a potential medical student's career beyond admission into an MD-program is largely unknown. This study aims to evaluate the role of SMPs, if any, in affecting the performance and outcomes of students during their medical school career. This study analyzed anonymous surveys of students and residents from the University of Toledo. The data analysis is used to evaluate a student's academic performance before, during and after medical school. Measured metrics included: MCAT Scores, undergraduate GPA, USMLE STEP 1 scores, participation in research, number of research publications, and residency placement. Of 500 people surveyed 164 medical students or residents responded. Based on their responses, the respondents were divided into traditional (non-SMP) and SMP groups. As anticipated, MCAT scores (SMP: 29.82 vs. traditional 31.10) are significantly (p<0.05) different between the two groups. Interestingly, there is no significant difference in USMLE STEP 1 scores (SMP: 232.7 vs. traditional: 233.8) and when normalized relative to MCAT scores, USMLE STEP 1 scores for SMP-students are significantly (p<0.05) higher than their traditional counterparts (p<0.05). Additionally, SMP-students did not outperform the traditional students with regards to research publications. But, they did demonstrate a significant (p<0.05) proclivity towards surgical residencies when compared to the traditional students. Overall, our results highlight that SMPs potentiate USMLE STEP 1 performance and competitive residency-placements for its students.


Conflict of interest statement

Competing Interests: The authors have declared that no competing interests exist.

Figures

Fig 1
Fig 1
A. Comparative Analysis of MCAT Scores between SMP and Traditional Students. Unpaired T-Test shows that MCAT scores for incoming Traditional Students (mean = 31.1(0.2784 SEM), n = 87) are significantly higher (p<0.01) than incoming SMP Students (mean = 29.9 (0.3578), n = 56). B. Comparison of USMLE STEP 1 Scores between SMP and Traditional Students. Unpaired T Test shows that USMLE STEP 1 scores of SMP (mean = 232.7 (2.091 SEM), n = 54) and Traditional Students (mean = 233.8 (1.616 SEM), n = 82) are not significantly different. C. MCAT vs. USMLE STEP 1 Plot and Trends of SMP and Traditional Students. Linear regression analysis of MCAT and STEP 1 scores in SMP Students (slope = 2.126, r2 = 0.1473, n = 54) and Traditional Students (slope = 4.571, r2 = 0.5138, n = 77) shows that the trends for the two groups are significantly (p<0.01) different. D. Comparison of USMLE STEP 1 Scores, normalized to MCATS, between SMP and Traditional Students. Unpaired T test shows that MCAT-normalized, USMLE STEP 1 scores of SMP (mean = 7.77 (0.10 SEM), n = 54) and Traditional Students (mean = 7.51 (0.05 SEM), n = 77) are significantly (*p<0.02) different.
Fig 2
Fig 2
USMLE STEP 1 Scores Based on MCAT Groupings for Traditional (A) Students and SMP-students (B). Students were categorized into 5 groups based on MCAT scores (Group 1 = 26 and below; Group 2 = 27–29; Group 3 = 30–32; Group 4 = 33–35; Group 5 = 36 and above) and then further divided into SMP and Traditional students and comparative analysis was performed using One-way ANOVA with Tukey Kramer Post-hoc analysis. * = p<0.05 vs. traditional group 1; ✝ = p<0.05vs. traditional group 2.
Fig 3
Fig 3. Comparative analysis of USMLE STEP 1 scores relative to undergraduate GPAs of SMP students.
SMP students are categorized into 5 groups based on undergraduate GPA scores (Group 1 = 2.70–3.00, Group 2 = 3.00–3.33, Group 3 = 3.34–3.66, Group 4 = 3.67–4.00) and comparative analysis was performed using One-way ANOVA with Tukey Kramer Post-hoc analysis.
Fig 4
Fig 4
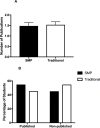
A. Comparative Analysis of Number of Publications between SMP and Traditional Students. Comparative analysis using an unpaired t test shows no significant difference in the number of publications produced by SMP (mean = 1.48 (0.16 SEM), n = 42) vs. Traditional Students (mean = 1.53 (0.14 SEM), n = 51). B. Comparative Analysis of Percentage of Published and Non-Published SMP and Traditional Students. Chi Square analysis of students with at least one publication shows no significant difference between SMP (54.84%, n = 62) and Traditional Students (45.26%, n = 95).
Fig 5
Fig 5. Comparative analysis of residency distribution between SMP and traditional students.
72 of the total 130 respondents reported being in a residency program. 25 were SMP-students and 47 were traditional students. Residency programs were classified into two categories: surgical subspecialties and non-surgical subspecialties. The surgical subspecialty category is comprised of orthopedic surgery, plastic surgery, general surgery, urology, obstetrics and gynecology, anesthesiology, and emergency medicine. The non-surgical subspecialty category is comprised of family medicine, pediatrics, pathology, internal medicine, psychiatry, radiology, neurology, and physical medicine and rehabilitation. Of the SMP respondents 17 (68%) were accepted into surgical subspecialties whereas 8 (32%) were accepted into non-surgical subspecialties. Of the traditional respondents 18 (38.3%) were accepted into surgical subspecialties and 29 (61.7%) were accepted into non-surgical subspecialties. Chi-squared analysis revealed this difference in distribution to be significant (p<0.02).

References

    1. Considering a Postbaccalaureate Premedical Program. AAMC Students, Applicants and Residents. 20 Sept 2015. Available from: https://students-residents.aamc.org/content/article/considering-postbacc....
    1. Simon, C. A Second Opinion: The Post-Baccalaureate. The New York Times. 15 Apr 2012 Available from: http://www.nytimes.com/2012/04/15/education/edlife/a-second-opinion-the-....
    1. Burnsed B. An Expensive, Alternative Route to Medical School. 25 Jul 2011 Available from: https://www.usnews.com/education/best-graduate-schools/articles/2011/07/....
    1. Epps AC. The Strategic Impact of a Post Baccalaureate Pre-medicine Intervention Program on Medical School Academic Performance. Journal of Health Care for the Poor and Underserved. 2015;26(1):8–20. doi: 10.1353/hpu.2015.0008 - DOI - PubMed
    1. McDougle L, Way D, Clinchot D. A National Long-term Outcomes Evaluation of U.S. Premedical Postbaccalaureate Programs Designed to Promote Health care Access and Workforce Diversity. Journal of Health Care for the Poor and Underserved. 2015;(3): 631 doi: 10.1353/hpu.2015.0088 - DOI - PMC - PubMed

MeSH terms