

Simulated ocean acidification reveals winners and losers in coastal phytoplankton
- PMID: 29190760
- PMCID: PMC5708705
- DOI: 10.1371/journal.pone.0188198
Simulated ocean acidification reveals winners and losers in coastal phytoplankton
Abstract
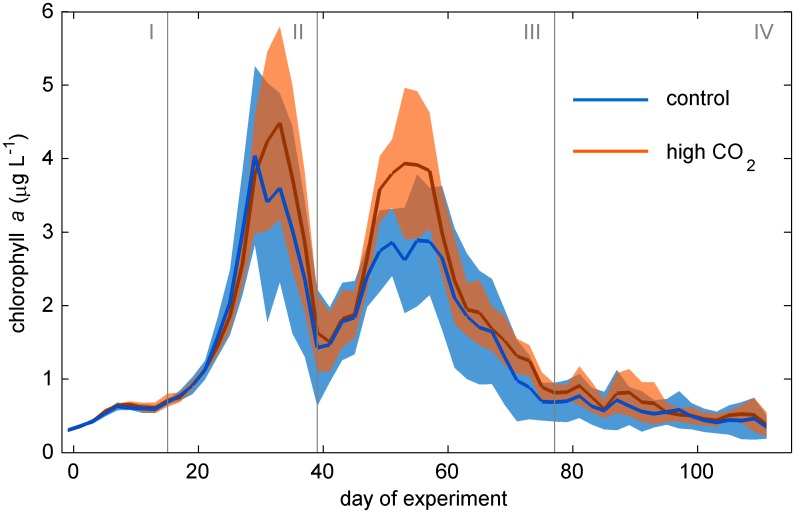
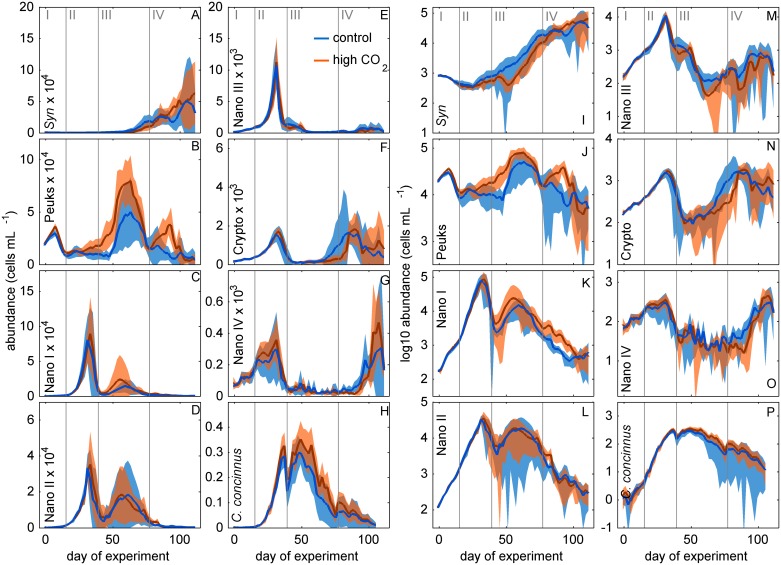
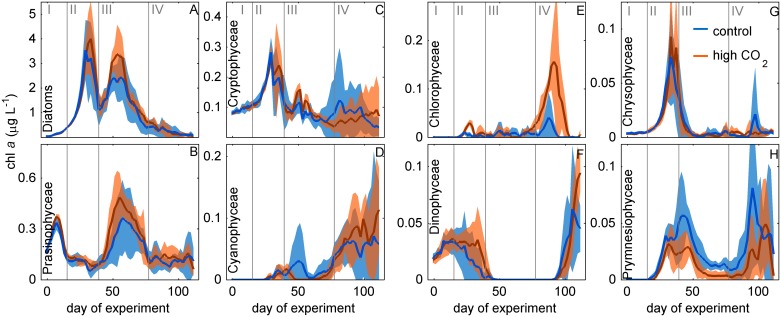
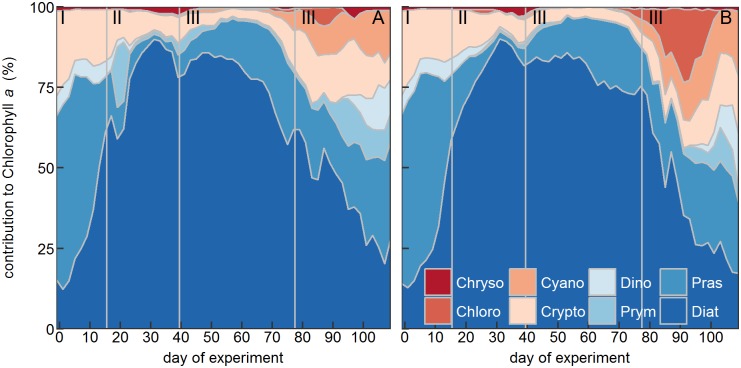
The oceans absorb ~25% of the annual anthropogenic CO2 emissions. This causes a shift in the marine carbonate chemistry termed ocean acidification (OA). OA is expected to influence metabolic processes in phytoplankton species but it is unclear how the combination of individual physiological changes alters the structure of entire phytoplankton communities. To investigate this, we deployed ten pelagic mesocosms (volume ~50 m3) for 113 days at the west coast of Sweden and simulated OA (pCO2 = 760 μatm) in five of them while the other five served as controls (380 μatm). We found: (1) Bulk chlorophyll a concentration and 10 out of 16 investigated phytoplankton groups were significantly and mostly positively affected by elevated CO2 concentrations. However, CO2 effects on abundance or biomass were generally subtle and present only during certain succession stages. (2) Some of the CO2-affected phytoplankton groups seemed to respond directly to altered carbonate chemistry (e.g. diatoms) while others (e.g. Synechococcus) were more likely to be indirectly affected through CO2 sensitive competitors or grazers. (3) Picoeukaryotic phytoplankton (0.2-2 μm) showed the clearest and relatively strong positive CO2 responses during several succession stages. We attribute this not only to a CO2 fertilization of their photosynthetic apparatus but also to an increased nutrient competitiveness under acidified (i.e. low pH) conditions. The stimulating influence of high CO2/low pH on picoeukaryote abundance observed in this experiment is strikingly consistent with results from previous studies, suggesting that picoeukaryotes are among the winners in a future ocean.
Conflict of interest statement
Figures
References
-
- Sommer U, Adrian R, De Senerpont Domis L, Elser JJ, Gaedke U, Ibelings B, et al. Beyond the Plankton Ecology Group (PEG) Model: Mechanisms Driving Plankton Succession. Annu Rev Ecol Evol Syst. 2012;43: 429–448. doi: 10.1146/annurev-ecolsys-110411-160251 - DOI
-
- Behrenfeld MJ. Abandoning Sverdrup’s Critical Depth Hypothesis on phytoplankton blooms. Ecology. 2010;91: 977–989. doi: 10.1890/09-1207.1 - DOI - PubMed
-
- Behrenfeld MJ, Boss ES. Resurrecting the ecological underpinnings of ocean plankton blooms. Ann Rev Mar Sci. 2014;6: 167–194. doi: 10.1146/annurev-marine-052913-021325 - DOI - PubMed
-
- Margalef R. Life-forms of phytoplankton as survival alternatives in an unstable environment. Oceanol Acta. 1978;1: 493–509.
-
- Lampert W, Fleckner W, Rai H, Taylor BE. Phytoplankton control by grazing zooplankton: A study on the spring clear-water phase. Limnol Oceanogr. 1986;31: 478–490. doi: 10.4319/lo.1986.31.3.0478 - DOI
MeSH terms
LinkOut - more resources
Full Text Sources
Other Literature Sources
