. 2017 Sep 21;8(54):91990-92003.
doi: 10.18632/oncotarget.21121. eCollection 2017 Nov 3.

LncRNA H19 is a major mediator of doxorubicin chemoresistance in breast cancer cells through a cullin4A-MDR1 pathway

Affiliations

LncRNA H19 is a major mediator of doxorubicin chemoresistance in breast cancer cells through a cullin4A-MDR1 pathway

Qiong-Ni Zhu et al. Oncotarget. .

Abstract

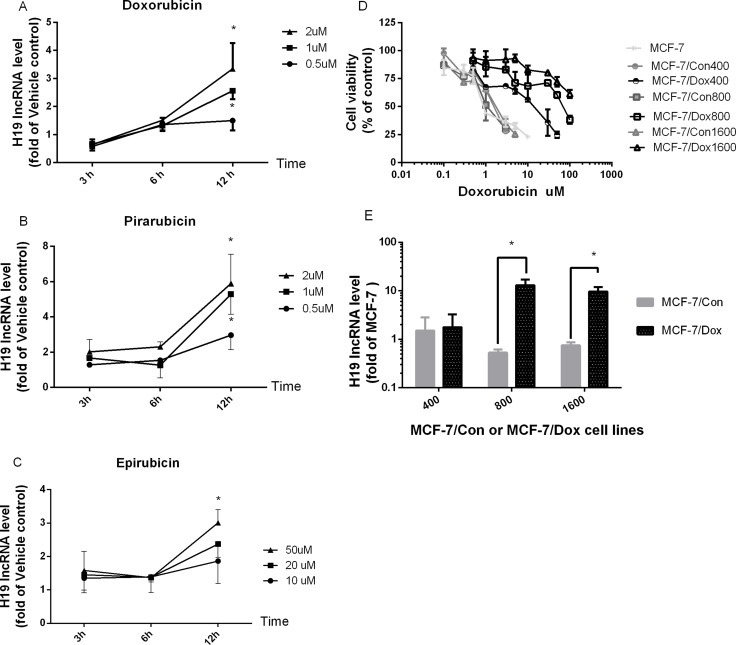
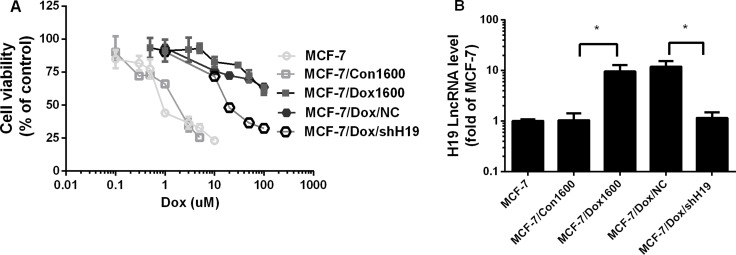
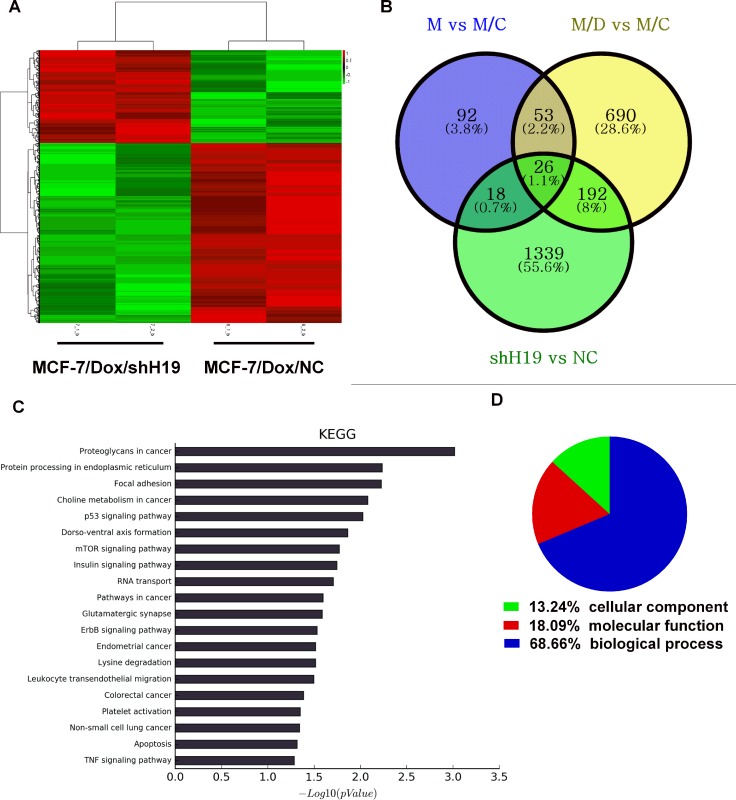
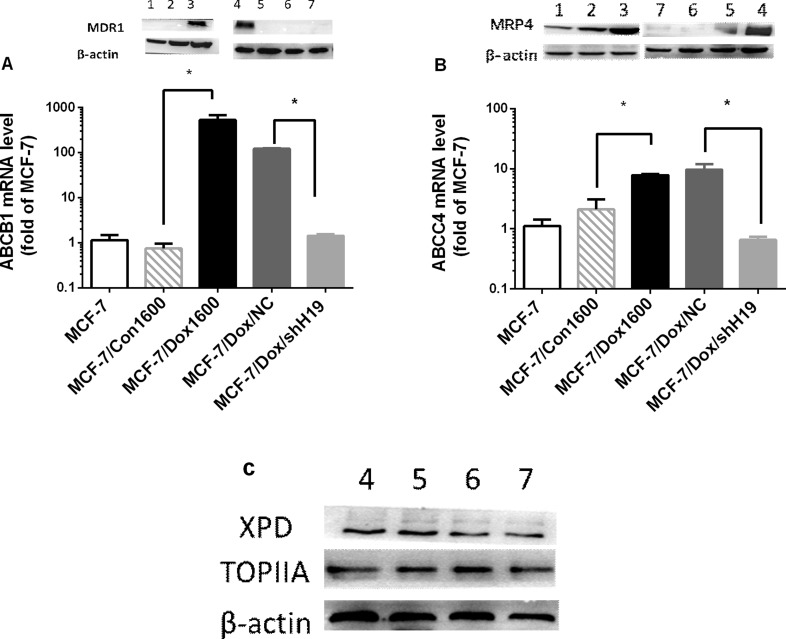
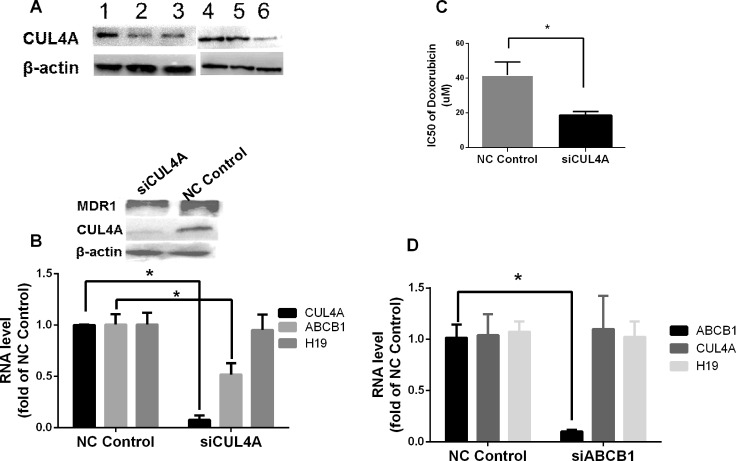
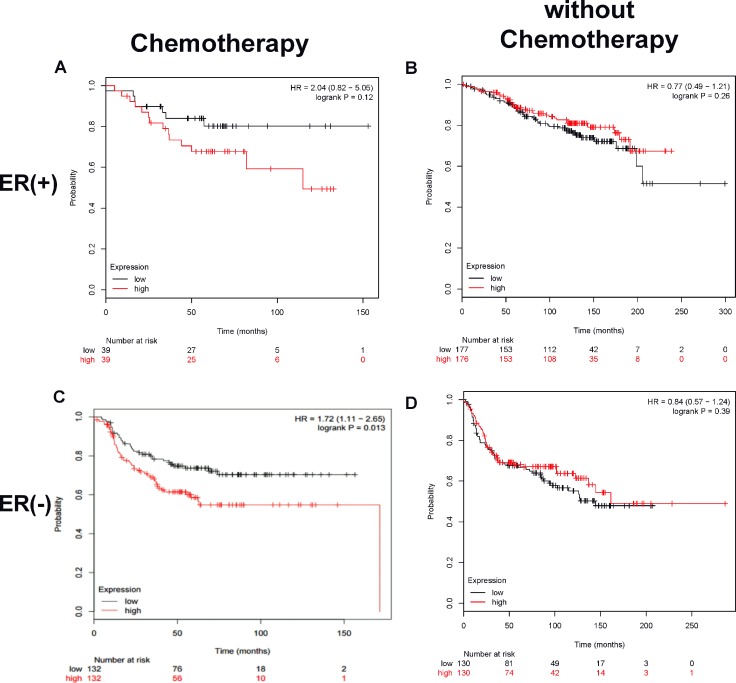
Development of chemoresistance is a persistent problem during cancer treatment. Long non-coding RNAs (LncRNAs) are currently emerging as an integral functional component of the human genome and as critical regulators of cancer development and progression. In the present study, we investigated the role and molecular mechanism of H19 lncRNA in chemoresistance development by using doxorubicin (Dox) resistance in breast cancer cells as a model system. H19 lncRNA expression was significantly increased in anthracycline-treated and Dox-resistant MCF-7 breast cancer cells. This H19 overexpression was contributed to cancer cell resistance to anthracyclines and paclitaxel as knockdown of H19 lncRNA by a specific H19 shRNA in Dox-resistant cells significantly improved the cell sensitivity to anthracyclines and paclitaxel. Furthermore, gene expression profiling analysis revealed that a total of 192 genes were associated with H19-mediated Dox resistance. These genes were enriched in multiple KEGG pathways that are related to chemoresistance. Using genetic and pharmacological approaches, we demonstrated that MDR1 and MRP4 were major effectors of H19-regulated Dox resistance in breast cancer cells as MDR1 and MRP4 expression was markedly elevated in Dox-resistant cells while dramatically reduced when H19 was knocked down. Moreover, we found that CUL4A, an ubiquitin ligase component, was a critical factor bridging H19 lncRNA to MDR1 expression, and a high tumor CUL4A expression was associated with low survival in breast cancer patients treated with chemotherapy. These data suggest that H19 lncRNA plays a leading role in breast cancer chemoresistance, mediated mainly through a H19-CUL4A-ABCB1/MDR1 pathway.

Keywords: ABCB1; CUL4A; breast cancer; chemoresistance; lncRNA H19.


Conflict of interest statement

CONFLICTS OF INTEREST The authors have no potential conflicts of interest with respect to the research, authorship, and/or publication of this article.

Figures

Figure 1
Figure 1. The expression of H19 lncRNA is increased in Dox-treated and Dox-resistant MCF-7 breast cancer cells
MCF-7 cells were treated with vehicle control or various doses of doxorubicin (A), pirarubicin (B) and epirubicin (C) for 3, 6 and 12 hours (h), respectively, and total cellular RNAs were extracted from harvested cells at the end of treatment. H19 lncRNA level was quantified by real-time RT-PCR, normalized to internal control and expressed as fold of corresponding vehicle control. The data in panels A–C are the mean ± SEM of three independent experiments. *p < 0.05 compared to corresponding controls. In panel D, dose-response analyses of doxorubicin effect on inhibition of viable cell numbers (cell viability) were carried out in parental MCF-7, Dox-resistant (MCF-7/Dox400, MCF-7/Dox800 and MCF-7/Dox1600) and the parallel control cells (MCF-7/Con400, MCF-7/Con800 & MCF-7/Con1600). Cells were plated in 96-well plates and treated with various doses of doxorubicin for 48 h. The viable cell number was expressed as percentage of corresponding vehicle controls and the values are the mean ± SEM of two or three independent triplicate experiments. In panel E, the levels of H19 lncRNA were determined by real-time RT-PCR in parental MCF-7, Dox-resistant (MCF-7/Dox) and the parallel control cells (MCF-7/Con), and expressed as fold of parental MCF-7 control. The values are the mean ± SEM of two to five independent experiments. *p < 0.05 compared to parallel control and parental MCF-7 group.
Figure 2
Figure 2. Knockdown of H19 lncRNA reverses chemoresistance in Dox-resistant breast cancer cells
In panel A, MCF-7 control, Dox-resistant MCF-7/Dox1600 and H19-knockdown MCF-7/Dox/shH19 cells were plated in 96-well plates and treated with various doses of Dox for 48 h. The number of viable cells (cell viability) was determined at the end of treatment and expressed as a percentage of corresponding vehicle controls. The data are the mean ± SEM of two or three independent triplicate experiments. In panel B the levels of H19 lncRNA were quantified using real-time RT-PCR in Dox-resistant MCF-7/Dox1600, H19-knockdown MCF-7/Dox/shH19 and the corresponding control cells and expressed as fold of parental MCF-7 control. The data are the mean ± SEM of three independent tests. *p < 0.05 compared to corresponding controls and parental MCF-7 cells.
Figure 3
Figure 3. Alternation in H19 lncRNA expression is associated with differential changes in gene expression profiles and signaling pathways in Dox-resistant cells
Panel A shows a heat map from hierarchical clustering of differentially expressed genes in H19-knockdown MCF-7/Dox/shH19 cells versus the control MCF-7/Dox/NC cells. The red-color represents up-regulated genes and the green color represents the down-regulated genes. Each row represents a single gene. Panel B is a Venn diagram depicting the commonly and differentially expressed genes among control, Dox-resistant and H19-knockdown Dox-resistant cells. After overlapping, a total of 192 genes were identified to be associated with H19-mediated chemoresistance. The blue circle represents the differentially expressed genes between parental MCF-7 (M) and parallel control MCF-7/Con1600 (M/C) cells, the yellow circle represents differentially expressed genes between the Dox-resistant MCF-7/Dox1600 (M/D) and the parallel control M/C, and the green circle represents differentially expressed genes between H19 knockdown MCF-7/Dox/shH19 (shH19) and the control MCF-7/Dox/NC (NC) cells. Panel C shows the KEGG analysis of the top 20 significantly altered pathways upon H19 knockdown in Dox-resistant cells. P values < 0.05 and false discovery rates < 0.05 were used as thresholds to select significant KEGG pathways. The horizontal axis, -log10(pValue), denotes the significance of specific pathways in H19-knockdown MCF7/Dox/H19 cells compared to the corresponding control MCF-7/Dox/NC cells. Panel D shows the GO analysis of the fraction of differentially expressed genes in H19-knockdown MCF7/Dox/shH19 versus the control MCF-7/Dox/NC cells in three GO classifications of cellular component, biological process and molecular function.
Figure 4
Figure 4. Doxorubicin chemoresistance is associated to H19-mediated upregulation of multidrug resistant proteins (MDR)
In panels A and B, the levels of ABCB1 and ABCC4 mRNAs, and MDR1 and MRP4 proteins were quantified respectively by real-time RT-PCR and Western blot analysis in various cell lines as indicated. The mRNA levels were expressed as fold of parental MCF-7 control, and the data are the mean ± SEM of three to five independent experiments. The inserts on top of panels A and B, and panel C are representative Western blots analyses of MDR1, MRP4, XPD and TOPIIA proteins, respectively. β-actin was used as an internal loading control in Western blot analysis. Lanes in all Western blots are denoted as: lane 1 – MCF-7, lane 2 – MCF-7/Con1600, lane 3 – MCF-7/Dox1600, lane 4 – MCF-7/Dox/NC and lanes 5 to 7 – Three independent MCF-7/Dox/shH19 clones. *p < 0.05 compared to the corresponding controls.
Figure 5
Figure 5. CUL4A is a key H19 downstream factor in H19-mediated chemoresistance in breast cancer cells
In panel A representative Western blots are shown to illustrate an increase in CUL4A level in Dox-resistant MCF-7/Dox1600 cells (lanes 1 & 4). β-actin was used as an internal loading control. Cells used in the Western blots are: lanes 1 & 4 – MCF-7/Dox1600, lane 2 – MCF-7/Con1600, lane 3 – MCF-7, lane 5 – MCF-7/Dox/NC, and lane 6 – MCF-7/Dox/shH19. In panels B and D the levels of H19 lncRNA, CUL4A and ABCB1 mRNA were quantified by real-time RT-PCR in Dox-resistant MCF-7/Dox1600 cells with a transit transfection of a negative control siRNA (NC control), a specific CUL4A siRNA (siCUL4A, 100 nM in panel B) or a specific ABCB1 siRNA (siABCB1, 100 nM in panel D) for 72 h. The RNA levels were expressed as fold of corresponding NC control and the values are the mean ± SEM of three independent experiments. *p < 0.05 compared to the corresponding NC control. In panel C Dox-resistant MCF-7/Dox1600 cells were transiently transfected with either a negative control siRNA (NC control) or a specific CUL4A siRNA (siCUL4A) at 100 nM concentration. Twenty-four hours after transfection, the cells were treated with either a vehicle control or various doses of doxorubicin for 48 h. Cell viability was determined at the end of experiments and IC50 was deducted from the dose-response study as described in the Methods. *p < 0.05.
Figure 6
Figure 6. A high tumor CUL4A expression correlates to low survival in breast cancer patients treated with chemotherapy
Kaplan–Meier plot analysis of survival curves by tumor CUL4A expression levels (low or high), estrogen receptor and chemotherapeutic status was carried out using public datasets as described in the Methods. Panels A and B are ER+ tumors treated with or without chemotherapy, respectively. Panels C and D are ER tumors treated with or without chemotherapy, respectively. The red line devotes the high CUL4A expression tumors and the black line, low CUL4A expression tumors. The hazard ratio (HR) value and log rank p value are indicated in each panel.

References

    1. Gradishar WJ, Anderson BO, Balassanian R, Blair SL, Burstein HJ, Cyr A, Elias AD, Farrar WB, Forero A, Giordano SH, Goetz M, Goldstein LJ, Hudis CA, et al. Invasive Breast Cancer Version 1.2016, NCCN Clinical Practice Guidelines in Oncology. J Natl Compr Canc Netw. 2016;14:324–54. - PubMed
    1. Chen W. Cancer statistics: updated cancer burden in China. Chin J Cancer Res. 2015;27:1. https://doi.org/10.3978/j.issn.1000-9604.2015.02.07 - DOI - PMC - PubMed
    1. Sivasubramaniam PG, Zhang BL, Zhang Q, Smith JS, Zhang B, Tang ZH, Chen GJ, Xie XM, Xu XZ, Yang HJ, He JJ, Li H, Li JY, et al. Breast Cancer Disparities: A Multicenter Comparison of Tumor Diagnosis, Characteristics, and Surgical Treatment in China and the U.S. Oncologist. 2015;20:1044–50. https://doi.org/10.1634/theoncologist.2014-0290 - DOI - PMC - PubMed
    1. Chen QN, Wei CC, Wang ZX, Sun M. Long non-coding RNAs in anti-cancer drug resistance. Oncotarget. 2017;8:1925–36. https://doi.org/10.18632/oncotarget.12461 - DOI - PMC - PubMed
    1. Spitzweg C, Morris JC, Bible KC. New drugs for medullary thyroid cancer: new promises? Endocr Relat Cancer. 2016;23:R287–97. https://doi.org/10.1530/ERC-16-0104 - DOI - PubMed

LinkOut - more resources