. 2017 Sep 23;8(54):92300-92311.
doi: 10.18632/oncotarget.21247. eCollection 2017 Nov 3.

Coenzyme Q10 inhibits the activation of pancreatic stellate cells through PI3K/AKT/mTOR signaling pathway

Affiliations

Coenzyme Q10 inhibits the activation of pancreatic stellate cells through PI3K/AKT/mTOR signaling pathway

Ran Xue et al. Oncotarget. .

Abstract

Aim: Pancreatic stellate cells (PSCs) have a vital role in pancreatic fibrosis accompanied by pancreatic ductal adenocarcinoma (PDAC) and chronic pancreatitis (CP). Any agents which can affect the activation of PSCs could become potential candidates for treatment strategies in PDAC and CP. Our aim was to explore the effect of Coenzyme Q10 (CoQ10) in the process of PSCs activation.

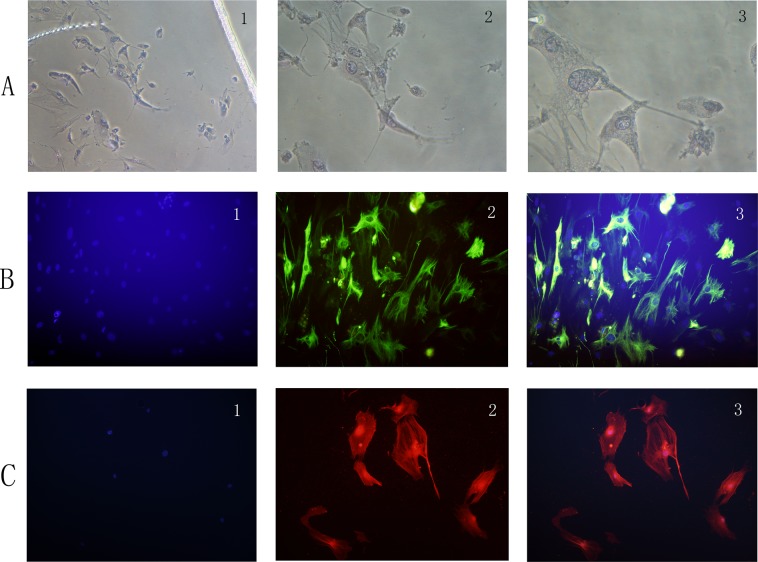
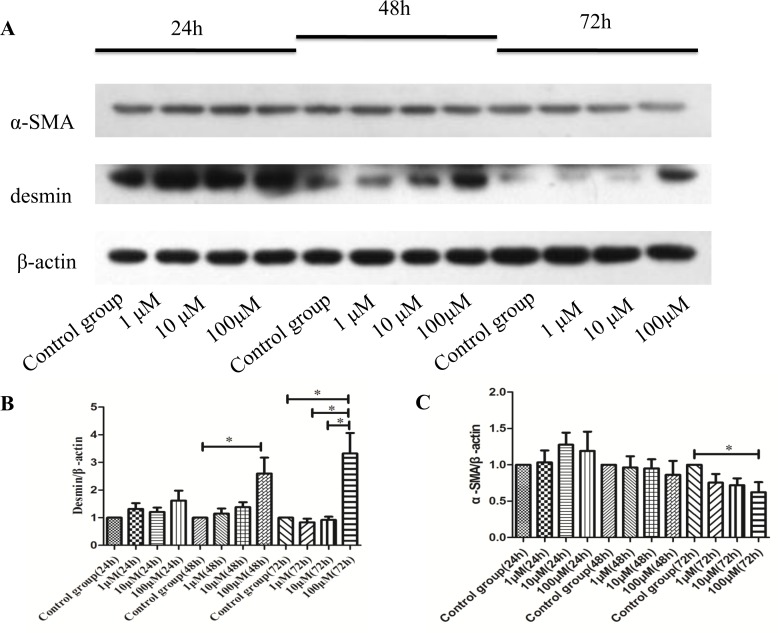
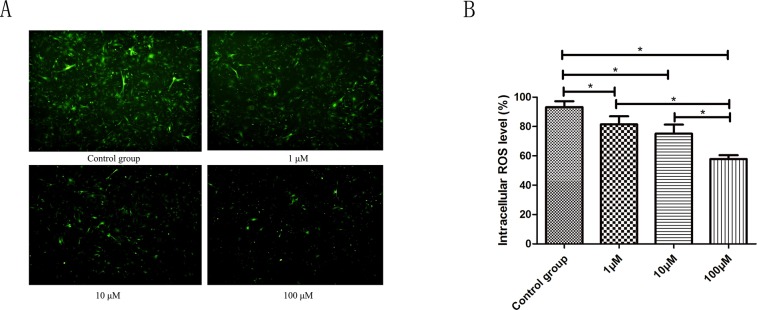
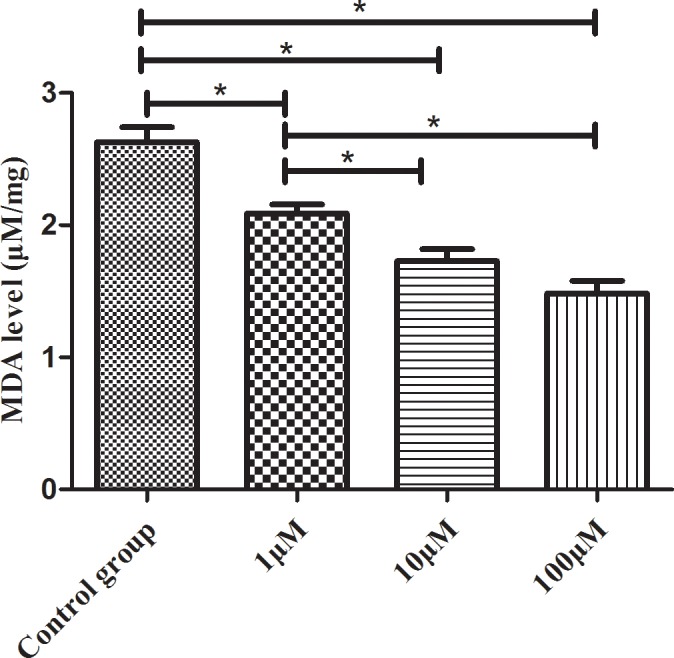
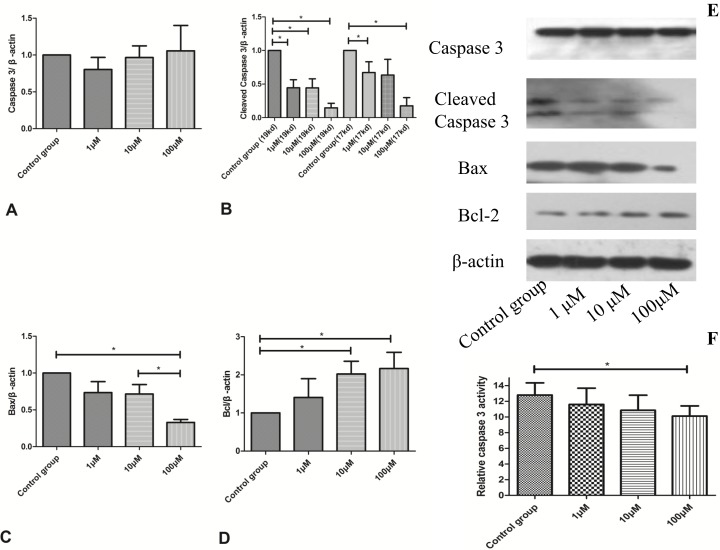
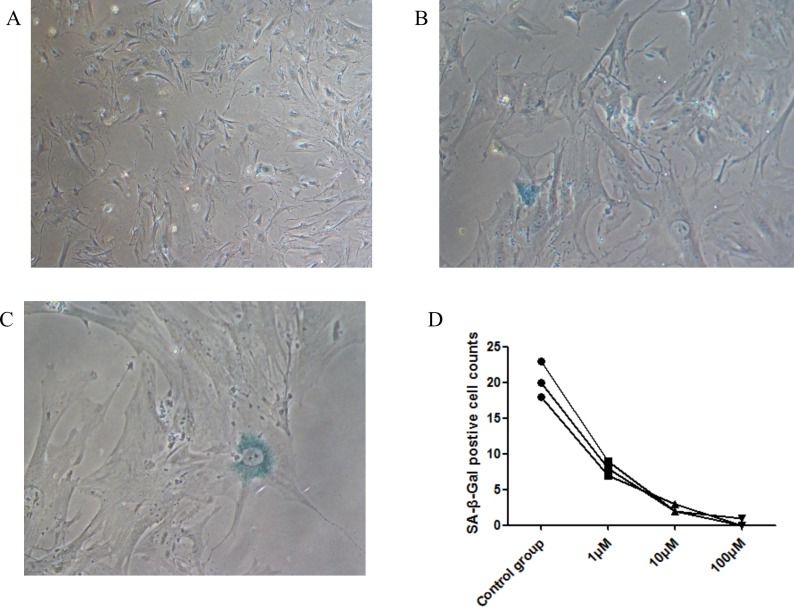
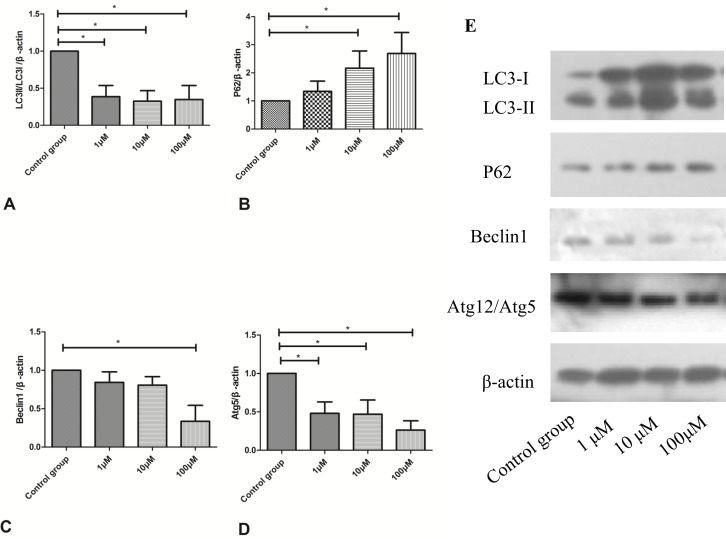
Methods: Isolated PSCs from C57BL/6 mice were treated with various dosages of CoQ10 (1, 10, and 100μM) and different time (24h, 48h, and 72 h). Effect of CoQ10 on autophagy, apoptosis, senescence and oxidative stress, as well as the activation of PSCs were analyzed by immunocytofluorescent staining, quantitative real time RT-PCR, western blotting, SA-β-galactosidase staining, malondialdehyde and reactive oxygen species (ROS) assay.

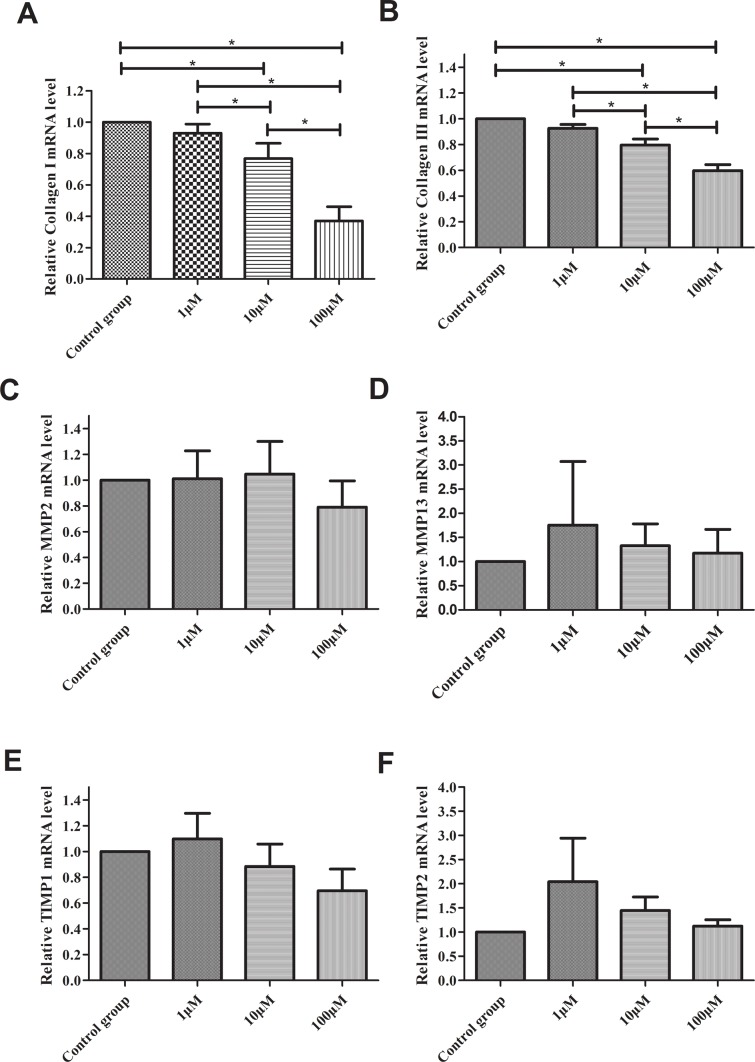
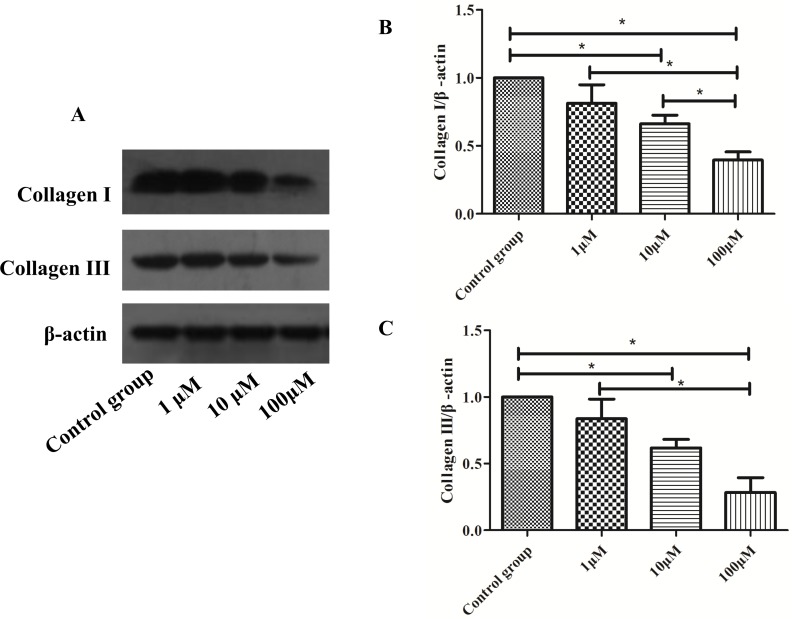
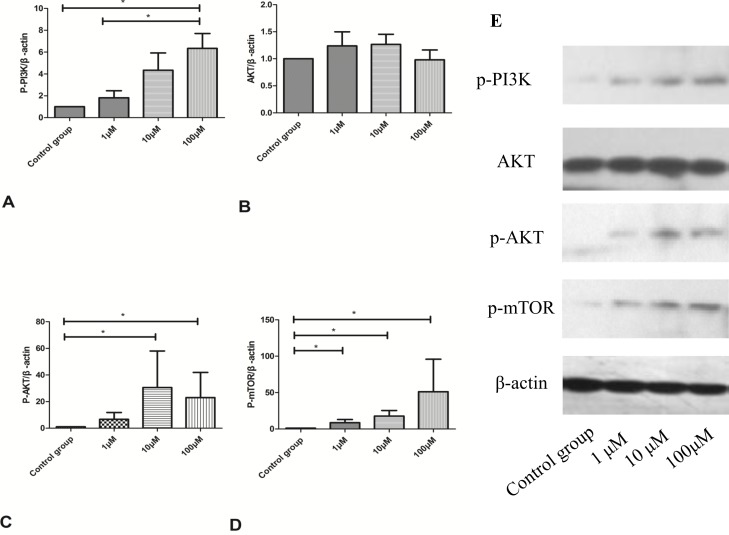
Results: Expression of α-smooth muscle actin, LC3II, Beclin1, Cleaved caspases-3 and Bax levels were significantly reduced in CoQ10 treatment groups. Meanwhile, compared with the control group, significant differences for the expression of desmin, P62, Bcl-2, p-PI3K, p-AKT and p-mTOR levels in CoQ10 treatment groups were found. Moreover, CoQ10 affected the secretion of extracellular matrix components for PSCs. Few SA-β-gal positive cells were found in CoQ10 treated groups. A significant decrease in ROS positive cells and malondialdehyde levels were observed after 72 h exposure to CoQ10.

Conclusions: Our finding suggests that CoQ10 inhibits the activation of PSCs by suppressing autophagy through activating the PI3K/AKT/mTOR signaling pathway. CoQ10 may act as a therapeutic agent in PSC-relating pathologies and/or anti-fibrotic approaches.

Keywords: activation; autophagy; coenzyme Q10; pancreatic stellate cell; reactive oxygen species.


Conflict of interest statement

CONFLICTS OF INTEREST No potential conflict (financial, professional, or personal) is relevant to the manuscript.

Figures

Figure 1
Figure 1
(A) PSCs have an angular appearance, contained lipid droplets by oil red O staining (1: original magnification, x50; 2: original magnification, x100; 3: original magnification, x200). (B) PSCs stain positively for desmin by IF (1: Hoechst 33258 staining, original magnification, x100; 2: Alexa Fluor 488 staining for desmin, original magnification, x100; 3: merge picture, original magnification, x100). (C) PSCs stain positively for α-SMA by IF (1: Hoechst 33258 staining, original magnification, x100; 2: Alexa Fluor 594 staining for α-SMA, original magnification, x100; 3: merge picture, original magnification, x100).
Figure 2
Figure 2
(A) Western blotting analysis for a-SMA, and desmin expressions of activated PSCs were performed after 24h, 48h and 72h with CoQ10 treatment. (B) Quantification of western blots for desmin expressions of activated PSCs after 24h, 48h and 72h with CoQ10 treatment compared to control group (*: P<0.05. N=3). (C) Quantification of western blots for a-SMA expressions of activated PSCs after 24h, 48h and 72h with CoQ10 treatment compared to control group (*: P<0.05. N=3).
Figure 3
Figure 3
(A) Real-time RT-PCR analysis for Col I. (B) Real-time RT-PCR analysis for Col III. (C) Real-time RT-PCR analysis for MMP2. (D) Real-time RT-PCR analysis for MMP13. (E) Real-time RT-PCR analysis for TIMP1. (F) Real-time RT-PCR analysis for TIMP2. (*: P<0.05. N=3).
Figure 4
Figure 4
(A) Western blotting analysis for Col I and Col III expressions of activated PSCs were performed after 72h with CoQ10 treatment. (B) Quantification of western blots for Col I expressions of activated PSCs after 72h with CoQ10 treatment compared to control group (*: P<0.05. N=3). (C) Quantification of western blots for Col III expressions of activated PSCs after 72h with CoQ10 treatment compared to control group (*: P<0.05. N=3).
Figure 5
Figure 5
(A) ROS levels were tested using fluorescence microscope by the DCFH-DA fluorescent probe. A significant decrease in ROS positive cells was observed after 72 h exposure to 1.0μM, 10μM, 100μM CoQ10 as compared to the control, respectively. (B) ROS levels were tested using flow cytometry by the DCFH-DA fluorescent probe. There were significant differences between CoQ10 treated group and control group for ROS level of PSCs (P<0.001) (*: P<0.05. N=3).
Figure 6
Figure 6. The MDA levels reduced in dose-dependent manners with CoQ10 treatment in PSCs (*: P<0.05. N=3)
Figure 7
Figure 7
(A) Quantification of western blots for Caspase 3 expression of activated PSCs after 72h with CoQ10 treatment compared to control group (N=3). (B) Quantification of western blots for Cleaved Caspase 3 expression of activated PSCs after 72h with CoQ10 treatment compared to control group (*: P<0.05. N=3). (C) Quantification of western blots for Bax expression of activated PSCs after 72h with CoQ10 treatment compared to control group (*: P<0.05. N=3). (D) Quantification of western blots for Bcl expression of activated PSCs after 72h with CoQ10 treatment compared to control group (*: P<0.05. N=3). (E) Western blotting analysis for Caspase-3, Cleaved Caspase-3, Bcl-2 and Bax expressions of activated PSCs were performed after 72h with CoQ10 treatment. (F) The decreased caspase-3 activity was observed in CoQ10 treated groups compared with controls (*: P<0.05. N=4).
Figure 8
Figure 8. Senescence is shown in PSCs with cytoplasmic blue staining of SA-β-gal
(A) Immunocytochemistry; original magnification, x50. (B) Immunocytochemistry; original magnification, x100. (C) Immunocytochemistry; original magnification, x200). (D) SA-β-gal positive cells counts decrease in dose-dependent manners with CoQ10 treatment in PSCs (N=3).
Figure 9
Figure 9
(A) Quantification of western blots for LC3II/LC3I expression of activated PSCs after 72h with CoQ10 treatment compared to control group (*: P<0.05. N=3). (B) Quantification of western blots for P62 expression of activated PSCs after 72h with CoQ10 treatment compared to control group (*: P<0.05. N=3). (C) Quantification of western blots for Beclin1 expression of activated PSCs after 72h with CoQ10 treatment compared to control group (*: P<0.05. N=3). (D) Quantification of western blots for Atg12/Atg5 expression of activated PSCs after 72h with CoQ10 treatment compared to control group (*: P<0.05. N=3). (E) Western blotting analysis for LC3-II, p62/SQSTM1, Beclin1 and Atg5 expressions of activated PSCs were performed after 72h with CoQ10 treatment.
Figure 10
Figure 10
(A) Quantification of western blots for p-PI3K expression of activated PSCs after 72h with CoQ10 treatment compared to control group (*: P<0.05. N=3). (B) Quantification of western blots for AKT expression of activated PSCs after 72h with CoQ10 treatment compared to control group (N=3). (C) Quantification of western blots for p-AKT expression of activated PSCs after 72h with CoQ10 treatment compared to control group (*: P<0.05. N=3). (D) Quantification of western blots for p-mTOR expression of activated PSCs after 72h with CoQ10 treatment compared to control group (*: P<0.05. N=3). (E) Western blotting analysis for PI3K/AKT/mTOR signaling pathway proteins expression of activated PSCs were performed after 72h with CoQ10 treatment.

References

    1. Apte MV, Haber PS, Applegate TL, Norton ID, McCaughan GW, Korsten MA, Pirola RC, Wilson JS. Periacinar stellate shaped cells in rat pancreas: identification, isolation, and culture. Gut. 1998;43:128–133. - PMC - PubMed
    1. Masamune A, Kikuta K, Satoh M, Satoh K, Shimosegawa T. Rho kinase inhibitors block activation of pancreatic stellate cells. Br J Pharmacol. 2003;140:1292–1302. - PMC - PubMed
    1. Ferdek PE, Jakubowska MA. Biology of pancreatic stellate cells-more than just pancreatic cancer. Pflugers Arch. 2017 - PMC - PubMed
    1. Apte M, Pirola RC, Wilson JS. Pancreatic stellate cell: physiologic role, role in fibrosis and cancer. Curr Opin Gastroenterol. 2015;31:416–423. - PubMed
    1. Xu Z, Vonlaufen A, Phillips PA, Fiala-Beer E, Zhang X, Yang L, Biankin AV, Goldstein D, Pirola RC, Wilson JS, Apte MV. Role of pancreatic stellate cells in pancreatic cancer metastasis. Am J Pathol. 2010;177:2585–2596. - PMC - PubMed