. 2017 Dec 1;358(6367):eaan4368.
doi: 10.1126/science.aan4368.

The target landscape of clinical kinase drugs

Affiliations

The target landscape of clinical kinase drugs

Susan Klaeger et al. Science. .

Abstract

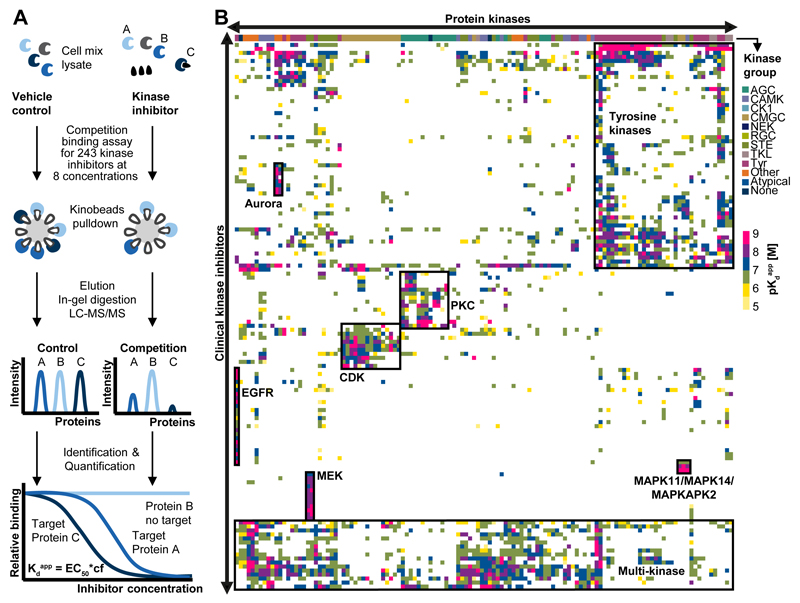
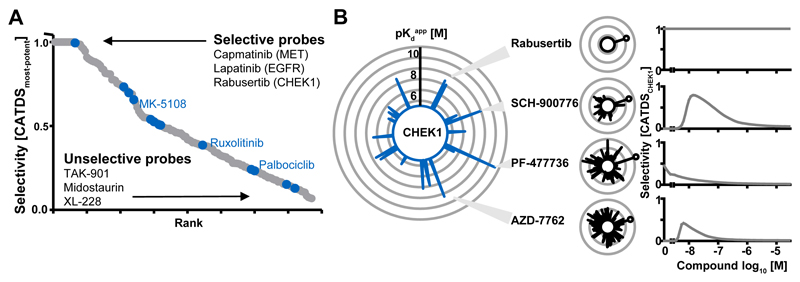
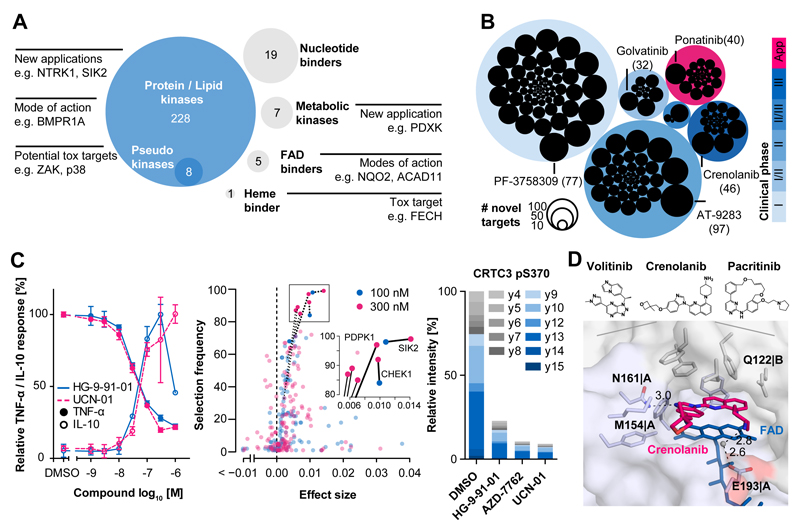
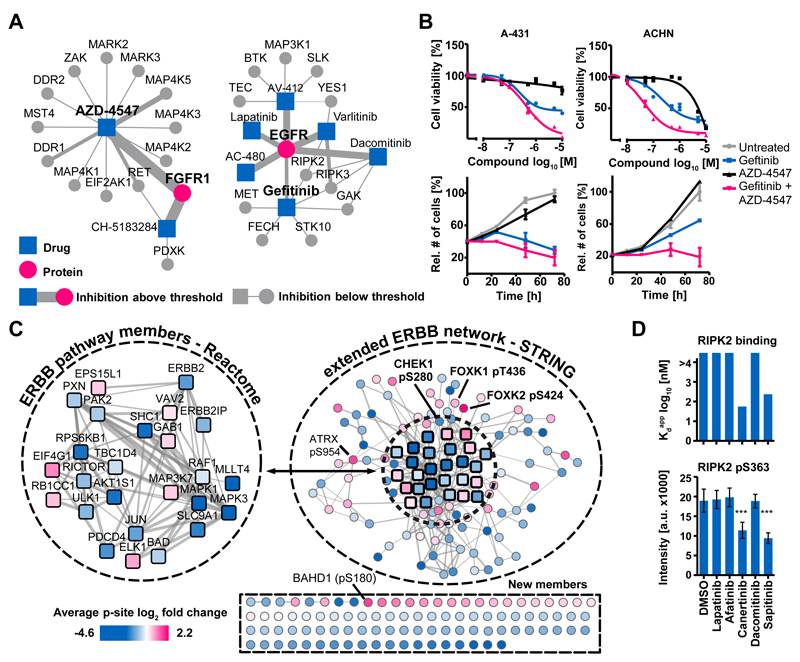
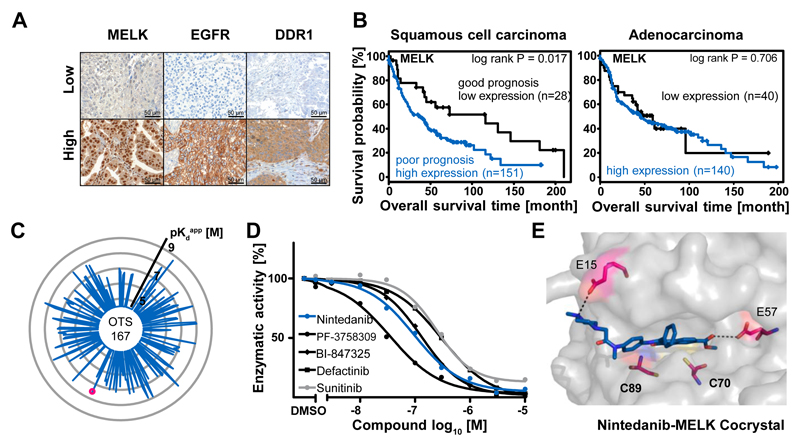
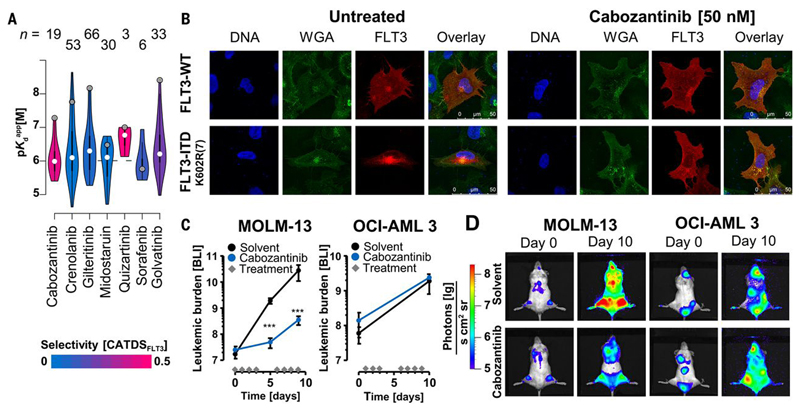
Kinase inhibitors are important cancer therapeutics. Polypharmacology is commonly observed, requiring thorough target deconvolution to understand drug mechanism of action. Using chemical proteomics, we analyzed the target spectrum of 243 clinically evaluated kinase drugs. The data revealed previously unknown targets for established drugs, offered a perspective on the "druggable" kinome, highlighted (non)kinase off-targets, and suggested potential therapeutic applications. Integration of phosphoproteomic data refined drug-affected pathways, identified response markers, and strengthened rationale for combination treatments. We exemplify translational value by discovering SIK2 (salt-inducible kinase 2) inhibitors that modulate cytokine production in primary cells, by identifying drugs against the lung cancer survival marker MELK (maternal embryonic leucine zipper kinase), and by repurposing cabozantinib to treat FLT3-ITD-positive acute myeloid leukemia. This resource, available via the ProteomicsDB database, should facilitate basic, clinical, and drug discovery research and aid clinical decision-making.


Conflict of interest statement

Competing financial interests:

The authors declare no competing financial interests.

Figures

Figure 1
Figure 1
The ‘druggable kinome’. (A) Schematic representation of the chemical proteomic workflow used to profile drug-protein interactions. Cell lysates were separately equilibrated with vehicle or increasing concentrations of each drug. Kinobeads were used to enrich kinases and other proteins from each lysate. Proteins were eluted from the beads, digested with trypsin, identified by liquid chromatography tandem mass spectrometry (LC-MS/MS) and quantified using the MS intensity of the identified peptides. Nonlinear regression determined the effective drug concentration at which half of the target protein was competed (EC50). EC50 values were converted into apparent dissociation constants (Kdapp) of each drug-target interaction by correcting for the depletion of a target protein from the lysate by Kinobeads (correction factor, cf). This workflow enabled the simultaneous measurement of interaction of one drug with hundreds of proteins in a single experiment. (B) Hierarchical clustering of kinase targets against clinical kinase drugs provided an overview of the ‘druggable’ kinome (color code depicts the Kdapp of drug-target interactions). Boxed regions represent groups of kinases and inhibitors thereof that ranged from highly selective (e.g., EGFR or MEK inhibitors) to relatively unselective interactions (e.g., tyrosine kinase and multi-kinase inhibitors). Further details are provided in Figures S1-2, Table S2-3 and the Supplementary Materials.
Figure 2
Figure 2
Selectivity of kinase inhibitors. The collective drug-protein interaction data enabled the definition of a new selectivity metric (Concentration and Target Dependent Selectivity, CATDS). CATDS measures the reduction in binding of a target protein to Kinobeads at a specified concentration relative to the summed reduction of all protein targets of the compound at the same concentration. (A) Rank-plot of kinase inhibitors according to CATDSmost-potent (most potent compound target at the respective Kdapp) showing that Lapatinib, Capmatinib and Rabusertib are highly selective inhibitors; whilst TAK-901, Midostaurin and XL-228 are not. Compounds previously designated as ‘chemical probes’ are shown in blue but are not necessarily selective. (B) The large radar plot shows all CHEK1 inhibitors (each spoke is a drug and the length of the spoke is indicative of binding affinity). The smaller plots depict the number and potency of targets for Rabusertib, SCH-900776, PF-477736 and AZD-7762. The plot to the right shows that the selectivity of each compound (CATDSCHEK1 at its Kdapp) is a function of drug concentration. AZD-7762 is a potent CHEK1 inhibitor, but is not selective at any concentration. PF-477736 and SCH-900776 are selective at lower doses and Rabusertib is selective at all doses as no other targets beside CHEK1 were observed in this screen. Further details are provided in Figures S3-4 and the Supplementary Materials.
Figure 3
Figure 3
Kinase inhibitor off-targets. (A) Target space of all clinical kinase inhibitors. Protein and lipid kinases plus several pseudokinases, metabolic kinases, FAD-binding proteins and a heme-binding protein were identified as kinase inhibitor binders. Novel interactions may be exploited for new applications of a drug, explain its mode-of-action or represent potential mechanisms of toxicity. (B) Number of novel targets for inhibitors grouped by clinical trial phase. Novel targets were determined for many compounds regardless of their clinical status. Each drug is shown as a black circle. The size of the circle is proportional to the number of targets not described in the literature or online databases (in brackets). (C) Validation of novel SIK2 inhibitors. Left panel: Treatment of lipopolysaccharide (LPS) stimulated primary mouse bone marrow-derived macrophages (BMDMs) with the novel SIK2-binding drug UCN-01 led to a reduction in TNFα production and an increase of IL-10 secretion indicating cellular activity of UCN-01. Error bars depict standard deviation of biological triplicates. Middle panel: Elastic net analysis performed at two concentrations of TNFα reducing compounds and control compounds without TNFα activity but overlapping target profiles ranks SIK2 as the top candidate responsible for the observed drug phenotype. Right panel: Quantitative parallel reaction monitoring (PRM) analysis showing a strong reduction of pS370 of CRTC3 (direct substrate of SIK2) in response to novel SIK2 inhibitors and confirming target engagement in primary BMDMs. (D) Co-crystal structure of NQO2 and Crenolanib (pink) showing that drug and co-factor (FAD, blue) simultaneously bind the active site of the non-kinase off-target NQO2 via π-stacking and contact to certain residues (sticks). The protein is shown as a semi-transparent surface. The co-crystal structures of Volitinib and Pacritinib as well as further details are provided in Figures S5-7 and the Supplement Materials.
Figure 4
Figure 4
From target to pathway engagement. (A) Visualization of protein-drug interactions in ProteomicsDB. Each node is a drug or a target and the size of each edge is proportional to the pKdapp of the interaction. Exploration of these networks can identify rational drug combinations to e.g., overcome drug resistance. (B) A-431 and ACHN cells that are partially sensitive to the EGFR inhibitor Gefitinib were treated with Gefitinib, the FGFR inhibitor AZD-4547, or a combination of both. Error bars depict standard error of the mean of technical triplicates. Cell viability and proliferation assays showed that the combination of the drugs was more effective than single compounds. (C) Quantitative phosphoproteomics was used to measure pathway engagement and identify common effects exerted by five kinase inhibitors (Lapatinib, Afatinib, Canertinib, Dacomitinib and Sapitinib) in the ERBB2-driven breast cancer cell line BT-474. Numerous phosphorylation sites mapped to known ERBB pathway members (Reactome) and further proteins were associated with the ERBB network using STRING. Many further phosphorylation sites were consistently and statistically significantly regulated by the drugs (p<0.01; scale: average log2 fold change across all inhibitors). These may represent novel functional effector proteins or pathway biomarkers of EGFR signaling and drug response. (D) Conversely, using the phosphorylation status of pS363 of RIPK2 is not reliable response marker for EGFR drugs because phosphorylation abundance of this site was only reduced by two from five of the EGFR inhibitors (bottom panel, error bars depict standard deviation) and instead only responded to inhibitors that are also RIPK2 inhibitors (top panel). Further details are provided in Figure S8 and the Supplementary Materials.
Figure 5
Figure 5
Characterization of drugs targeting MELK. (A) Kinobeads profiling of 15 non-small cell lung cancer (NSCLC) patient tumours and adjacent healthy tissue identified over-expression of MELK, EGFR and DDR1 in the tumours. Expression was confirmed by immunohistochemistry in a cohort of 375 NSCLC patients. (B) MELK over-expression correlated (log rank test) with poor overall survival in squamous cell carcinoma (SCC) but not adenocarcinoma (ADC). Therefore, MELK may have potential as a predictive survival marker in SCC. (C) Radar plot depicting targets and binding affinities of the designated phase I MELK inhibitor OTS-167 (each spoke is a direct binder and the length of the spoke is indicative of binding affinity) showing that the drug is a very unselective compound and suggesting that its biological activities may not be due to MELK inhibition alone. MELK is marked by a red dot. (D) Kinase activity assays confirmed that MELK binders identified in this study (e.g., Nintedanib) are also potent MELK inhibitors. (E) Co-crystal structures obtained for five MELK inhibitors revealed that e.g., Nintedanib forms strong interactions with residues E15 and E57 in the ATP pocket. There are additional residues (notably C70 and C89) that may be exploited to develop selective and potent irreversible MELK inhibitors. Further details are provided in Figure S9 and the Supplementary Materials.
Figure 6
Figure 6
Repurposing of Cabozantinib for the treatment of FLT3-ITD-positive acute myeloid leukemia (AML). (A) Violin plots comparing the potency and selectivity of some FLT3 inhibitors identified in this study (figures at the top indicate the number of targets of the respective compound). (B) Immunofluorescence staining of U-2 OS cells expressing FLT3-WT or the FLT3-ITD K602R(7) mutant protein. Staining for DNA (DAPI, blue), membrane structures (WGA, green) and FLT3 (red) showed that FLT3-WT predominantly localized to the plasma membrane; whilst the mutant protein accumulated in the perinuclear endoplasmatic reticulum. Cabozantinib treatment had no effect on FLT3-WT localization. FLT3-ITD localization to the plasma membrane was restored, analogous to the cellular phenotype of the wild-type protein. (C) Measurement of tumour burden by bioluminescence (photons [lg]/(s*cm2*sr)) in Cabozantinib (blue, n=6) or vehicle-treated mice (black, n=5) xenografted with MOLM-13 (FLT3-ITD) or OCI-AML3 (FLT3-WT) cells. Diamonds on the x-axis indicate days of drug treatment. Proliferation of MOLM-13 cells in Cabozantinib-treated animals was significantly slowed compared to vehicle control (day 5, p=0.00003; day 10, p=0.00013, unpaired t-test). No such effect was observed for animals xenografted with OCI-AML3 cells. Thus, Cabozantinib specifically inhibited FLT3-ITD but not FLT3-WT AML cells in vivo. (D) Representative whole animal bioluminescence imaging of MOLM-13 (FLT3-ITD) and OCI-AML3 (FLT3-WT) xenografts on day 0 and day 10 after Cabozantinib treatment showing that the drug slows the proliferation of AML cells in vivo. Further details are provided in Figure S10 and the Supplementary Materials.

Comment in

References

    1. Wu P, Nielsen TE, Clausen MH. FDA-approved small-molecule kinase inhibitors. Trends Pharmacol Sci. 2015;36:422–439. - PubMed
    1. Fabbro D, Cowan-Jacob SW, Moebitz H. Ten things you should know about protein kinases: IUPHAR Review 14. Br J Pharmacol. 2015;172:2675–2700. - PMC - PubMed
    1. Karaman MW, et al. A quantitative analysis of kinase inhibitor selectivity. Nat Biotechnol. 2008;26:127–132. - PubMed
    1. Gao Y, et al. A broad activity screen in support of a chemogenomic map for kinase signalling research and drug discovery. Biochem J. 2013;451:313–328. - PubMed
    1. Davis MI, et al. Comprehensive analysis of kinase inhibitor selectivity. Nat Biotechnol. 2011;29:1046–1051. - PubMed

Publication types

MeSH terms