. 2017 Dec 1;358(6367):eaal5081.
doi: 10.1126/science.aal5081.

Osteoblasts remotely supply lung tumors with cancer-promoting SiglecFhigh neutrophils

Affiliations

Osteoblasts remotely supply lung tumors with cancer-promoting SiglecFhigh neutrophils

Camilla Engblom et al. Science. .

Abstract

Bone marrow-derived myeloid cells can accumulate within tumors and foster cancer outgrowth. Local immune-neoplastic interactions have been intensively investigated, but the contribution of the systemic host environment to tumor growth remains poorly understood. Here, we show in mice and cancer patients (n = 70) that lung adenocarcinomas increase bone stromal activity in the absence of bone metastasis. Animal studies reveal that the cancer-induced bone phenotype involves bone-resident osteocalcin-expressing (Ocn+) osteoblastic cells. These cells promote cancer by remotely supplying a distinct subset of tumor-infiltrating SiglecFhigh neutrophils, which exhibit cancer-promoting properties. Experimentally reducing Ocn+ cell numbers suppresses the neutrophil response and lung tumor outgrowth. These observations posit osteoblasts as remote regulators of lung cancer and identify SiglecFhigh neutrophils as myeloid cell effectors of the osteoblast-driven protumoral response.


Figures

Fig. 1.
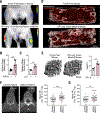
Fig. 1.. Lung tumors increase bone density in mouse models and in cancer patients.
(A) Fluorescence molecular tomography-based detection of OsteoSense signal (marking areas of active bone formation) in the femoral-tibial joint of KP lung tumor-bearing mice compared to their respective age- and sex-matched littermate tumor-free controls. Scale bar 5 mm. (B) Quantification of (A) (n = 10-12 femoral-tibial joints per group). (C) Detection of OsteoSense signal as in (A) but in LLC lung tumor-bearing mice and their tumor-free controls (n = 4 femoral-tibial joints per group). (D) Ex vivo confocal microscopy of representative OsteoSense signal (white) and vasculature signal (red; labeled with anti-Sca-1, anti-CD31 and anti-CD144 mAbs) in the sternum of tumor-free mice (top) and KP lung tumor-bearing mice (bottom). Scale bar 500 μm. (E) 3D reconstruction of micro-computed tomography (CT) scans (left) and quantification of trabecular bone volume fraction (BV/TV) (right) in the distal femoral metaphysis of KP1.9 lung tumor-bearing and control mice (n = 4 mice per group). Scale bar 500 μm. (F) CT-based trabecular bone density in patients with KRAS+ (positive) NSCLC and in control individuals. Left: representative axial non-contrast CT image of the 10th thoracic vertebra (T10) in a 53-year-old healthy woman who underwent non-contrast chest CT for cough and was found to have no abnormalities (control patient). Middle: a 53-year-old woman with KRAS+ NSCLC. Images are presented using the same window and level. The mean trabecular bone density of the region of interest depicted by a black oval was calculated in Hounsfield Units (HU) for all investigated individuals. Right: quantitative data from control (n = 35) and KRAS+ NSCLC (n = 35) patients. (G) As in (F), but showing mean trabecular bone density of KRAS- (negative) NSCLC patients (n = 35) and matched controls (n = 35). All figures show mean ± SEM. Statistical significance was calculated using an unpaired t-test. *p<0.05, **p<0.01, ***p<0.001. Abbreviations: AdCre: adenovirus-Cre; KP: Kras and p53 mutant lung tumors; LLC: Lewis Lung Carcinoma; NSCLC: non-small cell lung cancer.
Fig. 2.
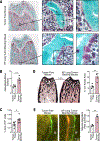
Fig. 2.. Lung tumors increase osteoblast activity in mice.
(A) Representative Goldner’s Trichrome staining of distal femur sections from a tumor-free mouse (top) and a KP lung tumor-bearing mouse (bottom) (n = 4 mice per group). Osteoblasts are indicated with white arrowheads. Scale bar 1 mm. See fig. S6A-D. (B) Number of osteoblasts per bone surface in distal femur trabecular bone from the same mice as in (A) (n = 4 mice per group). (C) Flow cytometry-based quantification of the percentage of bone marrow Ocn-YFP+ cells isolated from tumor-free mice and KP lung tumor-bearing OcnCre;Yfp mice (n = 6 mice per group). Ocn-YFP+ cells were defined as 7AAD Lin CD45 CD31 Ter119 YFP+. (D) Representative von Kossa staining (left) and quantification of mineralized bone (% von Kossa area, right) in femurs from the same mice as in (A) (n = 4 mice per group). Scale bar 1 mm. (E) Left: representative images of bone formation in trabecular bone of femurs from tumor-free mice and KP lung tumor-bearing mice. Double arrows depict distance between sequential injections of calcein (green) and demeclocycline (red). # denotes trabecular bone. Scale bar 10 μm. Right: quantification of mineral apposition rate (n = 3-4 mice per group). See fig. S7 for additional measurements. All figures show mean ± SEM. Statistical significance was calculated using an unpaired t-test. *p<0.05, **p<0.01. Abbreviations: KP: Kras and p53 mutant lung tumors; Ocn: osteocalcin; YFP: yellow fluorescent protein.
Fig. 3.
Fig. 3.. Ocn+ cells foster a tumor-promoting neutrophil response in mice.
(A) Comparison of lung weight (proxy of tumor burden) in KP1.9 tumor-bearing mice with reduced numbers of Ocn+ cells (green: OcnCre;Dtr mice treated with DT) or in tumor-bearing control mice (pink: mice lacking Cre or Dtr and treated with DT). DT was administered three weeks after tumor injection, i.e. when tumors were established. OcnCre;Dtr mice that did not receive DT were used as additional controls (grey). Data show delta lung weights (pre/post DT treatment) and are pooled from four separate experiments (n = 8-31 mice per group). Statistical significance was calculated using one-way ANOVA and Tukey’s multiple comparisons test. (B) Tumor burden in control mice or in mice with reduced numbers of Ocn+ cells. Mice are defined as in (A). Left: representative H&E-stained lung tissue sections. Scale bar 1 mm.; right: quantification of percent change in tumor area following DT treatment. Statistical significance was calculated using an unpaired t-test. Data are pooled from three independent experiments (n = 13 mice per group). (C) Ex vivo flow cytometry-based evaluation of neutrophils, monocytes and macrophages in lungs of tumor-bearing control mice or in mice with reduced numbers of Ocn+ cells, as defined in (A). Data were normalized to control (Ocn-sufficient) tumor-bearing mice and pooled from three independent experiments (n = 14-25 mice per group). Statistical significance was calculated using multiple t-tests. (D) Fold change in volume of KP lung tumor nodules pre and post anti-Gr-1 or isotype mAb treatment. Tumors were detected noninvasively by micro-computed tomography (n = 2-3 tumor nodules per mouse, 4-5 mice per group). Statistical significance was calculated using an unpaired t-test. (E) Number of CD11b+ Ly6G+ neutrophils per ml blood in KP1.9 tumor-bearing control mice (pink) or in mice with reduced numbers of Ocn+ cells (green). Mice are defined as in (A). Mice were analyzed three days after DT treatment (n = 4-5 mice per group) and cells were quantified by flow cytometry. Tumor-free OcnCre;Dtr mice were used as additional controls (grey). Statistical significance was calculated using one-way ANOVA and Tukey’s multiple comparisons test. (F) Tumor-bearing mice with reduced numbers of Ocn+ cells (mice depicted in black) were parabiosed with mice that had either normal numbers of Ocn+ cells (mouse in pink, control parabiont) or reduced numbers of Ocn+ cells (mouse in green, OcnCre;Dtr parabiont). Left: outline of the parabiosis experiments. Middle: quantification by flow cytometry of lung tumor-infiltrating granulocytes in tumor-bearing OcnCre;Dtr mice (depicted in black). Right: lung weight of the same mice (n = 4-6 mice per group). Statistical significance was calculated using an unpaired t-test. All figures show mean ± SEM. *p<0.05, **p<0.01, ***p<0.001, n.s. not significant. Abbreviations: DT: diphtheria toxin; KP: Kras and p53 mutant lung tumors; Ocn: osteocalcin.
Fig. 4.
Fig. 4.. Ocn+ cell-driven neutrophils show discrete phenotypes.
(A) Flow cytometry-based detection (left) of Ly-6G+ SiglecFhigh or low neutrophils from healthy lung tissue (top) and KP1.9 lung tumors (bottom). Plots are shown for gated live CD45+ CD11b+ cells. Representative cytospin images (right) are from FACS-sorted populations further stained with H&E. Scale bar 10 μm. (B) Fold change Ly-6G+ SiglecFhigh and Ly-6G+ SiglecFlow cell number in lungs from tumor bearing-mice when compared to tumor-free mice. Cells were assessed by flow cytometry (n = 6 mice per group). (C) Representative SiglecF mAb staining on cryo-preserved KP lung tumor tissue. Tumor areas are highlighted by dotted purple lines. Scale bar 50 μm. (D) Flow cytometry-based quantification of Ly-6G+ SiglecFhigh and Ly-6G+ SiglecFlow cells in tumor-bearing lungs of mice with either preserved Ocn+ cells (pink: control mice treated with DT) or reduced numbers of these cells (green: OcnCre;Dtr mice treated with DT) (n = 7-9 mice per group). (E) Ability of CD45.1+ Lin cKit+ hematopoietic precursors to produce tumor-infiltrating SiglecFhigh and SiglecFlow neutrophils upon transfer into KP tumor-bearing CD45.2+ recipient control mice (pink) or mice with reduced numbers of Ocn+ cells (green). Mice were treated as in (D). Results are shown as fold change relative to control mice. All figures show mean ± SEM and significance values were calculated using multiple t-tests. *p<0.05, **p<0.01, ****p<0.0001, n.s. not significant. Abbreviations: KP: Kras and p53 mutant lung tumors; Lin.: Lineage; Ocn: osteocalcin.
Fig. 5.
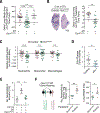
Fig. 5.. SiglecFhigh neutrophils show tumor-promoting phenotypes and functions in mice.
(A) Volcano plot showing differential gene expression between T-SiglecFhigh and T-SiglecFlow cells. Genes with false discovery rate (FDR) <5% and an absolute fold change (FC) >2 are highlighted in blue and red, denoting down- and up-regulated genes, respectively, in T-SiglecFhigh cells versus T-SiglecFlow cells. Statistical analysis is outlined in materials and methods. (B) Average expression levels of genes involved in angiogenesis, myeloid cell recruitment, tumor proliferation, cytotoxicity, extracellular matrix remodeling and immunosuppression in T-SiglecFhigh, T-SiglecFlow and H-SiglecFlow cells. (C) Representative histogram (left) and quantification of gMFI (right) of ROS activity, measured by rhodamine 123 fluorescence (oxidized Dihydroamine 123) using flow cytometry, in T-SiglecFhigh, T-SiglecFlow and H-SiglecFlow cells (n = 4-5 mice per group). (D) Representative flow cytometric dot plots showing CD11b+F4/80+ macrophages derived from splenic monocytes and cultured with T-SiglecFhigh, T-SiglecFlow or H-SiglecFlow cells (all gated on live CD45+ cells). Cultures in medium alone or with CSF-1 were used as negative and positive controls, respectively. Mean macrophage frequency ± SEM are shown in parentheses. (E) Quantification of macrophage numbers as in (D) with 4-5 replicates per condition. (F) KP1.9 tumor growth in mice following tumor cell co-injection with either T-SiglecFhigh, T-SiglecFlow or H-SiglecFlow cells (n = 4-5 mice per group). (G) Survival (Kaplan-Meier) plots of lung adenocarcinoma patients. Patients were stratified based on high (SiglecFhigh, top 25%) versus low (SiglecFlow, bottom 25%) expression of the humanized SiglecF neutrophil gene signature. p valued calculated using Cox regression method. See Methods for details. Panels (C-F) show mean ± SEM. **p<0.01, ****p<0.0001, n.s. not significant. Statistical values were calculated using one-way ANOVA (C and E) or two-way ANOVA (F). Abbreviations: CSF-1: colony-stimulating factor-1; gMFI: geometric mean fluorescence intensity; H: Healthy; KP: Kras and p53 mutant lung tumors; ROS: reactive oxygen species; T: Tumor.
Fig. 6.
Fig. 6.. sRAGE contributes to the osteoblast-induced neutrophil response.
(A) Bone marrow cells were cultured in osteogenic medium with serum from either tumor-free or lung tumor-bearing mice. Osteoblastic colonies were detected by alkaline phoshatase (ALP) staining. Graph shows the change in ALP+ (osteoblastic) colonies upon culture with serum from tumor-bearing mice compared to serum from tumor-free mice (n = 4 replicates per condition). (B) Protein content was investigated in the blood of lung tumor-bearing (TB) and tumor-free (TF) mice using protein arrays. Heat-map shows relative protein content that was detectable above background levels and reproducibly altered between two individual protein arrays. Heat map shows pooled results from the two arrays and are normalized to blood from tumor-free mice. Scale: 0.5- to 2.0-fold change. (C) Osteoblastic colony formation measured as in (A) but using bone marrow cells exposed or not to sRAGE. Graph shows the change in ALP+ (osteoblastic) colonies upon exposure to sRAGE compared to serum alone (n = 6 replicates per condition). (D) Flow cytometric evaluation of CXCR2 expression on developing neutrophils derived from bone marrow HSPCs of tumor-free mice. The cells were cultured without (left) or with (right) ST2 stromal cells, and with increased amounts of sRAGE (n = 3 replicates per condition). Abbreviations: CXCR2: C-X-C chemokine receptor 2; HSPCs: hematopoietic stem and progenitor cells; sRAGE: soluble receptor for advanced glycation endproducts.

Comment in

References

    1. Coffelt SB, Wellenstein MD, de Visser KE, Nat Rev Cancer 16, 431 (2016). - PubMed
    1. Hanahan D, Coussens LM, Cancer Cell 21, 309 (2012). - PubMed
    1. Gabrilovich DI, Ostrand-Rosenberg S, Bronte V, Nat Rev Immunol 12, 253 (2012). - PMC - PubMed
    1. Engblom C, Pfirschke C, Pittet MJ, Nat Rev Cancer 16, 447 (2016). - PubMed
    1. McAllister SS, Weinberg RA, Nat Cell Biol 16, 717 (2014). - PMC - PubMed

Publication types

MeSH terms